
Abstract
This article describes the core algorithms of the perception system to be included within an autonomous underwater vehicle (AUV). This perception system is based on the acoustic data acquired from side scan sonar (SSS). These data should be processed in an efficient time, so that the perception system is able to detect and recognize a predefined target. This detection and recognition outcome is therefore an important piece of knowledge for the AUVs dynamic mission planner (DMP). Effectively, the DMP should propose different trajectories, navigation depths and other parameters that will change the robot's behaviour according to the perception system output. Hence, the time in which to make a decision is critical in order to assure safe robot operation and to acquire good quality data; consequently, the efficiency of the on-line image processing from acoustic data is a key issue.
Current techniques for acoustic data processing are time and computationally intensive. Hence, it was decided to process data coming from a SSS using a technique that is used for radars, due to its efficiency and its amenability to on-line processing. The engineering problem to solve in this case was underwater pipeline tracking for routine inspections in the off-shore industry. Then, an automatic oil pipeline detection system was developed borrowing techniques from the processing of radar measurements. The radar technique is known as Cell Average – Constant False Alarm Rate (CA – CFAR). With a slight variation of the algorithms underlying this radar technique, which consisted of the previous accumulation of partial sums, a great improvement in computing time and effort was achieved. Finally, a comparison with previous approaches over images acquired with a SSS from a vessel in the Salvador de Bahia bay in Brazil showed the feasibility of using this on-board technique for AUV perception.
1. Introduction
Perception is one of the key issues in autonomous robotics. It usually involves robot self-perception (position, attitude, remaining energy, faulty situations), as well as perception of the environment (obstacle avoidance, mapping objects, special waypoints). Hence, the perception system is essential for the robot to succeed in executing any field mission. Particularly in the hostile and unknown underwater world, a high quality perception system is necessary in order to build an AUV robust enough to withstand the main oceanic perturbations. Other important and necessary systems are the dynamic mission planner and the guidance and control systems [1–6].
The use of AUVs has been growing in the last decade, as they are a good tool for the sustainable exploitation of oceanic resources, for example, exploration in the deeper seas. Missions like underwater pipeline inspections and maintenance, prospection studies, mine detection, debris or other object recognition are among the preferred automated tasks to be developed for modern AUVs [7–9]. As seen in the literature, the technology for such task automation has shown a strong improvement in three main areas: 1) AUV technology; 2) perception devices for the underwater world, i.e., SONAR (Sound Navigation And Ranging); 3) novel acoustic image processing techniques. Regarding point (1), AUVs have undergone great improvement regarding constructive aspects and new materials, control algorithms and powerful computation tools [1–2]; [5]; [8–9]. For point (2), many devices like the multi-beam echo-sounder (MBE), side scan sonar (SSS) and synthetic aperture sonar (SAS) appear able to acquire high resolution data [10–11]. SSS is preferred due to its very good quality/cost trade-off. It has been tested in deep water conditions and is one of the most adequate choices for the detection task in underwater environments. The conventional SSS provide lines of acoustic pulses that vary from 200 to 2000 samples. Note also that the bigger quantity of samples implies more computational effort. Finally, with respect to point (3), there is still a great deal of work to be done. In effect, while AUV and sonar technology is mature enough for the aforementioned automated tasks and even though many approaches of acoustic images processing are currently available, they still require a strong on-line computational effort to achieve self and environmental perception. These acoustic image processing approaches can be analysed from different points of view regarding their speed, efficiency, resources needed, precision and robustness [12–24].
Sonar and radar (Radio Detection And Ranging) technologies share similar features in their processing. In addition, radars are used to detect and recognize vehicles with faster dynamics, like airplanes, dealing also with electromagnetic waves that are faster than acoustic ones [25–26]. The key concept of the present approach is to migrate radar techniques to sonar acoustic data processing. A group of target detection techniques widely used in radar technology is known as CFAR (Constant False Alarm Rate), described in detail in [25]. This group of techniques maintain a constant false alarm rate computed from the last
Underwater pipeline and cable tracking is an interesting case study of AUV application with intensive on-board image processing for automatic and autonomous task development. To fulfil this objective, it is necessary to detect the pipeline first, then track it while obtaining other useful information like the pipeline situation (if buried with free-span, with corrosion, with near debris and others).
This article will describe in detail a CA-CFAR based algorithm for the acoustic image processing of SSS data for quantitative analysis of its feasibility to on-line processing. The main objective is to determine if it is efficient enough to be used for on-board and on-line processing in an AUV as an essential input for the AUVs dynamic mission planner. Using a set of data taken from SSS acoustic images of the seafloor of Salvador de Bahia, Brazil, it will be shown that with a refinement in computation, CA-CFAR could make a drastic reduction in time and computational resources.
This work is organized in the following way: section 2 shows the acoustic input data formation. Then, in section 3, an automatic processing chain is presented for a pipeline detection system, focusing on each of the processes. Section 4 shows the basic concepts of the detection theory with CA-CFAR and accumulated CA-CFAR. In section 5, the experimental result, analyses and comparisons with traditional CA-CFAR [27] and partial sums CA-CFAR [28] are presented. Finally, section 6 discusses the conclusions obtained from the work.
2. Acoustic Image Forming from a SSS
The SSS is a very interesting tool for high-resolution mapping of the seabed due to its excellent cost/quality trade-off [10]; [46]. It has been tested in deep water with satisfactory results [29–32]. Though SAS provide higher quality imagery and has been used in numerous works [33–37], it is not yet clear that it is better for automated target detection and recognition purposes. Reports about the use of MBE to explore the sea floor in detail are also given in [29]; [38–40].
The SSS is formed by a group of transducers that are mounted on both sides of the AUV. In each data acquisition cycle, these transducers scan sideways and downward, constituting a plane that advances in the direction in which the vehicle travels, the along-track. The direction that is perpendicular to the vehicle's straight movement is called across-track. Figure 1 shows an idealized representation of the operation of a SSS mounted on an AUV. The transducers on both sides of the sonar send out oblique acoustic signals in the shape of a fan. These acoustic pulses normally oscillate between 100 and 500 kHz. The port side (left) and starboard (right) sides of the images are scanned separately. The acoustic pulses travel through the water column, hit the seafloor and the echo, also named backscattering, is returned to the reception sensor where its amplitude is quantified. This amplitude depends on the angle of incidence and the cover of the seafloor. The echoes coming directly from the seafloor constitute the true returned signal. There are also multiple bounces off the seafloor or the sea surface that constitute reverberation or undesired echoes (multi-path). The regions under (nadir) and above (zenith) the sonar correspond to points of low and high reflection off the surface of the seafloor and the surface of the sea, respectively.

Idealized operation of a Side Scan Sonar on board of an AUV
The data acquired are projected on a line traced along the seafloor. This scanning line is known as a swath. The acoustic data associated with this exploration line represents an observation of the reflected intensity depending on the range of the SSS and the relative angle between the AUV and the seafloor. If the vehicle is moving in a straight line at a steady speed, the deployment of successive swaths will build an acoustic image of the seafloor [11].
3. Underwater pipeline detection system
An automatic processing chain is applied to each of the acoustic lines acquired by the SSS. This processing chain consists of a group of serial processes. The input to one process is the output of the previous process. Figure 3 shows a block diagram of the simple processing chain utilized in the implemented detection system. As shown, the inputs to the whole processing chain are acoustic lines or swaths provided by the SSS and its output is a list of geo referenced (NED) coordinates of the pipeline position.

Coordinate systems defined on the seabed and on the image. The coordinate system defined on the seabed plane may, to align the y direction with the trajectory of the vehicle [43].

Automated processing chain for the detection of the pipeline position coordinates
Before applying the target automatic detection processes, the acoustic data are pre-processed with the objective of improving the input to the detection process.
The first process consists of
Thus, an acoustic image is defined as a function of two dimensions of discrete finite values s[m,n], where [m,n] are the coordinates 1 of the image matrix [15]. This intensity, or backscatter force of the sea floor, is defined as b(x,y), where (x) and (y) are part of a system of rectangular coordinates (x,y,z) defined of the sea floor, as illustrated in Figure 2 [43].
This coordinates system is defined as follows: y is aligned with the along-track direction and positive x represents the starboard across-track direction. Denoting by (s̄[l,n]) the original image and by (h[n]) the height of the water column in pixels at the nth line, it can be stated that:

For m = 0, ±1,…,±(Nm – 1)and n = 0,1,…,Nn – 1, where (N n ) is the maximum number of along-track lines in the slant-range corrected image and (Nm) is the maximum number of pixels per across-track line. Since the value of (l) corresponding to (m) will in general be non-integer; this equation assumes the use of an appropriate technique for interpolating the lines of the original image at non-integer coordinates. Therefore, a linear interpolation was used for this work.
The next process consists of the
Another important issue is
The next step, shown in Figure 3, is
The final step in this processing chain is the
With two of these geo-referenced points as neighbours, a vector was constructed. This vector pointed from the older geo-referenced detection point to the more recent, successive one. The vector was given as a reference to the guidance system of the AUV.
4. Automatic Detection using CA-CFAR
The problem of detection was summed up by analysing each sample with the purpose of detecting the presence or absence of a target. Detection techniques are generally implemented in analysing the information of adjacent samples. In [27], two hypotheses were defined for this analysis: 1) the sample is the result of interference (H0) in this case, acoustic reverberation; 2) the sample was the result of a combination between interference and echoes of a target (H1), in this case reverberation and backscattering respectively. Consequently, the detection consisted of examining each sample and selecting one of the above two hypotheses as best fitting. If the hypothesis H0 was the most appropriate, the detection system declared that the target was not present. On the other hand, if hypothesis H1 was the most appropriate, the detection system declared that the target was present. Due to the signals being described statistically, the choice between these two hypotheses represents an exercise in statistics decision theory [44].
In the particular case of acoustic images, it was assumed that man-made structures on the sea floor were usually more reflective than the surrounding sediment [46]. For this reason, one of the detection alternatives was centred on finding the backscattering maximum intensities, also called the acoustic highlight, which varies considerably according to the relative sonar orientation the target. In fact, it can fall below the detection threshold, causing the target to appear invisible to the sonar.
On the other hand, an additional relevant characteristic of SSS images is that the objects that stand out above the seafloor generate shadows; that is to say, areas where the echo intensity is frequently lower than the level coming from the seafloor. Shadow length depends on the vertical height of the object. Thus, there are other detection alternatives that utilize these shadows. Due to the data being acquired from a moving vehicle, the sonar geometry as it concerns the target was variable. In this case, a shadow can be present even when the acoustic highlight is not. Thus, it is desirable to combine both detection approximations, as is proposed in this work.
The dark grey cells in Figure 4 represent the neighbouring data, which will be averaged to estimate the noise parameters. These cells are the reference cells (N). Note that each cell represents one pixel. Also in Figure 4, a file vector of (1xn) cells is depicted. The length of this file vector depends on the resolution of the SSS. The lighter grey cells, immediately next to the test cell (xi), are called guard cells (G). These cells are excluded from the average. The reason for this is that if the target is present, then the neighbouring cells will contain similar values. In this case, the acoustic highlight in the cells surrounding xi should contain the same values of acoustic intensity and should not be representative only by its own value. The increase in acoustic highlight of the target should tend to increase the estimation of the reverberation parameters.
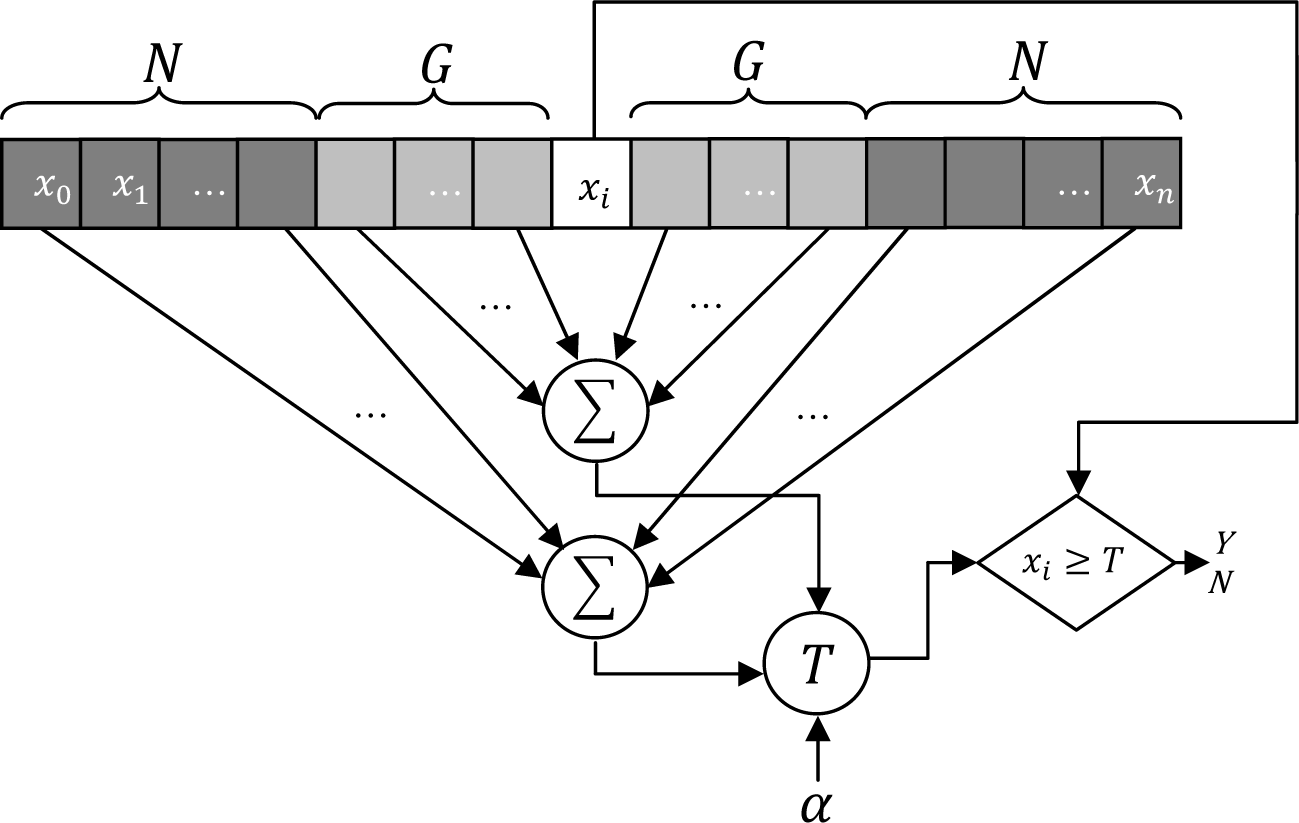
Generic architecture for the CA-CFAR detection process [45]
The total number of reference and guard cells is calculated utilizing the equations (2) and (3), with G < N (see Figure 4):


The procedure for determining the detection threshold (T) is described below. Let us consider the case of a Gaussian reverberation with a square law detector. The probability density function (pdf) for any cell xi ≥ 0 has only one free parameter, which is the mean of the reverberation power (β2). Likewise, the process estimates the mean of the reverberation power in the test cell using the adjacent cells' data, using the following expression:
It is supposed that the content of (Nc) cells, which are neighbouring ones to the cell under test xi, will be used to estimate (β2). Another supposition is that reverberations are independent and identically distributed (i.i.d). Then, the joint probability density function fx̄ι for a vector x̄i = (x1,x2,…,xNc) of neighboring cells (Nc) is:

Using (4):

The equation (5) is the likely function Λ for the vector of observed data x̄. The maximum estimated likelihood (MET) of (β2) is obtained by maximizing the equation (5) with respect to (β2) [44]. Mathematically, it is equivalent to and generally easier to maximize the log-likelihood function thus [27]:

Deriving equation (6) with respect to (β2) and equating it to 0 yields:

The detection threshold (T̂) required is estimated as a scalar multiple α>0 of the reverberation power:

An adaptive threshold can be considered at a constant rate or probability of false alarm; however, the reverberation levels will vary. The threshold (T̂) and the probability of false alarm (Pfa) are random variables. The CFAR detector is considered if the value of the probability of false alarm does not depend on the current value of (β2). Combining equations (7) and (8) yields the expression for the estimated threshold:

Defining

This pdf of (T̂) is known as the Erlang density with parameters (Nc) and (

The observed (Pfa) with the estimated threshold will be exp(–T̂/β2), which is also a random variable. Its expected value was computed as:

Completing the standard integral and carrying out some algebraic manipulation, the final result was obtained:

For an expected (P̄fa), the required value of the multiplier (α) is acquired from solving equation (13):

Note that (P̄fa) does not depend on the reverberation power (β2), but on the number (Nc) of neighbouring cells and the threshold multiplier (α). Thus, the technique of cell average exhibits the CFAR behaviour. This is significant, because a drastic reduction of computation times can be obtained, as will be demonstrated experimentally in the following section.
4.1 Accumulated Cell Average Constant False Alarm Rate ACA-CFAR
As demonstrated in [28], it was possible to achieve pipeline detection from acoustic images of a SSS with the standard CA-CFAR. In addition, a variation of this approach, Partial Sums CA-CFAR, was introduced and tested experimentally. In this work, a refinement of CA-CFAR was introduced and evaluated with field data. It was named ACA-CFAR for Accumulated Cell Average Constant False Alarm Rate. It consisted of a continuous average of the values of cells with which to calculate the threshold (T). Within each step, a reference cells window and a guard cells window were taken and averaged using equation (7). With this value, the threshold was estimated and then the algorithm checks for the presence of a target were conducted. In order to perform this computation, it was necessary to define a window of (Nc) reference cells that slid over all samples until the process was complete. Consequently, for each estimation of the adaptive threshold for every sample to be analysed, (Nc) access to memory for the calculation of the sum of the reference cells and (Gc) new access to memory for the guard cells were required. This calculation required considerable computational resources and time to analyse the entire sample data. For this reason, the proposed improvement focused on the calculation of the sum of reference and guard cells (see Figure 4).
Figure 5 shows an example of a samples distribution (x1,…,xn) and the accumulated summation computation (Acc1,…,Accn) for the reference cells with N = 1 (Nc = 3; GC = 0; please refer to eq. (2) and (3)). The ACA-CFAR technique computed a vector beforehand of absolute accumulated samples (


Computation of the sum of the reference cells for the Accumulated CA-CFAR (with N = 1 → Nc = 3)
In this way, the summation for each cell (Σj) or the acoustic intensity value for each cell could be computed using eq. (16). In other words, the acoustic intensity value for each cell was the sum of the accumulated sample values at the present position (j) plus the number of reference cells (N), varying the sub index i from i=0 to (
Notice should be taken of the initialization of the computation over the data samples vector. When the index in the summation (Σj) is smaller than the number of reference cells (j < N).), the computation of the absolute accumulated sample of the present position plus the number of reference cells (
From analysing the accumulated CA-CFAR, it can be observed that with only two memory accesses at maximum, the value of the summation for any cell could be obtained. This computation was done prior to threshold estimation and detection checking. This method was identically applied to compute the summation of the guard cells.
5. Experimental Results
The algorithms were originally developed with MATLAB and were then ported to code written in C++, taking advantage of the data structure within OpenCV. The algorithms were executed on a PC with a CPU 2GHz Intel(R) Core(TM) 2 Duo and 2GB RAM memory, with Linux OS. The SSS was a StarFish 450F, utilizing advanced digital CHIRP acoustic technology. Even when the AUV's on-board CPU facility was a FitPC-2 with different resources, the experiments consisted in the preliminary phases of comparison studies among different detection approaches. It was expected that the best one would be selected to be ported to the run-time environment at the ICTIOBOT AUV prototype [1], travelling at an almost constant speed of 2m/sec.
5.1 Data
The experimental data employed in this work were acoustic images of a SSS taken from a vessel on the seafloor of Salvador de Bahia, Brazil, where an exposed pipeline has been laid down. For SSS detection, it is necessary that the pipeline be fully or partially exposed. If buried, the perception sensor would have needed a magnetic tracker or a sub-bottom profiler.
The pipeline tracking had two stages: the first was initiated at latitude −12° 50'49,5“ and longitude −38° 31' 23,03”, and concluded at latitude −12°; 51' 33, 28“ and longitude −38° 32'48,48”. 50500 Lines of valid acoustic data were collected, yielding 101 images at 1000×500 pixels for testing the algorithms. The second stage, started at latitude −12° 51' 33,04“ and longitude −38° 32'48,14”, and concluded in latitude −12° 50'16,1“ and longitude −38° 30'37,14”, collected 47000 lines of acoustic data totalling 94 images of the same size as the ones obtained for the first test stage.
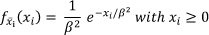
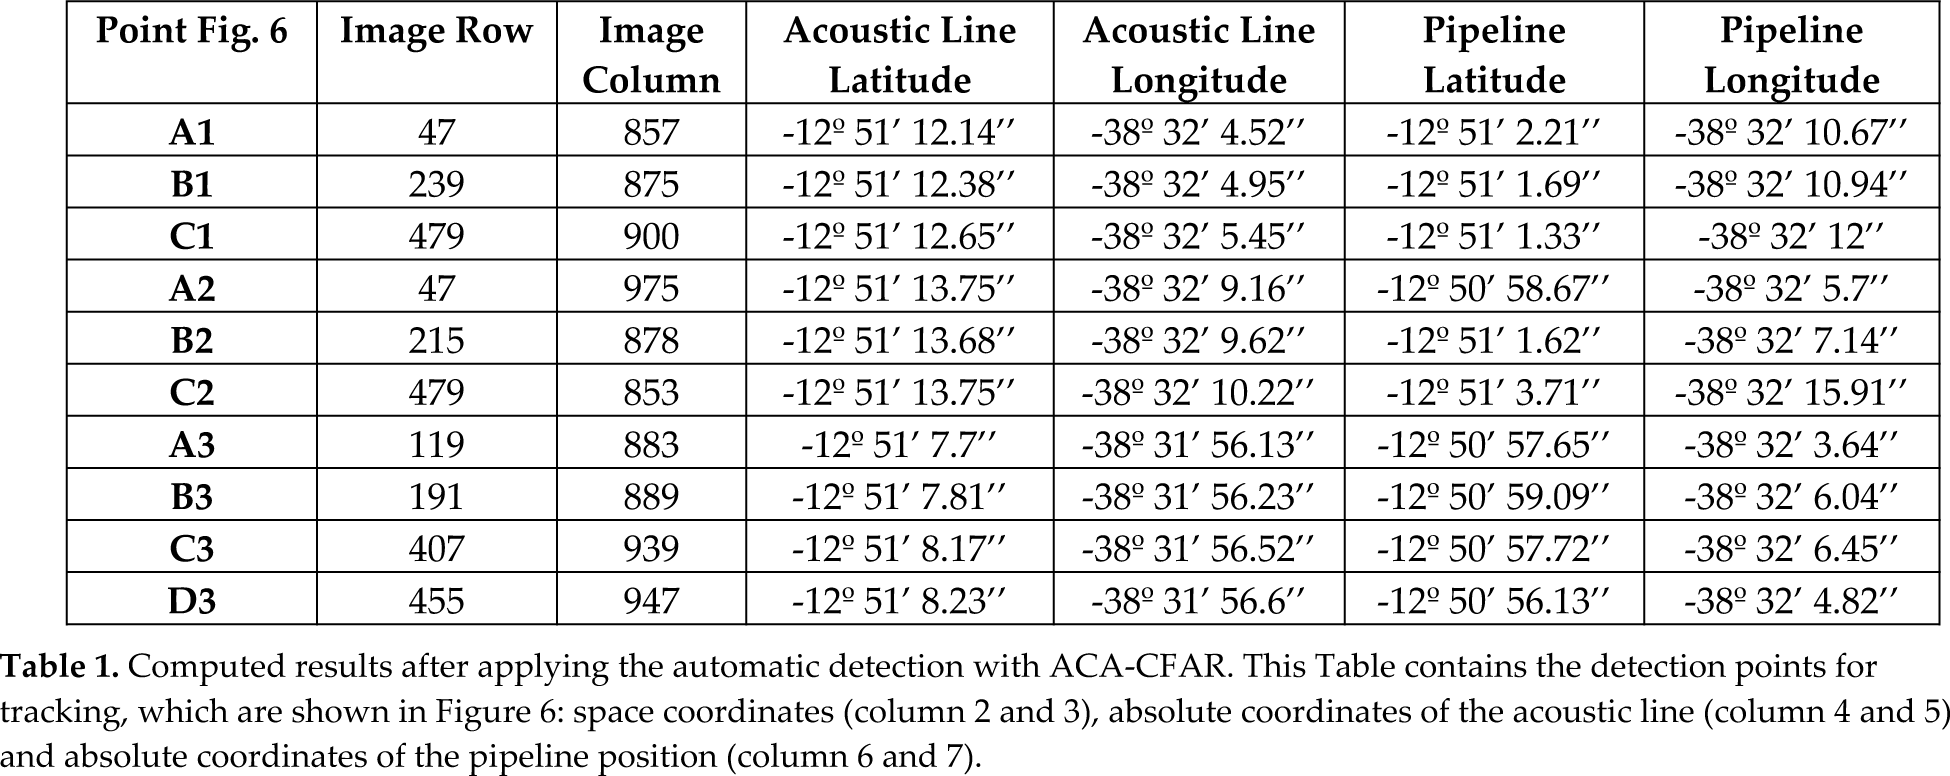
Figure 6 shows three examples of original SSS images in (a) the output after applying this automatic detection in (b) and the final result after making the correlation of adjacent lines in (c). These images have been cropped for better presentation. In each case, the pipeline can be found on the right side of the SSS. In Figure 6.1, a straight and well-defined pipeline can be observed. In Figure 6.2, the pipeline is slightly curved and a lot of sediment has accumulated on top of the image, which may have produced false detections. Figure 6.3 exhibits an intermittent buried pipeline. In Figure (c), a red circle denotes detection points for tracking, obtained by the algorithm. Details about these detection points are also given in Table 1. As can be seen, the result of this automatic detection consists of spatial coordinates (row and column), as well as the absolute latitude and longitude of the acoustic line, then the pipeline position (point detection for tracking).
Experimental results for ACA-CACFAR: (a) the original pre-processed image; (b) the detected pipeline; (c) the detection points for tracking from Table 1
Computed results after applying the automatic detection with ACA-CFAR. This Table contains the detection points for tracking, which are shown in Figure 6: space coordinates (column 2 and 3), absolute coordinates of the acoustic line (column 4 and 5) and absolute coordinates of the pipeline position (column 6 and 7).
5.2 Quantitative comparison of algorithm efficiencies
The quantitative measures selected for comparing the different algorithms are the amount of CPU instructions and the execution time in seconds. They are very descriptive for determining an efficient performance for an on-line automatic target detector and tracker.
Eq. (17) is a performance index representing the number of instructions employed for the standard CA-CFAR algorithm, where (Sw) and (Sa) represent the amount of acoustic lines or swath and the amount of acquired samples, respectively. Also, (N) and (G) represent the number of reference cells and the number of guard cells.

Equations (18) and (19) show, respectively, the computation of the number of algorithm instructions for partial sums CA-CFAR presented in [28] and the ACA-CFAR introduced in this work:


Note that the performance index of equation (19) is constant for the same image, depending only on the amount of samples (Sa).
5.3 Comparisons
Table 2 shows the settings for the automatic detection process with CA-CFAR, PSCA-CFAR and ACA-CFAR. These all present similar detection results. However, the performance difference regarding the amount of CPU instructions is remarkable.
Data and results of the automatic detection technique, for images of 500×1000 and 500000 samples. Standard CA-CFAR, partial sums PSCA-CFAR and accumulated ACA-CFAR. N: reference cells. G: guard cells. D: number of detections. I: number of CPU instructions (equations 17, 18 and 19).

Analysing Table 2, it can be seen that the improvement of ACA-CFAR introduced in this work is 98,25% ≈ 98% for the first image when compared with the standard CA-CFAR technique and of 96,77% ≈ 97% when compared with the partial sums CA-CFAR. For the second image, the reference cells amount decreased and the improvement of ACA-CFAR was 98,01% ≈ 98% when compared with the standard CA-CFAR, and about 96,3% ≈ 96% when compared with the partial sums CA-CFAR. Finally, for the third image, the improvement of the ACA-CFAR was 97,85% ≈ 98% in contrast to the standard technique and 96% better when compared with the partial sum CA-CFAR technique.
A graphical comparison of the algorithms' performance is shown in Figure 7. As can be seen, the ACA-CFAR maintained a constant number of instructions even though the number of reference or guard cells varied. In other words, if the number of neighbouring or contextual cells was increased, this novel technique maintained the same number of CPU instructions, depending only on the sample amount. This is a very significant advantage with regards to previous CFAR techniques, the performance of which does depend on the number of reference or guard cells, which slows down their performance.

Comparison of the number of CPU instructions for the three CA-CFAR approaches and for images of 500times1000 and 500000 samples. S: standard CA-CFAR, SP: partial sums CA-CFAR; A: ACA-CFAR. C: number cells. I: number of CPU instructions (equations 17, 18 and 19).
The ACA-CFAR algorithmic complexity was 0(Sw *Sa). Therefore, for a square acoustic image, its complexity was quadratic with value 0(N2) where the number of samples was N2.
6. Conclusions
The main contribution of the work presented here is the proposal of a novel automatic acoustic image processing technique. It was experimentally tested for pipeline detection using acoustic data obtained with a SSS in Salvador da Bahia, Brazil. The image processing technique called cell average constant false alarm rate (CA-CFAR) was borrowed from the radar domain and was strongly improved by changes in the computing algorithm for on-line processing and detection. The accumulated CA-CFAR, or ACA-CFAR for short, gives the same detection results of CA-CFAR, with a significant decrease in the computational effort and time.
This preliminary comparison study was conducted to select the best approach for programming the on-board perception system of the AUV prototype ICTIOBOT. This perception system will be applied to the off-shore industry devoted to pipeline tracking by using images with a higher resolution. These results also showed that it was a good idea to migrate concepts from radar to sonar. The efficient CACFAR image processing technique is a good choice for obtaining on-line and efficient performances also in the acoustic domain.
These features are essential for perception feedback in the dynamic mission planner, the guidance and the control and navigation systems of the aforementioned AUV prototype.
Footnotes
7. Acknowledgements
This work was carried out thanks to financing from the following projects: DPI2009-11298, MICINN from Spain, CONICET – PIP 11420090100238 and ANPCyT – PICT-2009-0142 from Argentina. Author Sebastian Villar would like to acknowledge the IEEE/OES Student Scholarships, which he was awarded for his postgraduate studies.
1
The square brackets are used to indicate that m and n are discrete.