
Abstract
We investigate the optical properties of Li-doped Si nanocrystals (both freestanding and matrix-embedded), which are potentially an important material for the new generation of lithium-ion batteries. Our samples contain 10 – 100 Li atoms per one Si nanocrystal and their lattice is slightly expanded. The photoluminescence (PL) spectra of the S-band of Li-doped Si nanocrystals are blue-shifted by ∼30nm compared to the undoped Si nanocrystals and their PL lifetime is correspondingly shorter. The F-band emission is almost unaffected by Li doping. The observed changes in the PL performance are probably caused by Si lattice expansion induced by Li insertion. The reported spectral blue shift is favourable for certain photonic applications.
1. Introduction
Si nanocrystals (SiNCs) are a widely investigated nanomaterial because their optical and mechanical properties are different from bulk Si and, in many cases, more favourable for various applications [1–3]. Bulk Si – the predominant material in electronics – has an indirect band gap and consequently exhibits a very inefficient luminescence. Therefore, light sources for optoelectronics, such as light-emitting diodes (LEDs) or lasers, cannot be directly produced from bulk Si and the applications of Si cannot be easily extended from electronics to optoelectronics and photonics. Contrary to bulk Si, SiNCs with sizes of several nanometres exhibit visible photoluminescence at room temperature [4] and therefore are a prospective material for optoelectronic light-emitting devices [1, 3]. Some developments of Si LEDs have already been accomplished [5–8], however, a genuine Si-based laser integrated on an optoelectronic chip is still not available. For the development of a Si-based laser a photoluminescence (PL) spectrum at shorter wavelengths is desirable because it reduces free carrier absorption that is one of the most significant competing mechanisms acting against optical gain in SiNCs [9].
Considering the mechanical performance of bulk Si and its nanostructured variety, nanoscale materials can withstand larger strain than bulk Si. Bulk Si has a large theoretical charge capacity (4200mAh g−1) [10], which makes it a very attractive anode material for Li-ion batteries. However, when Li ions are inserted into the Si lattice during the charging process, they cause a large volume increase in the Si lattice [11, 12]. Bulk Si cannot withstand these volume changes and consequently pulverizes, resulting in a loss of contact and capacity fading [11]. Si nanostructures, on the other hand, have a larger surface area that allows them to accommodate larger strain when doped with Li and they can withstand more repeated charging/discharging cycles [12–14]. Therefore, they are being investigated as a prospective material for Li-ion batteries and their mechanical properties have been widely studied [12, 14]. However, the optical properties of Li-doped Si nanostructures remain largely unexplored.
In this work we investigate the optical properties of Li-doped SiNCs [15] in order to get a better understanding of this new material for Li-ion batteries and also to shed light on the possibility of modifying SiNC PL spectra by Li doping for applications in photonics. We present results for both freestanding and matrix-embedded SiNCs. Results from Li-doped freestanding SiNCs have been published in our previous work [15]. Here we briefly recapitulate these results in order to set the scene for this paper and we compare them with matrix-embedded SiNCs. In this work we address both the PL emissions of the S-band and F-band of the SiNC PL spectra [16]. The S-band is the main “slow” PL band in a wavelength range of 550 – 800nm [16]. It originates in Δ1 → Γ indirect electron-hole radiative transition (Δ1 is the conduction band minimum in the Δ-direction) and decays on a microsecond time-scale. The F-band is the less intense “fast” PL band at a wavelength range of 400 – 500nm [16] that decays on a nanosecond time-scale. Its origin is not clear; it may originate in direct Γ → Γ transitions in SiNCs or possibly in some defects.
We report that after doping with Li the S-band shifts to higher photon energies and the PL decay rate increases. This spectral blue shift is present in several samples with different SiNC sizes, both in freestanding SiNCs and in SiNCs embedded in an SiO2 matrix. The origin of the observed S-band blue shift is attributed mainly to the tensile strain in the Si crystal lattice caused by doping with Li, which is in accordance with the Δ1 → Γ indirect electron-hole radiative recombination. We observe that, upon lithiation, the F-band spectral shift is almost negligible, which is in contrast to what we would expect from a direct Γ → Γ transition after applying tensile strain. Therefore, we believe that in the particular samples investigated in this work, the origin of the F-band does not lay in the direct transition at the Γ-point. Rather, the F-band can contain contributions from the matrix and possibly from certain defects.
Because the spectral blue shift is beneficial for achieving optical gain in SiNCs, we measured optical losses in our matrix-embedded samples to assess their potential for achieving gain. Our measurements showed that losses are larger in Li-doped SiNCs than in undoped samples. This observation can be attributed to the different way in which Li-doped SiNCs are embedded into the matrix, in which they may form clumps that scatter light.
2. Experiments
2.1 Sample preparation
We investigated two types of SiNC samples – freestanding SiNC samples (labelled “FS”) with an etched SiNC layer on a Si substrate and matrix-embedded SiNC samples (labelled “ME”) containing SiNCs embedded in an SiO2 matrix.
All samples were prepared starting from porous Si – an ensemble of irregularly interconnected SiNCs in the form of a thin layer on a Si wafer. The freestanding (FS) sample is the porous Si wafer itself; its preparation is described in detail in [15]. The FS sample presented in this work consists of an 3 – 4μm thick SiNC layer containing SiNCs with a mean diameter of around 3nm (corresponding to 700 atoms per nanocrystal). The size distribution of SiNCs in the ensemble has an FWHM of around 1nm [17]. The sample is covered with a natural SiO2 layer.
The insertion of Li into the freestanding SiNC sample was performed electrochemically by a procedure described in [15]. The Li-doped freestanding sample is labelled FS-Li.
In addition to freestanding SiNC samples, more samples (labelled ME and ME-Li) were prepared by embedding SiNCs into a matrix. In this procedure, the SiNC layer containing SiNCs with sizes around 2.5nm (∼400 atoms per nanocrystal) was mechanically removed (scratched with a scalpel) from the substrate to obtain SiNC powder. This was done both for undoped and Li-doped SiNCs. Then, 2mg of the SiNC powder were mixed in a quartz cuvette with 0.4ml of liquid SiO2-based spin-on diffusant (P509, Filmtronics Inc.). The mixture was treated for 30 minutes in an ultrasonic bath to break down larger clumps of SiNCs and then put into a centrifuge for three minutes (2500 revolutions per minute, radius 10cm) to increase the SiNC volume density in the bottom part of the cuvette. After this treatment the mixture was left to solidify for several days. Samples prepared in this way (labelled ME and ME-Li) form an approximately 50μm layer at the bottom of the cuvette with a mean SiNC/SiO2 volume ratio of 15 – 20% [17]. They are well oxide-passivated and have a relatively good optical quality. For reference measurements, a sample without nanocrystals containing only the matrix was also prepared.
2.2 Neutron depth profiling
Determination of the Li concentration in SiNCs is very important, not only for PL studies but also for the broader scientific community. Therefore, we carefully determined the average concentration of Li atoms in SiNCs by neutron depth profiling (NDP) [18].
NDP is a non-destructive, isotopic sensitive nuclear analytical technique. It utilizes strong exoenergetic nuclear reactions of thermal neutrons with certain isotopes of light elements, e.g., in case of Li nuclear reactions: 6Li(nth, α)T with cross section 940 b (natural abundance of 6Li is ∼6%). To perform a NDP analysis, a proper detection system (with high energy and depth resolutions) and a spectrometric chain (preamplifier, amplifier, MCA) are necessary. In our case a Si detector (a windowless Hamamatsu diode) was utilized that has about 15keV energy resolution (for 5.48MeV α particles). The NDP spectrometer (a detection system with target holders fixed in the vacuum chamber and amplifying+MCA electronics) was installed on a neutron guide in the hall of the LVR-15 reactor (CV Řež). At the exit of the neutron guide a highly thermalized and intense neutron beam (107cm−2 s−1, Cd ratio=105) was formed. The NDP analysis was performed using the Li standards with the known content of Li atoms. For both the Li sample and the standard the measurements were done in the identical target-detector geometry. The nominal depth resolution of the NDP analysis was ∼10 – 15nm and the time necessary for the measurement was typically several hours. The Li concentration versus depth distributions were obtained by the PC processing of the T energy spectra using a specially developed evaluation code (the code utilizes the SRIM loss-energy data). The NDP analysis is loaded with a typical 5 – 10% error that originates in (i) the time instability and spatial inhomogeneity of the neutron beam, (ii) possible difference in the detector-target solid angles, (iii) low data statistics for samples with low Li content and (iv) the uncertainties of the Li standards data.
2.3 X-ray diffraction
Li atoms presumably occupy interstitial positions in the Si lattice [19] and cause lattice expansion. Therefore, x-ray diffraction measurements were performed before and after Li doping to determine changes in the lattice parameter of the SiNCs.
The diffraction measurement was performed with a standard high-resolution diffractometer using a Cu Kα line-focus tube (wavelength 1.54 Å) (details are in [15]).
2.4 Time-resolved photoluminescence
Photoluminescence measurements were performed on both Li-doped and undoped SiNC samples [15]. The PL was excited with a third harmonic of an Nd:YAG laser (wavelength 355nm, pulse duration 10ns) and the excitation spot diameter was ∼5mm. For time-resolved measurements of the S-band, the detection gate width was set to 1μs and the gate was shifted in steps of 1μs after the excitation pulse. For measurements of the F-band, the detection gate width was set to 5ns and the gate was moved in steps of 1ns. In this case, the measured PL signal is a convolution of the actual PL decay, the excitation laser pulse (with a duration of 10ns) and the gate width. Therefore, decay constant cannot be exactly evaluated from this measurement. F-band photoluminescence was only measured on matrix-embedded SiNC samples (ME and ME-Li) because for freestanding samples the scattering of laser light was so strong that it prevented PL measurements below ∼480nm. All measurements were performed at room temperature and were corrected for the spectral response of the detection system.
2.5 Measurement of optical losses
In order to investigate SiNCs as a prospective gain material [17], we measured optical losses in our samples to assess their potential as a gain medium. Optical losses of matrix-embedded SiNCs were measured by the shifting excitation spot technique (SES) [20]. In this measurement, a sample is excited by a tiny laser spot and the PL is measured from the sample edge. The distance x of the excitation spot from the sample edge is shifted in steps from zero to typically few millimetres. The detected PL signal follows the Lambert-Beer law:

where I0 is the initial PL intensity and α(λ) is the coefficient of total optical losses (that include absorption and scattering). From this measurement, coefficient α can be directly determined.
Our optical loss measurement was performed using the same apparatus as the time-resolved PL. The excitation laser beam was focused with a cylindrical lens to form a narrow stripe and a small part of this stripe (∼50 × 50μm2) was selected to excite the sample. The excitation spot was then shifted in steps of 50μm using a pair of motorized razor blades and the PL was detected from the sample edge by an optical fibre. The excitation fluence was 16mJ/cm2. This measurement was not time-resolved, the detection gate being 100μs.
3. Results
3.1 Sample characterization
First, mean concentration of Li atoms in the SiNCs was determined by NDP. Figure 1 shows the measured energy spectra of particles emitted from sample FS-Li after the reaction of thermal neutrons with 6Li isotopes inside the Si lattice. Two peaks at channels ∼740 and ∼1000 correspond to α particles and tritons (T), respectively. Both these peaks carry equivalent information about Li concentration inside SiNCs. For the determination of the average Li concentration, peak T was analysed [15]. The mean Li concentration was found to be 10 – 100 Li atoms per one Si nanocrystal. This means that the ratio of Li:Si atoms in our nanocrystals is in the range of 1:70 – 1:4.
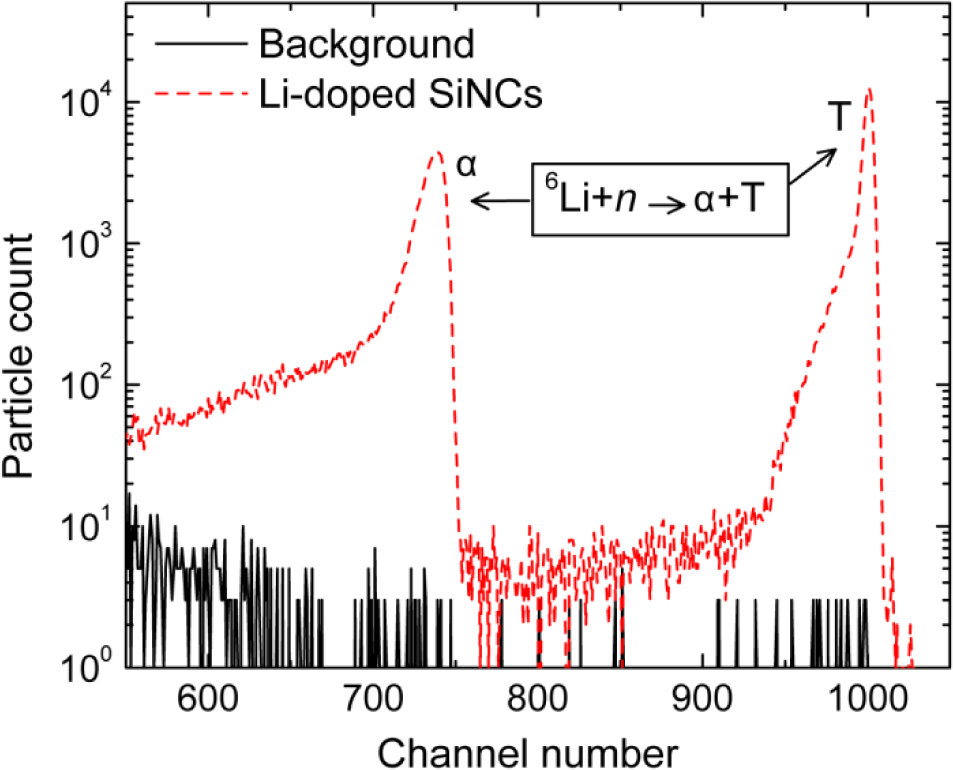
Particle energy spectra from NDP measurement. Red dashed line – spectra from Li-doped SiNCs (sample FS-Li). Black line – background measured from the rear side of the wafer.
After finding the concentration of Li atoms we performed an x-ray diffraction measurement to determine possible changes to the Si crystal lattice after Li doping. Details are given in Ref. [15]. After doping with Li the Si lattice in our samples is expanded by a relative factor of Δa/a ≈ 4.2 × 10⁻⁴ – 1.6 × 10⁻³, which corresponds to a relative volume change of ΔV/V in the range of 1.3 × 10⁻³ – 4.8 × 10⁻³.
3.2 Time-resolved photoluminescence
We performed time-resolved PL measurements in order to optically investigate Li-doped SiNCs. The measured time-resolved PL spectra of the S-band of samples FS and FS-Li are shown in Figure 2. The PL spectrum of sample FS (Figure 2(a)) is centred around 610nm (at zero delay) and decays on a microsecond time scale. After doping with Li (Figure 2(b)) the spectrum is shifted to shorter wavelengths (PL maximum is around 575nm) and PL decay gets slightly faster, nevertheless remaining on a microsecond time scale.

(a, b) Measured PL spectra as a function of time delay between the excitation pulse and the detection gate. Gate width 1μs. (a) Sample FS, (b) sample FS-Li. (c) Measured PL spectra at zero delay with gate width of 1μs. (d) PL decay at wavelengths corresponding to PL maximum in (c). Symbols – measured data, lines – stretched exponential fits.
To better quantify the observed spectral blue shift, Figure 2(c) shows the PL spectra for the FS and FS-Li samples at a delay of 0μs. After doping with Li the PL spectral maximum shifts from 610nm (photon energy 2.03eV) to 575nm (photon energy 2.16eV) and the FWHM spectral width gets slightly narrower: decreasing from 560meV to 540meV.
The PL decay of both doped and undoped samples is on a microsecond time-scale (Figure 2(d)), which is typical for oxidized Si nanocrystals. The measured decay curves were fitted with stretched exponential functions (I(t)=I0exp[−(t/ τ)β]) to quantify changes in the decay time τ and determine parameter β. The decay time τ is reduced from 2.4μs to 2.2μs after Li doping and the parameter β has a value around 0.6.
More PL measurements were performed on matrix-embedded samples (ME and ME-Li). In this case, both the S-band and the F-band could be detected. The measured time-resolved PL spectra with a gate width of 1μs are presented in Figure 3. At zero delay, F-band emission at wavelengths below ∼500nm can be observed. This band decays on a nanosecond time scale and will be addressed in more detail later. The S-band located at 500 – 700nm decays on a microsecond time scale and exhibits the same behaviour as freestanding samples. The PL maximum shifts from 570nm (photon energy 2.18eV) to 540nm (photon energy 2.30eV) at zero delay and the decay time decreases from 5.3μs to 2.2μs (fits are not shown here) after Li doping. This confirms that the observed PL blue shift is due to doping SiNCs with Li and is present in both freestanding and matrix-embedded SiNCs.

Measured PL spectra as a function of time delay between the excitation pulse and the detection gate. Gate width 1μs. (a) Sample ME, (b) sample ME-Li.
After investigating the S-band we address F-band emission of matrix-embedded SiNCs (Figure 4). The fast F-band is spectrally located at around 430nm (photon energy 2.88eV) with almost no spectral shift between the undoped SiNC sample and the Li-doped sample. At zero delay (Figure 4(a)) the spectral maxima of the two samples are essentially the same (∼430nm), only the spectral width gets narrower (FWHM decreases from 840meV to 670meV after Li doping). It is important to note that the matrix without nanocrystals exhibits luminescence at the same spectral region as the SiNCs (blue dotted line in Figure 4(a,b)). This fact complicates interpretation of the measured data, because the relative contribution of the matrix cannot be easily subtracted from the total signal (note, that spectra presented in Figure 4 are normalized and we are not able to measure absolute PL intensities).
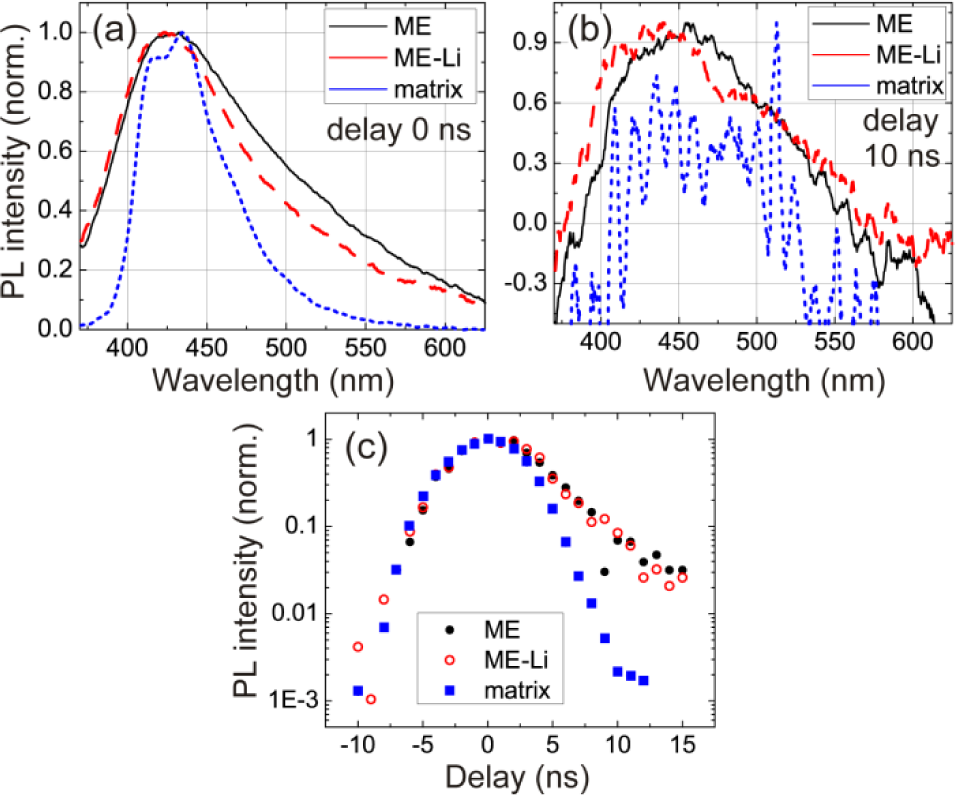
Time-resolved PL measurement (gate width 5ns) of the F-band of samples ME (black solid line), ME-Li (red dashed line) and the reference SiO2 matrix (blue dotted line). (a) Normalized PL spectra at a delay of 0ns, (b) normalized PL spectra at a delay of 10ns, (c) PL intensity at 430nm as a function of time delay.
When the delay of the detection gate is increased to 10ns (Figure 4(b)), the PL maxima of both samples slightly shift to a longer wavelength (to ∼450nm (2.76eV) for sample ME and to ∼440nm (2.82eV) for sample ME-Li). The shift is slightly larger for the undoped sample and therefore a small relative blue shift appears at these time delays after doping. However, unlike the S-band, no unambiguous spectral shift of the F-band due to Li doping was revealed in our experiments. At a time delay of 10ns, the contribution from the matrix to the PL signal is very low, because PL from the matrix decays faster than PL from SiNC samples (Figure 4(c)). The PL decay of the F-band of the SiNCs is on a nanosecond time scale and is practically the same for doped and undoped samples (Figure 4(c)). We cannot analyse it in more detail because of the limited temporal resolution of our system.
3.3 Measurement of optical losses
We measured optical losses in samples ME and ME-Li using the SES technique. The measured PL intensity as a function of the excitation spot position is shown in Figure 5. For short distances from the sample edge (below ∼0.8mm), the PL signal increases and is scattered. This is because at these positions the excitation spot covers the edge of the cuvette and the (rough) edge of the sample. For larger excitation spot positions the signal decreases exponentially. The loss coefficient was determined by fitting measured data using Equation (1). The loss coefficient of the ME sample is α=21cm−1 and for the ME-Li sample is α=40cm−1.

Measured PL intensity as a function of the excitation spot position relative to the sample edge. Gate width 100μs. (a) Sample ME, (b) sample ME-Li. Black symbols – measured data, red lines – exponential decay fits.
4. Discussion
The observed spectral blue shift of the S-band after Li doping could be caused by several factors. First, the SiNC layer is partially damaged during the Li doping process. It is possible that larger nanocrystallites are destroyed during this procedure and the remaining smaller nanocrystals emit light at higher photon energies. This fact is supported by the narrowing of the PL spectral width after Li doping that indicates a narrower size distribution of light-emitting SiNCs. However, damage of larger SiNCs alone cannot explain the whole spectral blue shift, because the spectra are displaced as a whole, not just the long-wavelength part is missing.
The second factor, which probably plays a role, is the tensile strain in the Si lattice caused by Li insertion. It has been shown that strain can modify the electronic structure of semiconductor nanocrystals and consequently their PL spectra [15, 21, 22]. Since we know from our x-ray diffraction measurement that Li-doped SiNCs have an expanded lattice, i.e., tensile strain is present in these nanocrystals, we can expect that the PL spectra will be influenced by this tensile strain. When we take into account the maximal measured volume change in our samples of 4.8 × 10⁻³ and deformation potential of Si to be 10eV [23], we can estimate that the upshift of the conduction band minimum due to the tensile strain is ΔE ≈ 0.05eV [15]. This corresponds to a PL spectral blue shift of 14nm, which is in good agreement with the measured S-band blue shift of 30nm.
The third factor that might be present, is the influence of Li on the passivating surface of SiNCs. It has been shown recently that Li doping can considerably affect the surface layer in Li electrodes for batteries [24]. However, these electrodes have typical sizes of around 50nm with a 2nm thick native oxide layer and our nanocrystals are much smaller (diameters around 3nm) with only one or two oxide monolayers. Therefore, we suppose that this mechanism is of minor importance for our particular samples.
The observed behaviour of the F-band is more difficult to interpret because the origin of the F-band luminescence is not clear and also the matrix contributes to the observed PL signal at this spectral range. The observed red shift of the F-band peak with an increasing time delay can be attributed to thermalization and relaxation of carriers to lower-energy states. If the F-band emission in our samples was related to the direct transition in SiNCs at the Γ-point, the PL peak would be shifted to lower photon energies after tensile strain is applied. However, this is not observed in the experiment. On the contrary, the shift of the F-band is negligible and only at longer delays are the spectra slightly blue shifted when tensile strain is applied. Therefore, we conclude that the F-band emission in our case is probably not related to the direct Γ → Γ transition. The F-band emission can originate in defects and in the matrix.
Finally, the optical losses in Li-doped SiNCs embedded in an SiO2 matrix are larger than in the pure (not-doped) matrix-embedded SiNCs. The Li atoms in SiNCs can affect the way the SiNCs are embedded in the matrix and the quality of surface passivation. Also, the presence of Li may affect the formation of clumps of nanocrystals that act as scattering centres. Therefore, the scattering losses are increased in the Li-doped sample.
5. Conclusions
We investigated Li-doped SiNCs that are a relevant material for Li-ion batteries. Our electrochemically prepared Li-doped SiNC samples contain 10 – 100 Li atoms per one nanocrystal and tensile strain is present in them as a consequence of Li doping. The relative volume change of the lattice is in the range of 1.3×10⁻³ – 4.8×10⁻³. We showed that PL properties of Si nanocrystals are modified after doping with Li. The S-band is shifted to shorter wavelengths by about 30nm and the PL decay is correspondingly faster (decay times are reduced by several microseconds). The observed changes in the PL performance are caused (at least partially) by tensile strain of the Si lattice induced by Li insertion. The F-band emission of SiNCs was found to be essentially not shifted after applying tensile strain. Therefore, we conclude, that this band can hardly be related to the direct transition at the Γ-point, at least in samples used in this work. The optical losses are larger in Li-doped SiNCs than in undoped SiNCs.
The reported PL blue shift of the S-band is beneficial for some optoelectronic applications. For example, light emission at higher photon energies implies a reduction of free carrier absorption and therefore can help to achieve optical gain in Si nanocrystals. However, embedding of Li-doped SiNCs into the matrix needs to be improved to lower the optical losses that have been found to be larger in our doped samples. The F-band emission is much less intense than the S-band emission and therefore seems to be less useful for applications.
Footnotes
6. Acknowledgements
This work benefited from the support of the Czech Science Foundation (Project No. P204/11/0785) and the Excellence Centre (P108/12/G108). NDP measurements were carried out at the CANAM infrastructure of the NPI ASCR Řež.