
Abstract
This paper investigates the impact that human capital, information and communication technology (ICT) and foreign direct investment (FDI) have on GDP. Cross-sectional data from a set of 20 OECD and 24 non-OECD countries in 2007 are analysed employing data envelopment analysis (DEA) and classification and regression tree (CART) techniques. The paper illustrates that the level and quality of access to ICT infrastructures plays an important role in determining a country's level of technical efficiency. The paper also indicates the presence of a catch-up process, led by technological innovation, on the part of emerging countries.
1. Introduction
Numerous empirical papers have investigated the factors that contribute to economic growth determinants. Following the ICT revolution, the literature has taken great interest in the role of information technologies in economic growth. ICT has now become an essential part of the economy and there has been an increasing trend in ICT investments in many countries throughout the world over the last two decades. Many studies show that ICT should be treated as a general purpose technology and that its effect on productivity goes beyond a capital deepening effect [1]. Moreover, ICT is a form of knowledge and network capital, with the ability to improve overall productivity across different sectors of the economy through its effects on organization, management and human capital [2].
The economic literature has paid similar attention to the role of human capital as an economic growth driver. In particular, Barro [3] has noted that economics has long been interested in the importance of skills in the workforce, and that this history helps to explain a number of the issues that are pertinent to the analysis of economic growth today.
Another element influencing GDP, which is strongly linked to the two factors mentioned above, is a country's ability to attract FDI. A paper by Borensztein et al. [4] shows that FDI only contributes to economic growth when a sufficient stock of human capital is available in the host country.
Thus, in the present paper, data from 20 OECD and 24 non-OECD countries are employed to investigate the impact that FDI, ICT and human capital have on GDP. It is organized as follows: Section 2 reviews the literature, and is followed by a discussion of the methodology in Section 3. Section 4 provides a description of the data set, and the results are presented in Section 5. Section 6 concludes.
2. Literature Review
The sources of uneven economic growth began to receive ever more attention from economists from the mid-1980s onwards. Even though the empirical literature has shown that there is no single factor that affects economic growth [5,6], it is widely believed that ICT plays a fundamental role in this process. A paper by Madden and Savage [7], employing data from 27 European countries over the period 1990–1995, shows a positive relationship between economic growth and telecommunications infrastructure investments. In papers by Jorgenson and Vu [8] and Farhadi and Rahmah [9], the positive contribution of ICT to growth is confirmed for most regions of the world, with a significant impact noted in the industrialized economies and the developing Asian economies. However, a paper by Koutroumpis [10] found that it is only when a critical mass of infrastructure is reached that broadband penetration is able to produce a positive impact on GDP. On the other hand, there are studies in the literature which indicate a negative impact of ICT on economic growth in the short run [11,12]. The remaining papers in the literature regarding ICT focus on more specific aspects, such as those relating to its impact on the development of local economies [13–14], or those concerned with its impact on company structure and organization [15–17]. The literature has paid similar attention to the role of human capital in fostering economic growth. In particular, the related literature shows that human capital facilitates the international transfer of technology from innovating countries to ‘imitating’ ones, helping them to ‘catch up’ with developed countries [3,18–19]. From a methodological point of view, a standard approach is to treat human capital - or the average years of schooling of the labour force - as an ordinary input in the production function [20,22–23]. An alternative approach, in line with endogenous growth theory, is to model technological progress as a function of the level of education or human capital. The assumption is that better human capital is better at creating, implementing and adopting new technologies, thereby generating growth [18].
Another controversial issue is the relationship between the growth process and FDI. FDI is considered to be vehicle through which new ideas, advanced techniques, technology and skills are transferred across borders, thereby providing substantial spillover effects [21]. Macroeconomic analysis generally supports a positive connection between FDI and growth [4,25]; a connection which is further reinforced in countries with a well-developed financial market [26].
3. Methodological approach
Most of the empirical literature regarding economic growth is based on the estimation of a production function. However, as Färe et al. [27] point out, this approach is heavily model-driven, requiring strong assumptions about the relevant production technology. In contrast, those methodologies based on non-parametric techniques, such as DEA, require no specification of the functional form, and do not require the neutrality of technological change [21]. Moreover, the statistical properties of DEA are established and inference may be performed using bootstrap methods, as discussed in [28]. In recent years, DEA has been widely employed to analyse productivity and technical efficiency, both at an industry level [30–35] and in order to compare different countries [21,37]. In the latter case, and after having obtained a measure of the technical efficiency of the various countries, the second step is usually to group them in order to identify some common characteristics related to economic growth. In contrast to most of the studies in the literature, which use some a priori criteria such as country income classification to group countries, in this paper we employ the CART non-parametric technique [38–39]. This technique [40–41] first identifies the factor (ICT, FDI or human capital) which most affects each country's technical efficiency and then groups the countries according to the factor identified.
3.1 The DEA phase
The DEA methodology is based on the measurement of the distance function of each decision-making unit (DMU) to the estimated technology frontier [42]. The main shortcoming of the distance function approach is that no assumptions are made about the statistical distribution of the DMUs [43]. Recent studies [28,44] show that the traditional DEA-estimator is biased by its construction, and that it is affected by uncertainty due to sample variation.
To facilitate the interpretation of the results in the following sections, it should be borne in mind that in the input-orientated DEA model, and under the hypothesis of constant returns to scale (CRS), an efficiency score is calculated for each DMU i (i=1,2,…n) by solving the following linear program:

This equation includes the Farrel [45],


In the empirical literature relating to economic growth, one of the main debates concerns the utilization of human capital as an input in the production function [20]. In fact, for the so-called ‘endogenous growth approach’, human capital should not be directly embodied in the production function [48]. In what follows, we use a data-driven approach to test whether human capital should be considered as an input in formulation (1). In particular, we compute two DEA models. In the first model (m1), human capital is not included among the inputs, while in the second (m2) human capital is included. The Maasoumi and Racine test [49] is then employed to determine whether human capital produces differences in the efficiency scores. The test is based on non-parametric entropy, which is defined by:
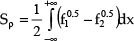
The null hypothesis states that the two densities can be considered equal: Sρ=0. The significance level associated with the Sρ statistic is obtained with the bootstrap resampling technique.
3.2 The CART phase
In the second phase, we use CART in which the dependent variable is productivity and the explanatory variables are ICT, FDI and human capital.
The result of CART is a tree consisting of a root node that includes all the observations, some parent nodes which may be split further and, at the end of the tree, some terminal nodes (leaves) that are characterized by a predicted average value of the dependent variable [50].
4. Data and variables
4.1 The DEA variables
The sample used to estimate the frontier of the production function in 2007 consists of 24 OECD countries and 20 non-OECD countries. In line with the relevant literature [21], we consider the following variables. The output is GDP (Y), while the inputs are: labour (L), capital stock (K) and human capital (HK).
The GDP values are taken from the database of the World Development Indicators [51]. The data regarding labour are taken from the International Labour Organization [52]. The capital stock is obtained by applying the perpetual inventory method to the investments series obtained from the Penn World Table [53]. We start with the standard capital accumulation equation:


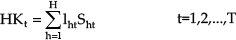
The human capital at time t is measured using the following relationship [58–59]:
4.2 The CART variables
In the second phase, we analyse the impact of FDI, ICT and human capital on the technical efficiency of a country by applying the CART methodology. In the present study, FDIs are measured by the net capital inflows as a percentage of the GDP; the data are directly obtained from [51]. The level of ICT development for each country is measured by the ICT Development Index (IDI) [61]. IDI is a composite index made up of three sub-indices:
An access sub-index (idiaccess): this captures ICT readiness and includes five infrastructure and access indicators (fixed telephony, mobile telephony, international Internet bandwidth, households with computers and households with Internet). A use sub-index (idiuse): this captures ICT intensity and includes three ICT intensity and usage indicators (Internet users, fixed broadband and mobile broadband). A skills sub-index (idiskill): this captures ICT capability or skills as indispensable input indicators and includes three proxy indicators (adult literacy and gross secondary and tertiary enrolment).
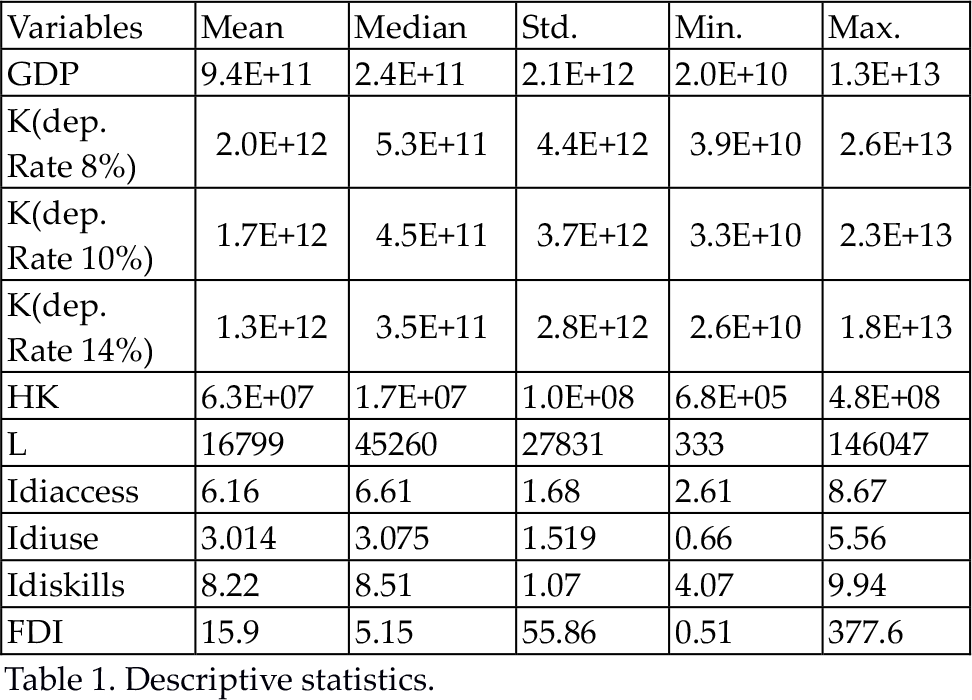
The descriptive statistics for all the variables employed in the analysis are presented in Table 1.
Descriptive statistics.
5. Empirical results
5.1 The DEA results
As discussed in section 2.1, in the DEA phase we consider two DEA specifications: model m1 and model m2. The two models only differ with regard to the input of human capital.
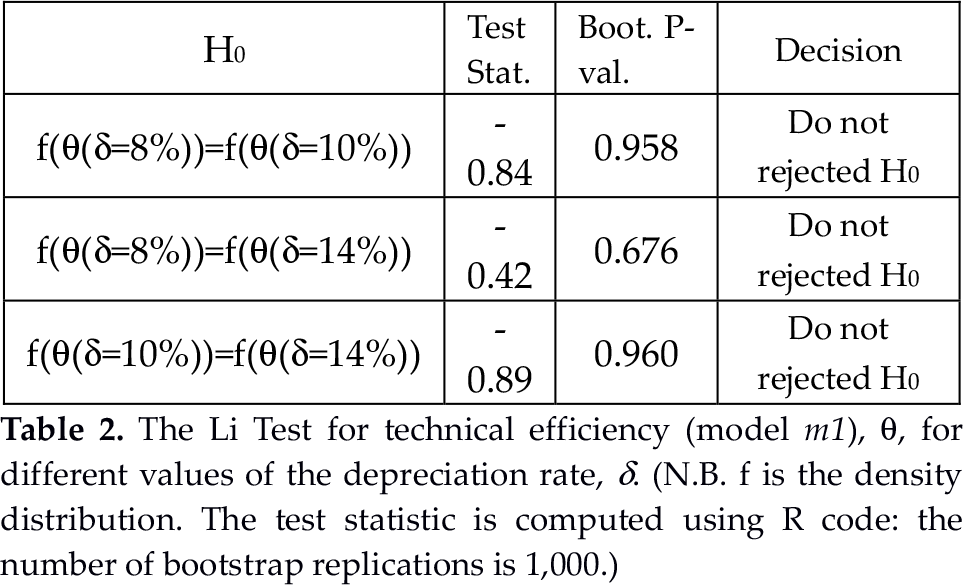
However, before comparing the two models we test whether the different values of the depreciation rate produce relevant modifications to the distribution of technical efficiency. With regard to model m1, the result of Li's test (Table 2) suggests that distributions do not change significantly, regardless of the depreciation rate considered.1
The Li Test for technical efficiency (model m1), θ, for different values of the depreciation rate, δ. (N.B. f is the density distribution. The test statistic is computed using R code: the number of bootstrap replications is 1,000.)
Consequently, we apply a 10% depreciation rate on the capital stock for both DEA specifications. In Table 3, the technical efficiencies and the bias-corrected technical efficiencies are reported for models m1 and m2.
Technical efficiency values (TE) and bias-corrected technical efficiency values (TEb) for DEA models m1 and m2. Y=OECD country classification by income (HI=High Income, HO=High OECD, UMI=Upper-middle Income, LMI=Lower-middle Income). See Appendix A for the country codes.

Upon observation of Table 3, one can note the importance of employing the bootstrap procedure to obtain a more consistent estimation of the true DEA technical efficiencies. Moreover, the comparison of the descriptive statistics at the foot of the table suggests that the introduction of human capital produces marginal effects on technical efficiency. This is confirmed statistically through the analysis of the distributions of the two DEA models (Figure 1) and through the results of Maasoumi and Racine's test [37] (Table 4).

Distribution of the technical efficiencies, m1 (dotted red line) and m2 (continuous black line).
Maasoumi and Racine's test (N.B. f is the density distribution. The test statistic is computed using R code: the number of bootstrap replications is 1,000)

The above empirical evidence confirms the hypothesis postulated by [36] as to the role of human capital: human capital is not a productive factor but it is a key determinant in the capacity of a nation to innovate new technologies suited to domestic production. Accordingly, in what follows, the technical efficiency values of model m1 are considered and the stock of human capital is included in the CART analysis among the explicative variables. It is interesting to observe that by simplifying the grouping of countries using the OECD income classification, no conclusions can be drawn regarding factors that might affect technical efficiency. In fact, the average values of the technical efficiencies are quite similar (see model m1) among that group of countries: namely, 0.76, 0.79 and 0.75 for HI, HO and UMI countries. Therefore, in what follows we employ CART in order to identify those countries that may be grouped by a common factor affecting their technical efficiencies.
5.2 The CART results
In the second stage, the CART methodology is employed to identify the factor that is most important in influencing the technical efficiency of a country, whether idiaccess, idiuse, idiskills, FDI or human capital. The results are shown in Figure 2 and Table 5.

CART tree.
CART groups by idiaccess and the estimated values of bias-corrected technical efficiency (TEb).
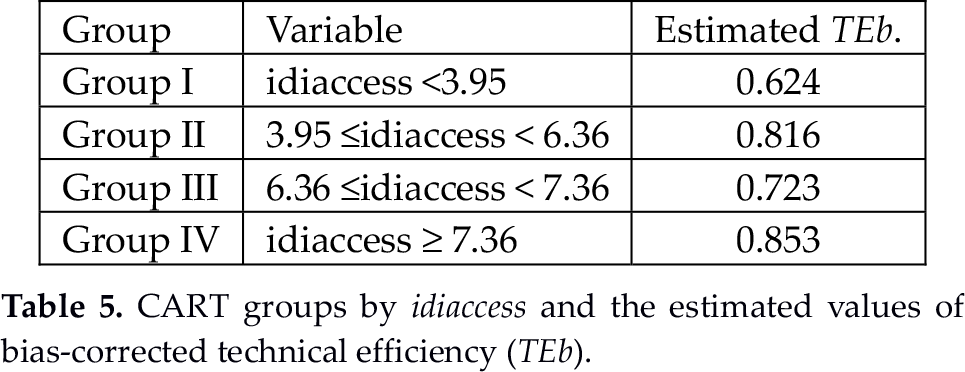
The results of Figure 2 and Table 5 suggest that countries with a high level of idiaccess (≥7.36) achieve the highest values of technical efficiency. In contrast, countries with an idiaccess of less than 3.95 seem to be less efficient with respect to other sample countries.
In Table 6, our sample of 44 countries has been grouped in relation to the idiaccess variable into four groups, in accordance with the results of the CART analysis.
Countries grouped by idiaccess (idia); Y=OECD country classification by income (HI=High Income, HO=High OECD, UMI=Upper-middle Income, LMI=Lower-middle Income); TEb=bias-corrected technical efficiencies; idiu=idiuse; idis=idiskill. See appendix A for the country codes.
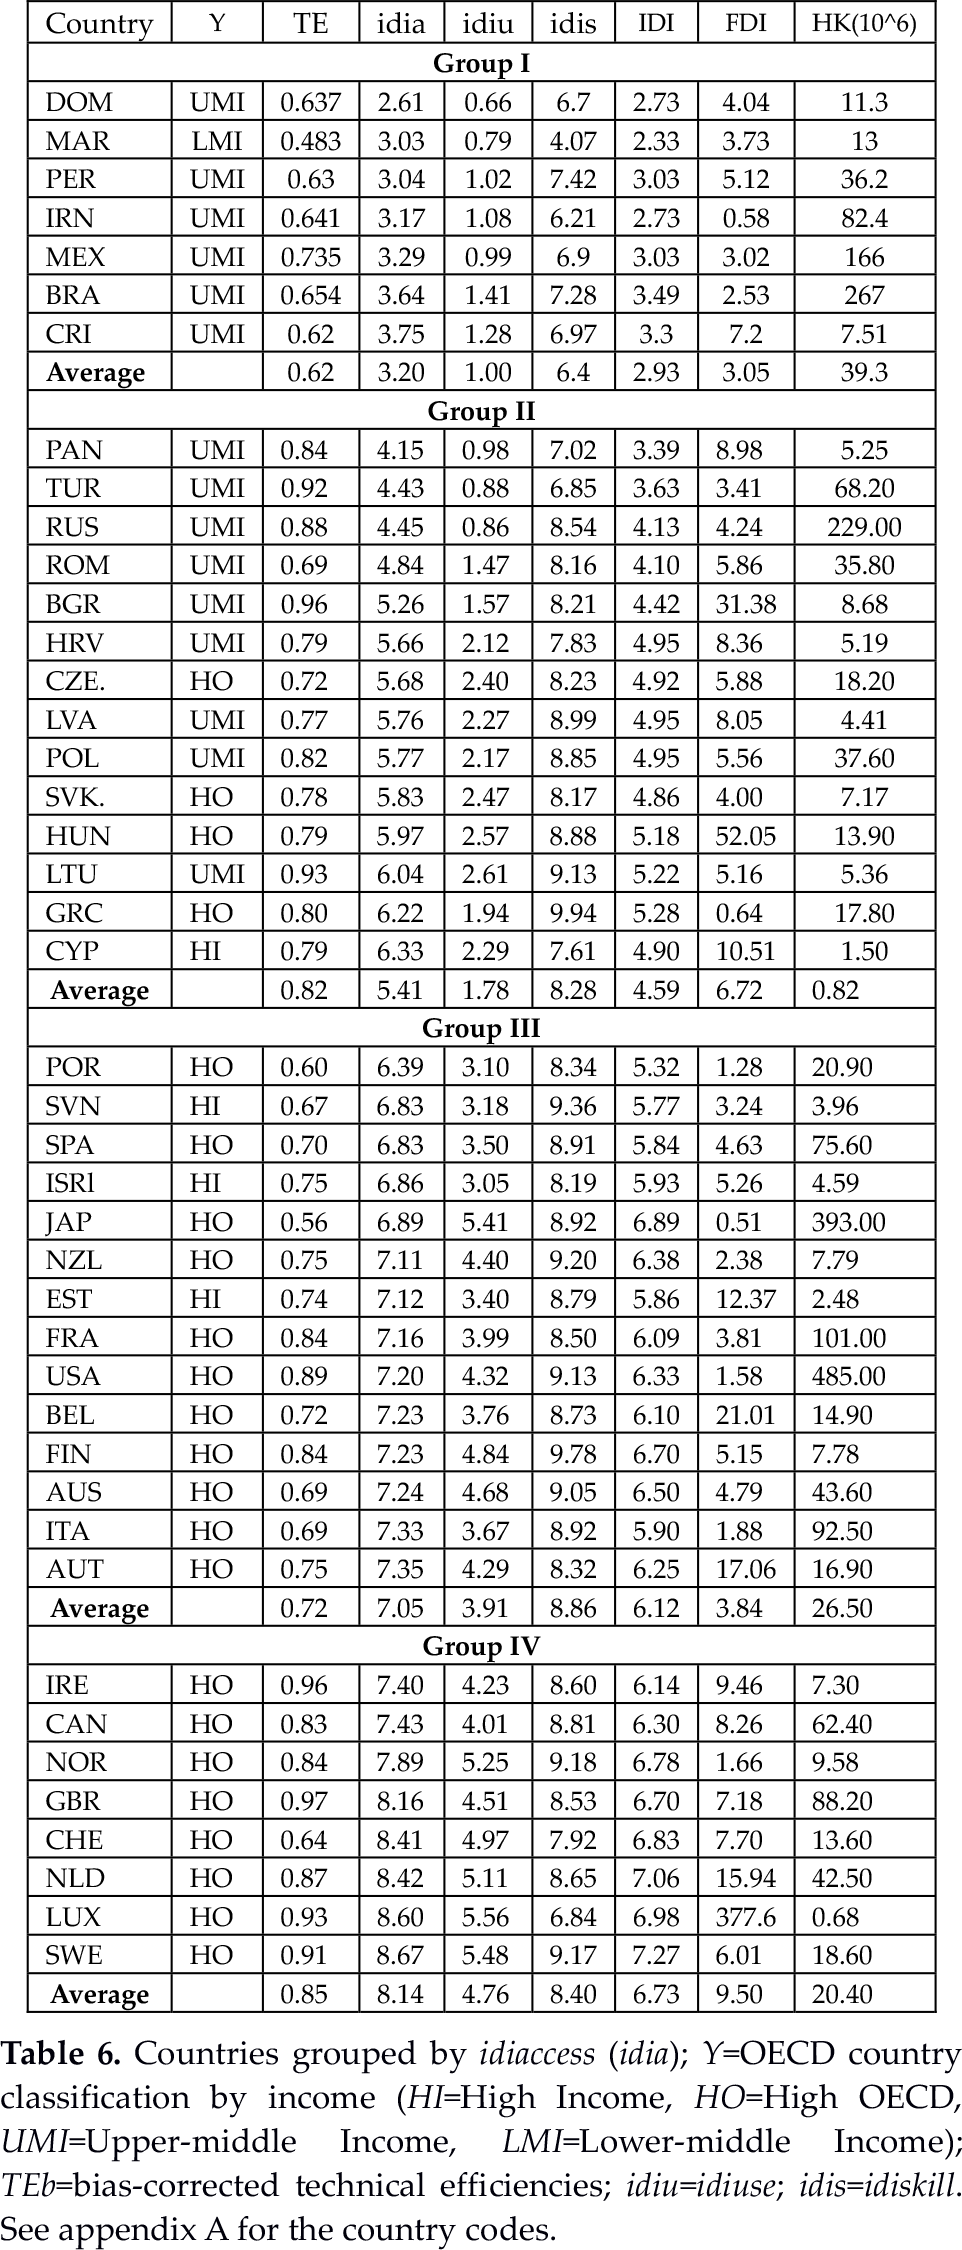
A description of each group from Table 6 is given below.
6. Conclusion and implications
This paper uses the non-parametric DEA technique and CART methodology to examine the main factors debated in the literature about economic growth in order to determine which of these most affect the technical efficiency of countries. The analysis is based on cross-sectional data from 20 OECD and 24 non-OECD countries in 2007. Clearly the cross-sectional nature of the data limits the results of the present study to the spatial aspects of growth, leaving open questions about the impact that such factors have on the growth dynamic. The non-parametric analysis shows that the stock of human capital should not be directly included in the production function, although it may be considered a factor that indirectly influences the ability of a country to exploit innovation.
The CART methodology indicates that idiaccess is the most important variable affecting the technical efficiency of a country, as compared to human capital, FDI and the two remaining components of the IDI (idiuse and idiskills). This result confirms the perceived wisdom of the decision on the part of many industrialized countries to include ‘universal’ access to ICT at little or no cost in their ‘information age’ policy agenda as a mandatory step towards the stimulation of growth. Moreover, the empirical findings indicate a leapfrogging phenomenon in the technical efficiency of emerging countries that choose to adopt the latest technological innovations mostly based on wireless technology.
Another factor that positively affects technical efficiency is FDI. Countries that adopt policies aimed at stimulating foreign investments are able to reduce their technological gap.
Nowadays, since access to ICT and its development are seen as paramount to economic development and efficiency [62], countries must examine how best to ensure ICT access for businesses and households. To do so effectively and efficiently, governments should establish appropriate policies and programmes aimed at strengthening and extending the ICT infrastructure so as to diffuse ICT more widely and, consequently, improve technical efficiency.
With regard to future research, this study raises the question as to which regulatory policies [63–65] emerging countries should implement to facilitate access to ICT infrastructures.
Footnotes
Appendix A
The authors would like to thank the anonymous referees for their helpful comments. The usual disclaimer applies.