
Abstract
The suggestions system is a part of total quality management to create individual and group spirit of partnership between staff and increase efficiency in the organization. Also, diagnosis and improvement process is one of the steps of the chain in the processes of suggestions system. In this study, an approach has been proposed to evaluate efficiency of organizations in performing suggestions system with these aims: (1) Reviewing all the elements in the successful implementation of the suggestions system and (2) providing an effective scientific approach to evaluate the organizations on implementing this system considering the uncertainty in the data. Methodology used in this study included the following techniques: (1) Factor analyzing to clarify the internal correlation between significant criteria and detect the major criteria and (2) using robust data envelopment analysis (RDEA) model to evaluate efficiency of organizations in performing suggestions system. The method is based on 3 inputs and 17 outputs in which some outputs are uncertain scores in form of intervals with uncertain bounds. This model has been solved for different Γs, and a value of weights and rankings for each Decision Making Unit (DMU) has been saved by using the obtained values. In the following a simulation has been used to compute the conformity of the rankings from the RDEA model with reality. Doing so shows that the maximum conformity occurs Γ = 6. Therefore, we can conclude that specific values of Γ can maximize conformity and thus more authentic final rankings for the DMUs in this interval of Γ may be expected.
Introduction
The suggestions review and acceptance system is a part of total quality management to create individual and group spirit of partnership between staff, improve processes, and increase efficiency in the organization. Fairbank and Williams introduced suggestions system as a common solution for exploitation from creativity of staffs.
1
Pluskowski introduced creativity as one of the major capabilities of the man, yet it cannot oblige people to propose ideas in a civilized society.
2
They have to be volunteer to propose their ideas. According to the study of Van Dijkand Van Den Ende,
3
suggestions system includes the administrative arrangements and essential infrastructures to collect, judge, and pay reward for the ideas that are proposed by the staffs.
4
Indeed, performing suggestions system is an educational and promotional movement to improve the activities of organization through aligning the individual aims with organizational aims and increase organizational belonging, commitment, and motivation to all the affairs of the organization.
5
With regard to the point of view of Marksberry et al., the suggestions system is assumed as a way to improve participation by members of organization to help resolving the problems that are not resolved through traditional organizational methods especially at the government sector and constant changes in managements.
6
In this system, material rewards are considered for staffs’ thoughts and notions and their participation in decision-making of organization. Observing the principle of continuous monitoring of processes and results, monitoring problems and defects and taking action to solve them, and modifying or redesigning process are considered as requirements for continuous organizational improvements in total quality management. Inspired by European Foundation Quality Management, assessment pattern of suggestions system and assessment checklist of this system have been designed and performed; this model refers to a nonprescriptive framework formed based on eight-dimensional criteria. Some of these criteria develop enabler group and indicate the type of activities of organization and how to accomplish those activities and the residual part of the results, specifying the demands that the organization must achieve by the performing enablers. It seems that success in improvement of suggestions system and achievement of their aims require reviewing these criteria and resolving their defects well suited to the coordinates of aforementioned pattern as well as their generalization in all levels involved in suggestions system. The reasons for lack of success in performing suggestions system in some organizations include lack of belief in participation among staffs, lack of belief by directory of the organization in the significance of participation by staffs in affairs administration of the organization, authoritarian spirit in managers, inadequacy of mechanisms and incentive policies, and superficial look into suggestions systems. The proper assessment of performance of suggestions system based on a scientific principle and method and the suggestion for suitable mechanisms in this context can be a step to resolve some of the deficiencies mentioned above. Performance evaluation of the suggestions system in the current approach has three fundamental problems: Selecting criteria and their weights is based on unscientific views. Assessments are based on multi-criteria decision-making which cannot be ensured. Integrating of assessments is based on unscientific views.
The present research intends to propose an approach to assess the performance of suggestions system, using robust data envelopment analysis (RDEA), such that some of the reasons for lack of success of this system which are related to improper assessment are clarified. This research has been conducted in five sections; the first section examines the literature review and related works on models for assessment of suggestions system, the use of analytic hierarchy process and data envelopment analysis (DEA), and a variety of approaches proposed in exposure with uncertain data. In the second section discusses the research methodology. In this section, the criteria have been screened by considering experts’ and specialists’ views and then the criteria known for enabler criteria are summarized in 17 cases in three groups using exploratory factor analysis. In this section, RDEA has been introduced as an approach for exposure to the problem of data uncertainty, and how to use this method to assess the performance of suggestions system of 60 organizations has been examined. In the third section, the proposed model is introduced and its performance is examined; in the fourth section, the results from the use of RDEA method have been proposed to assess 60 organizations under discussion in this research; ultimately in the last section, we sum up our conclusions, and the findings of research are proposed.
Literature review
The term “assessment” has been defined in various forms in literature review and theoretical background. Nelly et al. has defined performance measurement as the process of quantification of efficiency and effectiveness of activities. 7 According to the definition by Simons, performance assessment system has been defined with four major aims including transfer of information, focus on official affairs and procedures, design for use of managers, and supervision of maintenance or modification of organizational activity patterns. 8 According to another definition, performance assessment is defined as a systematic process that plans and organizes the tasks and expectations, monitors the performance constantly, creates the implementation capacity, ranks performance periodically, and grants reward to suitable performance. 9 To date, numerous studies have been conducted in the context of design of performance assessment systems. Some have been in the context of basic research, resulting in proposal of various performance assessment systems. These performance assessment models include Sink and Tuttle model (1989), performance matrix (1989), the model of results and determinants (1991), the performance pyramid (1991), balanced scorecard (1992), stakeholder analysis (2001), and the business excellence model. 10 Performance assessment of suggestions system has been regarded as an issue with wide literature review. These studies have been conducted via various techniques and approaches, attempted to introduce a pattern for performance assessment of this system. In one study, Ehsan Jaffarpour et al. proposed a framework using Data Envelopment Analysis (DEA) to assess the performance of this system. 11 In another study, Mohammad Hadi et al. proposed a Context, Input, Process, and Product Evaluation Model (CIPP) model for this purpose. This study has been designed and performed to assess the performance of this system in Medical Science University of Isfahan. 12 One of the methods to allocate weight to input and output criteria was used in an article by Thompson et al. (1997) entitled “Assurance Region” to select the best place for high-energy physics laboratory. Since there were numerous zero values in optimal weight (ur *, vi *) in DEA models, it was indicated that some inputs or outputs are poorer than the rest of the efficient DMUs; thus, this defect in DEA method is resolved through invention of assurance region method. 13 Another method introduced for this purpose is referred to as the “cone ratio envelopment” as suggested by Charles and his colleagues. In another study by Brackets et al. cone ratio envelopment has been used to assess performance of banks under the conditions that uncertain aid grant was considered for risk and similar factors. 14 In 1998, assurance region method was proposed for transfer of capital in Japan in form of a plan. In this plan, the criteria such as distance from Tokyo, access to an international airport, and several other criteria were considered, and that the scores were specified for each place. The assessors considered a weight for each of criteria based on analytic hierarchy process and ultimately obtained an assurance region for each weight through calculating the ratio of weights specified by different assessors. 15 Due to extensive applications of DEA model in the real-world problems based on the studies by Charnes, Cooper and Rhodes, huge efforts have been made to expand DEA models. Encounter with uncertain data has been regarded as an issue drawn into attention by Cooper et al. 16 and Despotis and Smirlis. 17 In ordinary DEA, all the data are assumed as certain numerical values. Yet, the observed values of inputs and outputs in the real-world problems are often uncertain. Uncertain data in assessment and especially in DEA models have been examined in the literature in different forms. The article entitled “Bridge Condition Assessment Using D-Numbers” by Xinyang Deng et al. 18 and the article entitled “A Hybrid Fuzzy Evaluation Method for Curtain Grouting Efficiency Assessment Based on an AHP Method Extended by D Numbers” by Guichao Fan et al. 19 are some of these studies. In the former, a hierarchical model has been established for the assessment and then aggregates the assessment results on different factors to obtain an overall assessment for a bridge. During this assessment process, due to lack of precise instrument and the limitation of cost, the assessment result of each factor has been given by bridge monitor through the visual observation according to Deng’s previous experience. Xinyang Deng has extended the Dempster–Shafer theory using D numbers. Deng’s method was simpler and more effective than the Dempster–Shafer’s method. 18 The second article proposed a hybrid fuzzy evaluation method for curtain grouting efficiency assessment based on a fuzzy comprehensive evaluation method and a D-Number Analytical Hierarchical Analysis (D-AHP) method. The weights of the indicators have been determined by the D-AHP method. The proposed method by Zhonga was successfully applied in the curtain grouting efficiency assessment of a hydropower project in China. 19 Some researchers have suggested fuzzy DEA and interval DEA (IDEA) in the encounter with uncertain data. In more recent period, uncertain data have been expressed by means of two approaches. IDEA was proposed for the first time by Cooper et al., 16 and fuzzy DEA was proposed for the first time by Sengupta. Cooper et al. 16 have extended an interval approach that allows using a mix of uncertain and certain data by means of transformation of DEA model to an ordinary linear planning form. Assessment of lower and upper limits of Decision Making Unit (DMU) efficiencies has been regarded as one of the problems in interval approach. 16 Despite this problem, some researchers have proposed a variety of interval approaches. 17 In another article, Guo and Tanaka proposed an approach that changes the fuzzy DEA model to a bilevel linear planning model. 20 Soleimani Damaneh et al. 21 indicated that their model cannot be common as a proposed model, having an optimal response under limited conditions. Despite the studies by Guo and Tanaka, used the proposed fuzzy DEA model by Guo and Tanaka and introduced a fuzzy integrative framework to integrate fuzzy values with multiple states. In addition, Guo used the model proposed by Guo and Tanaka in a case study of localization problem of a restaurant in China. 22 Kao and Liu 23 proposed a technique which transforms fuzzy DEA model to a family of certain DEA models by use of this approach. In another research, Azadeh et al. used fuzzy DEA model to specify relative efficiency of existing units in the electricity generation sectors in Iran. In this research, using data in fuzzy form and creating Charnes, Cooper & Rhodes (CCR) fuzzy model, it has been transformed to a model with interval data via a model based on a cut, and the minimum and maximum efficiency is acquired for the aforementioned units. 24 In another research by Shokouhi et al., an approach based on RDEA was proposed in which the input and output parameters are restricted to a point that they must be considered as an indefinite set with additional restrictions based on the worst corresponding response with uncertain set. The proposed RDEA searches maximum efficiency under this assumption that the worst corresponding efficiency has been defined via indefinite set. 25 In another research, Najafi et al. proposed the use of RDEA to assess organizational excellence projects. In this article, creation of integrated model of DEA and organizational excellence model considering uncertainty in data is considered, and the efficiency of decision-making units is assessed in which the organizational excellence model has been implemented. 26
Research methodology
The methodology used in this assessment has been taken from the applied realities of the subject under discussion. Two categories of input and output data are detected in assessment of suggestions system based on the proposed criteria grounded on excellence approach. Then the efficiency of suggestions system is assessed using DEA. Since the assessment criteria have been qualitative and the data pertaining to inputs and outputs related to these criteria have been given interval value, the approaches are examined which engage in DEA with indefinite data. In this research, we deal with a type of interval data that their limits are indefinite considering this point that assessments are made by different assessors, in which a numerical interval is defined for each input or output. This results in use of the approaches that consider data uncertainty in the problem. The current model of performance assessment in suggestions system is based on a simple form of multi-criteria decision-making, in which a score has been determined based on experts’ view for each of the criteria and subcriteria. With regard to the investigations on executive coordinates of suggestions system, it seems that such assessment model has huge problems despite its simplicity. The problems include incomplete and ambiguous evaluation indices, lack of the criteria that ensure alignment between these assessments and ultimate aims of suggestions system, duality of criteria from quantitative and qualitative perspectives, how to score them, and ignorance of difference between organizations in terms of their size, organizational structure, missions, and so forth. The criteria of model and the scores allocated in the current system are as follows (see Table 1).
Criteria and scores related to each of them in the current assessment system.

Since assessment of organizations in the current model is made based on the scores allocated by assessors, conclusion of these views is not without mistake. Allocation of an interval of the values as the score considered for the related criteria might be a logical solution to encounter with this issue. In this state, some input and output data are specified in the form of numerical intervals; since the assessments are made by different assessors, several intervals are acquired for each input or output that must be entered into the assessment model (DEA model). In the first section of this research, all the criteria and subcriteria are listed and categorized, and they are reduced in number regardless of their significance. For this, the criteria related to the enablers are qualitative; the criteria related to the results that are quantitative were examined and summarized via two separate approaches. In both approaches, point of view of the experts, specialists, and practitioners of suggestions system was considered as the basis for decision-making. In this research, the statistical population consists of the practitioners in suggestions system in over 20 organizational complexes in one of the organizations affiliated to National Iranian Gas Company. To examine the criteria in the first group, two stages are pursued. In the first stage, the significance of criteria was put into question via Likert scale in a pooling, and the insignificant factors were omitted. In the second stage, the remaining criteria from the previous stage were categorized in a way that they get close to each other in terms of subject, and the number of criteria in each category ranges from 20 to 50 to pave the way for use of factor analysis.
Factor analysis
Factor analysis refers to the extension of analysis of major components. In these methods, an attempt is made to clarify the internal correlation between criteria via covariance matrix approximation and detect the major criteria. Since the final number of criteria has not been predetermined in this research, exploratory factor analysis has been firstly used and then the obtained results have been examined via confirmatory factor analysis method. To use factor analysis, significance of each of criteria obtained from the first stage was put into question in form of questionnaires. In each questionnaire, the number of participants was considered five times the number of criteria. Each person has specified his view on the significance of criteria as a value ranging from 0 to 100. Values 0, 10, 15, and 20–35 have less significance, values 40, 45, 50, and 55 have average significance, and values 60, 65, and 70–100 have high significance. In this research, software SPSS [version IBM SPSS Statistics 22] has been used for factor analysis, and Cronbach’s α has been used to determine the reliability of responses. The important point lies on the fact that the criteria that have caused reduction in reliability of pooling have been omitted by overview of the responses obtained during different stages. As mentioned above, the section screened from these criteria has been obtained and named in three categories with 23 indices (X 1–X 23), 32 indices (X 1–X 32), and 6 indices (X 1–X 32) after the first stage of research. With regard to the responses from the criteria in the first section and calculation of their reliability via software SPSS after omission of criteria X 5 and X 6, reliability was equal to 0.788, which indicates the average reliability. Therefore, 21 aforementioned criteria were used in the factor analysis. At this stage, 70 persons’ views were asked, that is, three times the number of variables. As a result of this action, univariate statistics including mean, standard deviation and early estimation of the commonalities, eigenvalue of correlation matrix of variables, total percentage of variance described by means of common factors as well as cumulative percentage of variance of factors were obtained. As a result of factor analysis, the aforementioned criteria were categorized in seven categories. Value of Kaiser-Meyer-Olkin (KMO) is greater than 0.7, indicating that the correlation between pair of variables can be determined by means of other variables; thus, the use of factor analysis can be justifiable. Results from Bartlett’s test of sphericity test indicate that there is a significant correlation between variables. At the next stage, the extracted factors were confirmed by some modifications using confirmatory factor analysis. The obtained results based on exploratory and confirmatory analyses for three-dimensional criteria above have been represented in Table 2.
Extraction of enabler factors based on factor analysis method.

EFA: Exploratory Factor Analysis.
Analytic hierarchy process
The criteria related to the results are another important section of the assessment criteria of the units under study drawn into attention with a different approach in this research. This work has been pursued in steps: Prepare a checklist of existing indices to assess suggestions system and analyze it based on empirical findings and experts’ and managers’ views in the organizations and propose views to complete and create analytic hierarchy process. Weight the indices based on their significance in achievement of aims and expected results in recommendation system by asking the selected managers’ and experts’ views in form of analytical hierarchy process and assessment of organization in performing this system.
In the following, the criteria and indices that reflect success in achievement of favorable results are examined and specified in the form of a hierarchical diagram. Using the obtained weighted criteria for each of the 60 decision-making units under study in this research, a score was obtained and used as an output in the DEA.
Data envelopment analysis
DEA refers to a methodology based on a linear planning model to assess relative efficiency of decision-making units with the same inputs and outputs. Two basic DEA models include CCR and Banker, Charnes & Cooper (BCC) with return to fixed and varied scale. To any DMUo, the highest score is allocated to possible efficiency by selecting optimal weights for each of inputs and outputs and considering restrictions of problem. If DMU
o
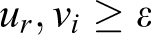
obtained maximum value


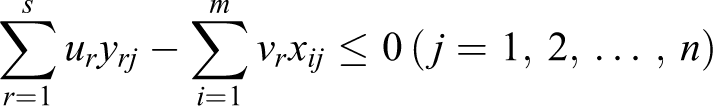

where vi and ur are the input and output weights assigned to the ith input and rth output, respectively, and ε > 0 is a non-Archimedean element smaller than any positive real number. In order to obtain the value of ε, we apply Mehrabian et al.’s 27 model to this article, which is expressed as follows:


where ∊o
is a variable and
Robust formulation for linear planning problems
Consider linear optimization problem as follows:

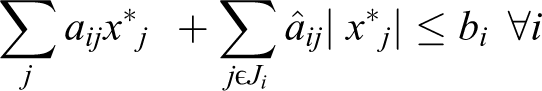
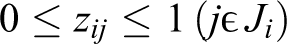
Consider ith row in matrix A and consider Ji as the set of coefficients in ith row which have uncertainty. Any input aij ; j ε Ji is modeled as a random symmetric and bounded variable (ãij ) proposed with [aij − âij, aij + âij ]. Corresponding to each uncertain ãij data, a random variable ηij = (ãij − aij )/âij is defined which follows an unknown distribution and given with the values in interval [−1, 1]. In this regard, the robust formulation will be as follows:

Assuming x* as optimal response in above formulation, there will be yj = |x*j| under optimal conditions, thus
Now, we will show that this response will be possible per each real value ãij of indefinite data
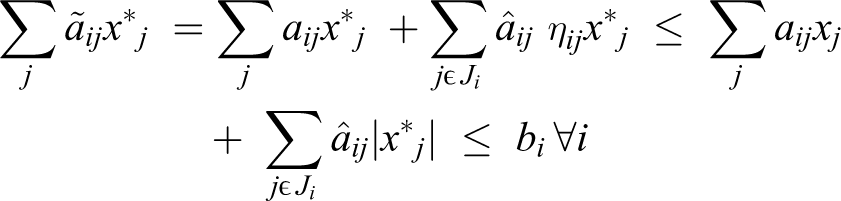
It should be noted that ηij = (ãij − aij )/âij , and thus aij +ηij âij = ãij and ultimately

Therefore

In row above, ηij
equals 0 per js that do not belong to Ji
; thus j ε Ji
has been substituted.
New approach in Bertsimas and Sim model 28
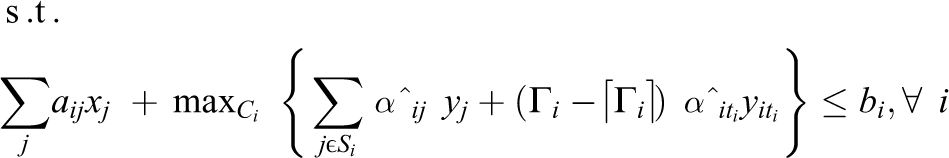
In this model, a robust formulation is proposed which is linear, enabled to resist against uncertain parameters in the model under discussion regardless of a significant effect on objective function. Formulation of Bertsimas and Sim model is as follows:
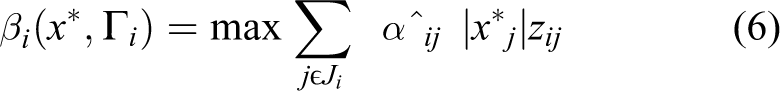
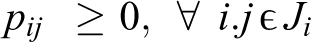
Assume ith restriction of nominal problem as ai ' X ≤ bi . Assume Ji as the set of uncertain coefficients and assume these coefficients (ãij ; j ε Ji ) given with values in [aij − âij , aij + âij ], which have symmetric distribution with mean equal to nominal value (aij ). A parameter (Γ i ) which is not integer is introduced per i which is given a value in [0,|Ji |]. The role of this parameter is to regulate robustness of Bertsimas’s method against conservatism level of response. In other words, it is unlikely intuition that changes all aij as much as possible. We can achieve our aim in the encounter with all the states in which the coefficients change and a coefficient ait changes to the size (Γ i – [Γ i ]), that is, the only subset of the coefficients changes in a way with negative effect on response. In addition, robust response will be likely with high probability for the changes in more than [Γ i ] variable. The result will be formulation of problem below, which is a nonlinear problem

where
If Γ i is selected as integer, ith restriction will be as follows:

When Γ
i
= 0, there will be βi
(x, Γ
i
) = 0, and the restriction will be corresponding to nominal problem. Further, if Γ
i
= |Ji
|, there will be swister’s method. Therefore, there will be the possibility to regulate robustness degree against different levels of conservatism in the response by changing this parameter in interval with the above two values. The below theorem is required to rewrite this model in the form of a linear model.

where

The conservative function related to the ith restriction above is equivalent to the objective function of the linear planning problem below

Now nonlinear model related to Bertsimas’s method can be represented as follows in the form of linear formulation:


By considering the structure of robust formulation, it is clear that [Γ
i
] with coefficients aij
changes per its bounds, and a coefficient with size (Γ
i
– [Γ
i
]) âit
changes; thus, the problem remains unresolved. By proving the theorems below, it can indicate that the robust model is possible with high probability under uncertain data. Parameter Γ
i
regulates the balance between the probability for negation and the result of objective function of nominal problem called with robustness.
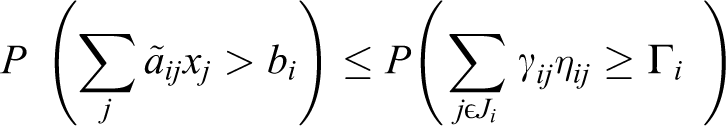
(a) The probability for negation of ith restriction is as follows:


(b) Values γ
ij
come true for all the values j ε Ji
– Si
in γij
≤ 1.

The proposed model and how to perform it
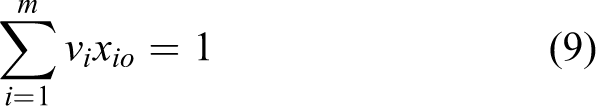
With regard to what is mentioned, there are 60 DMUs under study with a number of inputs and outputs. Inputs of problem for ith DMU have been displayed with X 1j , X 2j , and X 3j , and 16 outputs related to the enablers which are uncertain scores have been displayed with [Ỹij L , Ỹij U]. The 17th output represents score of results of performance which is calculated via hierarchical method in the form of a certain value (see Figure 1).

The diagram representing inputs and outputs to assess suggestions system.
This model can be explained using European Foundation for Quality Management (EFQM) model. In assessments, the elements that contributed to better performance of this system in the organizations are taken into consideration in addition to the criteria considered with EFQM model. In the proposed model, in this research, the weights corresponding to the advantages of each of organizations mentioned as the features of DEA method are used instead of the use of fixed scores for each group of defined factors and criteria, which is mentioned as the most important fault of the current assessment system. The criteria related to three above enablers are assessed by different experts. Each of the above criteria includes several subcriteria to which a value ranging from 0 to 100 is given for trust on assessments. Then the mentioned values are integrated and combined with view of other experts, for example, assume five persons engage in assessment of jth unit (DMU j ), these five persons represent their views considering the defined scale in the diagram for factor F 11 which defines the practical actions of leadership to progress the aims of suggestions system (see Table 3).
How to get output data based on views of experts, in the proposed model.


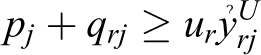
With regard to the assessments by five persons, it can consider the obtained result in form of an interval with uncertain bounds [ỹrj L , ỹrj U ], in which

In terms above, yij
L
and yij
U
are called with nominal values in uncertain bounds in above interval, and
yij L denotes mean of low bounds of assessors’ views/number of assessors.
yij U denotes mean of up bounds of assessors’ views/number of assessors.
The probability for negation of restrictions in output-based CCR model by considering different values for Γ is shown with instance, for example, it equals 0.42, 0.32, 0.22, and 0.13 for values 5, 6, 7, and 8, respectively. Therefore, it seems that Γ j = 6 can be a suitable value for this problem

Now, we present the mathematical details of the RDEA model proposed in this article. Let us consider the DMU
j
and assume that Jj
is the index set of the imprecise output values. Let us further consider parameter Γ
j
, not necessarily integer, that assume value in the bounded interval [0,


We use the robust optimization approach to introduce βj (y, Γ j ) to move from the optimistic to the pessimistic viewpoint. In other words, these variables protect the constraints against data uncertainty and keep them feasible

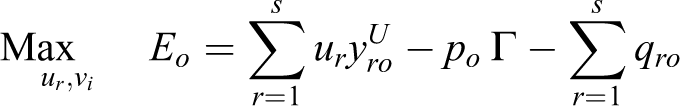
Now, with regard to our approach, the defined robust model obtains up limit of efficiency for each of organizations . The difference is that, according to the approach mentioned, here all units are considered in the best condition. If we consider yro = yro U , yrj = yrj U , and ỷrj = ỷrj U , then model above is solved by considering the following form, which is used to calculate the efficiency and rank of DMUs:


We should note that the level of conservatism in the output data has to be discretely determined by the decision maker (or expert). In this research, we assumed that all Γ j are equal to Γ. As a result, we formulate the following nonlinear model:
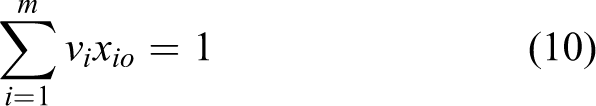


Research findings and results
Now we follow our approach to solving model (10). This model is solved for different combinations of Γs, and values of weights and rankings for each DMU are saved using the obtained values for E. The DMU efficiencies obtained for each gamma through the RDEA model may result in different rankings of the DMUs (see Table 4).
The efficiency of some DMUs for different gamma levels.

In such cases, many analysts allow a decision maker to use his or her preferences in selecting a suitable gamma (see Figure 2). We utilize a graphical presentation of the results enhanced with a Monte Carlo simulation to provide additional insight for making a final decision about gamma and the overall rankings of the DMUs. For each input and output of DMUs, a number is randomly generated using Monte Carlo simulation and by the resulting weights from
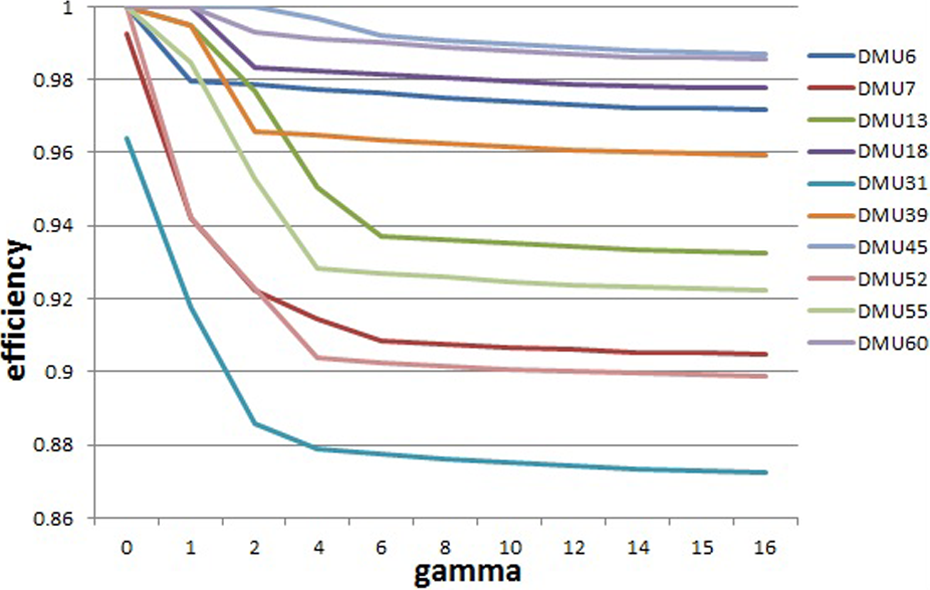
The efficiencies of some DMUs for different Γs.
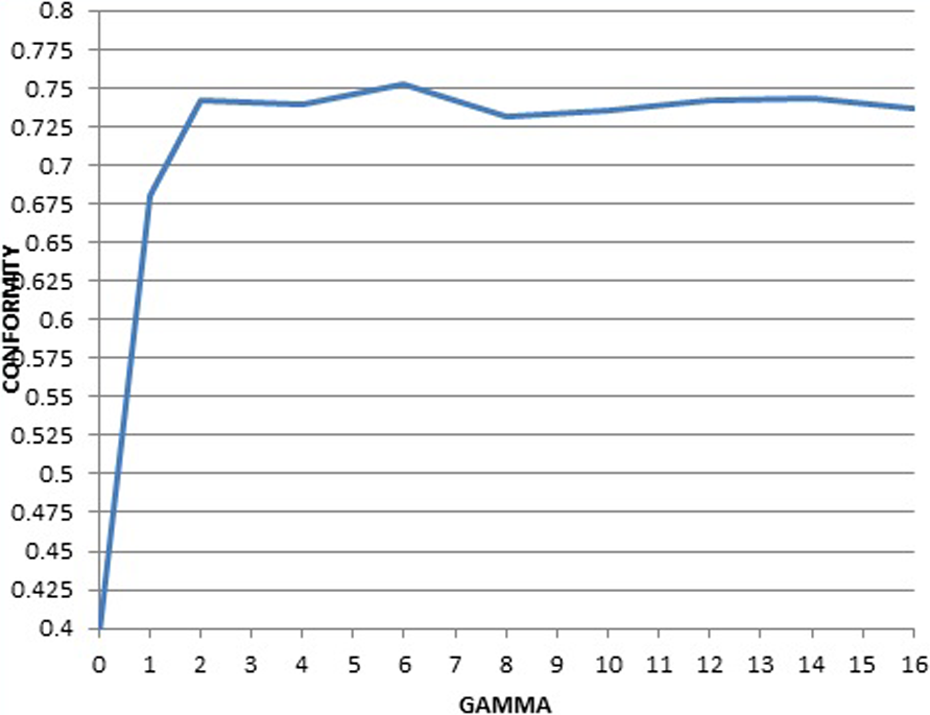
The average conformity between the ranking of the DMUs using model (10) and the simulation runs for different gamma values.
The average conformity for different gamma values.

Taking into account the data related to the research and implementation of model IDEA, for each DMU, two upper and lower limit values are achieved. The average of these two values is calculated, and then, the units are ranked based on these obtained values. The results obtained for the first 16 units, and also, the ranking of units obtained with implementation of RDEA model, are shown in Tables 6 and 7.
Average of upper and lower efficiency using IDEA and RDEA.

IDEA: interval data envelopment analysis; RDEA: robust data envelopment analysis; DEA: data envelopment analysis.
Ranking of the first 16 units, using IDEA and RDEA.

IDEA: interval data envelopment analysis; RDEA: robust data envelopment analysis; DEA: data envelopment analysis.
As can be seen from the above table, by implementing RDEA and increasing the gamma value, power detection and differentiation of the model increase. In the above table, the best results have occurred on Γ = 6. With regard to the amount of gamma, units 16, 21, 33, 40, 41, and 44 are efficient, and other units have been ranked. As can be seen in Figure 4, the ranking of the units for Γ = 6 and greater than 6 was similar, and thus can be concluded that in this research, the results for Γ = 6 and greater than 6 are stable.
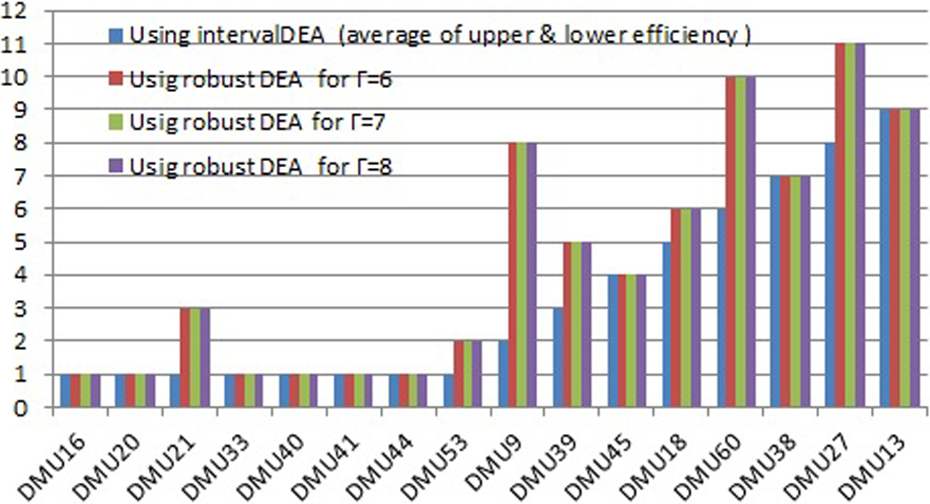
Ranking of the first 16 units, using IDEA and RDEA. IDEA: interval data envelopment analysis; RDEA: robust data envelopment analysis.
Conclusions
In this study, a pattern has been proposed to evaluate the efficiency of organizations in performing suggestions system using RDEA model with the following features: Two categories of input and output data are detected in the assessment of suggestions system based on the proposed criteria grounded on excellence approach. There are 60 DMUs under study, with 3 inputs and 17 outputs. Inputs and one of outputs are in form of certain values, and 16 outputs are related to the enablers which are in form of intervals with uncertain bounds. We deal with a type of interval data that their limits are indefinite.
In the conventional DEA, all the data assume the form of specific numerical values. However, the values of some output data in this study are imprecise. The imprecise or vague data in the DEA models have been examined in the literature in different ways. The imputation methods to estimate the approximations of the imprecise values, the exclusion of the units with imprecise values from the analysis, and the stochastic approach are among the methods most commonly used to model uncertainty in the DEA literature. Recently, the IDEA and the fuzzy DEA are used to deal with the imprecise data in DEA. The contribution of this study is threefold: (1) We consider uncertain and imprecise output data and implement the proposed framework in the real-world (to evaluate efficiency of organizations in performing suggestions system); (2) we propose a robust optimization DEA model in which the output parameters are in form of intervals with uncertain bounds; and (3) we use a method of simulation to specify a range of gamma in which the rankings of the DMUs occur with high probability and then compute the conformity of the rankings resulting from the mathematical model with reality.
Moreover, the use of the proposed model for assessment of suggestions system has useful elements and components such as the possibility to consider views of experts, comprehensiveness of indices in the enablers section and results section, adjustment with EFQM system and its criteria and concepts, and lack of existing conflicts in the current assessment system. The important aim that is pursued in the assessment of suggestions system in organizations is the survey for omitting deficiencies of organization by having successful models than the rest of organizations. An issue under discussion is emphasized in the assessment logic with excellence model, for which no certain executive mechanism has been predicted. The present research indicates that the used model paves the way for such possibility for inefficient units. Detection of reference units in DEA specifies the most accessible models for each of the organizations. An interesting point lies on the fact that most of the organizations especially public organizations fail to select values for input variables such as budget, number of staffs, and/or education level of staffs, and enjoy restricted authorities in this context; thus, they introduce the existing difference in these elements compared to the rest of organizations in selection of the most superior suggestions system. Assessment logic in the current assessment system does not have the possibility for transparency in this context. Yet, the use of input-based models of DEA raises such doubts and clarifies difference in each inefficient organization with reference organizations by comparing outputs. Another point lies on existing flexibility in the proposed model. Parameter Γ in the proposed model provides this flexibility. On the one hand, increasing value of Γ can raise sufficient trust to consider all the assessments by the assessors. It seems that we can use this parameter as a regulating parameter to build balance in this context.
Footnotes
Declaration of Conflicting Interests
The author(s) declared no potential conflicts of interest with respect to the research, authorship, and/or publication of this article.
Funding
The author(s) received no financial support for the research, authorship, and/or publication of this article.