
Abstract
This paper presents the results of a longitudinal study of four continuous improvement (CI) leader companies in two different global regions. The goal of the research was to understand how employee perception of different factors that impact the long-term sustainability of the CI process might change over time. Quantitative data analysis was used to capture and statistically analyse employee perceptions by CI factor, time, and geographical location. After validation and reduction techniques were applied to the research model, five factors were singled out: change management, strategic planning, knowledge management, performance management, and sustainability of the CI process. For two of the four companies, no changes in perception were found during the period of study for any of the factors. For the other two, however, changes were perceived in at least one of the five constructs in the study. Changes were also found across the regions included. By leveraging the quantitative analysis with qualitative data collected through interviews and visits to the case study companies, we were able to explain the changes in perception and single out the best CI management process to sustain CI in the long term.
1. Introduction
Engaging in innovation and supporting activities that unleash creativity and invention are vital to strengthen the economy [1–3]. Continuous improvement (CI) offers many advantages for firms aiming to become innovative. It establishes an environment where discovery becomes a learning process that can deliver results, aligning company and personal objectives [1, 4]. Despite the large advantages and numerous benefits resulting from CI, CI is nevertheless known to be hard to sustain over time [5].
Several authors have identified numerous factors that impact the sustainability of CI. Jaikumar [6] and Walton [7] suggested that organizations willing to take risks and undergo a learning process are focused on providing skills and knowledge to their associates, and proving to be more successful in adopting and implementing change. In these organizations, members are conscious of generating, retaining and leveraging learning towards performance improvement. Members use tools to monitor and ensure sustainability of learning. Developing learning programmes that promote greater focus upon a goal, commitment to supporting continuous learning at operational and management levels to develop strategic thinking, and a culture with an organizational climate which tolerates failure associated with learning and experimentation are required for change adoption [6, 7].
1.1. Literature review and research model
The literature includes several studies showing the positive link between CI and innovation. McAdam et al. [3] studied 15 organizations to evaluate the existing relationship between CI and innovation. They concluded that the relationship between CI and innovation is a causal relationship, where incremental innovation is the result of the introduction of continuous improvement. Additionally, this study showed that firms with high scores in innovation tended to build an innovative culture based on establishing a continuous improvement program. Comparatively, the firms that had a low score in innovation also lacked an existing CI programme. Flynn [8] conducted a study with 712 respondents from 42 manufacturing firms to analyse the relationship between quality management practices and incremental innovation. The author concluded that a culture based on a strong notion of quality and continuous improvement develops the organizational support required to employ incremental innovation in products and processes. In some cases [9], regional effects might have an impact on empowerment and management of the CI process in a company. Findings presented by Robert et al. [9] indicated that the CI process is less sensitive to culture than empowerment; these authors highly recommended considering the local regional culture when deciding how to manage employees.
Prajogo and Sohal [4] also researched the relationship between CI and incremental innovation, and concluded that both approaches are focused on meeting customer needs. CI encourages small but constant changes in current products, processes, and working methods; therefore, CI can lead firms to become innovative by taking these small changes as an approach to innovation, or more specifically, incremental innovation. It is necessary to analyse the factors that affect the sustainability of CI to pursue incremental innovation. In the past few years, researchers have developed several models to help companies to reach this goal of sustainability. However, some of these models are complex, expensive, and have a low rate of successful implementation [10], and firms must increase their competitiveness by supporting incremental innovation with tools such as CI.
Given that more research is needed in order to understand how changes in policy or actions impact the sustainability of the CI process over time, the following null hypothesis is proposed:
H1: Time has no effect on the perception of constructs that impact the sustainability of the CI process.
It is also critical to understand how factors that impact the sustainability of the CI process are perceived in companies located in different regions. Hence, the following null hypothesis is proposed:
H2: Region has no effect on the perception of constructs that impact the sustainability of the CI process.
Therefore, the goal of this research is to determine changes in perceptions of factors that affect the CI process in companies across different regions over time. Only by understanding these factors and how they are related will organizations be able to design a better environment that adopts CI and innovation into growth strategy in different regional and cultural contexts. Hence, a secondary objective is to find out how the factors that impact the sustainability of the CI process are related.
For a better understanding of the factors that impact the sustainability of the CI process, a framework research model was created based on similar research [11–13]. Extensive secondary research was conducted that yielded the following factors or constructs that impact the CI process and its sustainability:
Strategic Management (SM). Describes how management integrates a plan to accomplish CI as an explicit objective, as well as how this strategic plan is deployed and perceived by associates at all levels [11, 13, 15]. Leadership (LE). Refers to how formal and informal guidance is exercised across the organization, including the mechanisms developed for decision-making, two-way communication, feedback, and development of leaders. Also evaluates how values and directions are reinforced [11, 14–16]. Measurement and Information Deployment (MID). Determines to what extent information related to improvement and performance dimensions of outcomes is clear and accessible to every associate, how systematic the information deployment is as a part of daily work procedures, and how employees are rewarded for contributions [11,14,16]. Operational Management (OM). Evaluates the CI management process at the operational level, including how associates are actively involved in identifying needs, solutions, and actions required to solve problems [11,14–16]. Training (TR). Determines to what extent training has become a formal process inside the organization, and to what extent it has been applied to functional areas [11, 14, 16]. Change Adoption (CA). Examines how the need for change as improvement is understood, and the effort of the organization to adopt new ways to work [11, 14, 16, 17]. CI Sustainability (CIS). Refers to the sustainability and performance of the CI [18].
The proposed research framework is shown in Figure 1; each construct in the framework is operationalized using various items. For example, the construct Strategic Management includes 12 items (V1 to V12) and the construct Change Adoption comprises eight items (V48 to V56).

Conceptual research model developed from the literature
2. Methodology
The methodology followed to conduct the research is presented in Figure 2. After the research framework was developed using previous research on CI and potential factors that drive or inhibit its sustainability, a questionnaire was designed. The questionnaire design followed the following steps: i) definition of research objectives, ii) definition of constructs, iii) definition of operationalized measures, and iv) pre-testing of the questionnaire.

Research methodology
The questions included in the questionnaire were divided into two sections. The first section concerned demographics, where information regarding the department, role and time working in the company was collected. The second section was related to the latent variables that follow the structure of the research framework in Figure 1. A five-point Likert scale (1=strongly disagree to 5=strongly agree) was used to capture the level of agreement of each respondent on each item. The questionnaire had a total of 60 items (V1 to V60 in Figure 1). The Likert scale was used to provide a consistent response format for further statistical analysis [19]. The five-point Likert scale was chosen over the seven-point Likert scale to reduce the respondent burden, and also because the seven-point scale does not increase reliability [20]. To ensure validity of the questionnaire, the following pre-testing methods were reviewed: forms appraisal, cognitive interviews, focus groups, observational interviewers, and behaviour coding [21–25].
The questionnaires were applied to four companies in the medical devices, chemical compounds, wood products, and healthcare management business sectors, respectively. The common feature among all the companies was the adoption of the CI initiatives more than 10 years ago (mature CI industries). Companies were previously contacted to seek their agreement to participate as case studies. According to research on continuous improvement, manufacturing and services were chosen as the target population to apply the questionnaires, since in both these industry sectors CI is considered as a tool to support innovation [26]. Companies from two different regions, North America (USA) and Latin America (Costa Rica) were included to obtain information from sources where limited research has been performed [10, 27], which might provide insights in terms of cultural and regional aspects.
Because the study required data to be collected in a longitudinal format in order to analyse the sustainability of the CI process, questionnaires were applied four times (repeated observations) to each company about every three months starting from May 2011 through July 2012. Questionnaires were handled directly by the Human Resources Manager or the CI Coordinator, who randomly selected the respondents each time the questionnaires were applied. The questionnaires were designed to be self-administered. Thus, 50 questionnaires were handed out to the randomly selected respondents (i.e., one questionnaire per respondent). After this, respondents were given a week to return the questionnaires to their direct supervisor, who sent them back to the HR manager or the CI coordinator. Those respondents who did not return the questionnaires within the first week were verbally reminded after two and three weeks. Questionnaire collection was considered closed four weeks after distribution.
To support the quantitative analysis of repeated observations, the researcher performed site visits to gather information through observation and semi-structured interviews as an effort to more broadly understand the factors and how they impact the sustainability of CI. Methods used were similar to those suggested by Mansourian and Madden [28] when analysing perceptions.
After the data collection period (May 2011 to July 2012), all questionnaires were subjected to internal and construct validity tests. Cronbach's alpha coefficient [29] was used to test for internal reliability of the items in each construct. Items that did not make the cut-off value of 0.7 were eliminated [30,31] from the analysis. To test the fit of the remaining items to the model (the construct validity), confirmatory factor analysis (CFA) was used [32].
Once the items and the constructs were tested for internal reliability and construct validity, respectively, the remaining items and constructs were reduced to a set of single variables using sub-scales (scores), as suggested by Zhu and Kim [33] for longitudinal, regional, and correlation analysis. Different reduction techniques such as the average, mode, or a summation were performed on each construct to obtain a single score or variable per construct. This reduction method has been employed in the past in similar research [34–39].
3. Results and Discussion
3.1 Sample Demographics
A total of 352 respondents from four companies were obtained during the 14-month sampling period (May 2011 to July 2012). The respondents were categorized by the level of their job position: 32.39% of the respondents worked at an operational level, 31.43% worked as staff employees, 17.43% had a supervisory role, 11.43% were managers, 6.29% referred to their current position as “other”, and 1.14% were directors.
Regarding the functional area where respondents were working at the time they answered the questionnaire, 42.29% of respondents were employed in a role related to manufacturing/production. The second most common functional area was customer service, which accounted for 18.57% of the respondents, followed by “other” (including quality control), accounting for 15.14%. Figure 3 shows the distribution of respondents per functional area.

Distribution of respondents per functional area
The majority of the respondents had been working for their company for five or more years (55%); 31% had been working for more than two years but less than five years, and 14% had been at the company for less than one year.
3.2 Test for internal reliability: Cronbach's α analysis
The first statistical analysis is the Cronbach's α analysis to test the internal reliability of the questionnaire used. In this research, Cronbach's α shows values ranging from 0.95 to 0.96. Since all values are acceptable, CFA is instructed to test the hypothesized research framework structure as shown in Figure 1.
3.3 Constructs Validity Test: Confirmatory Factor Analysis (CFA)
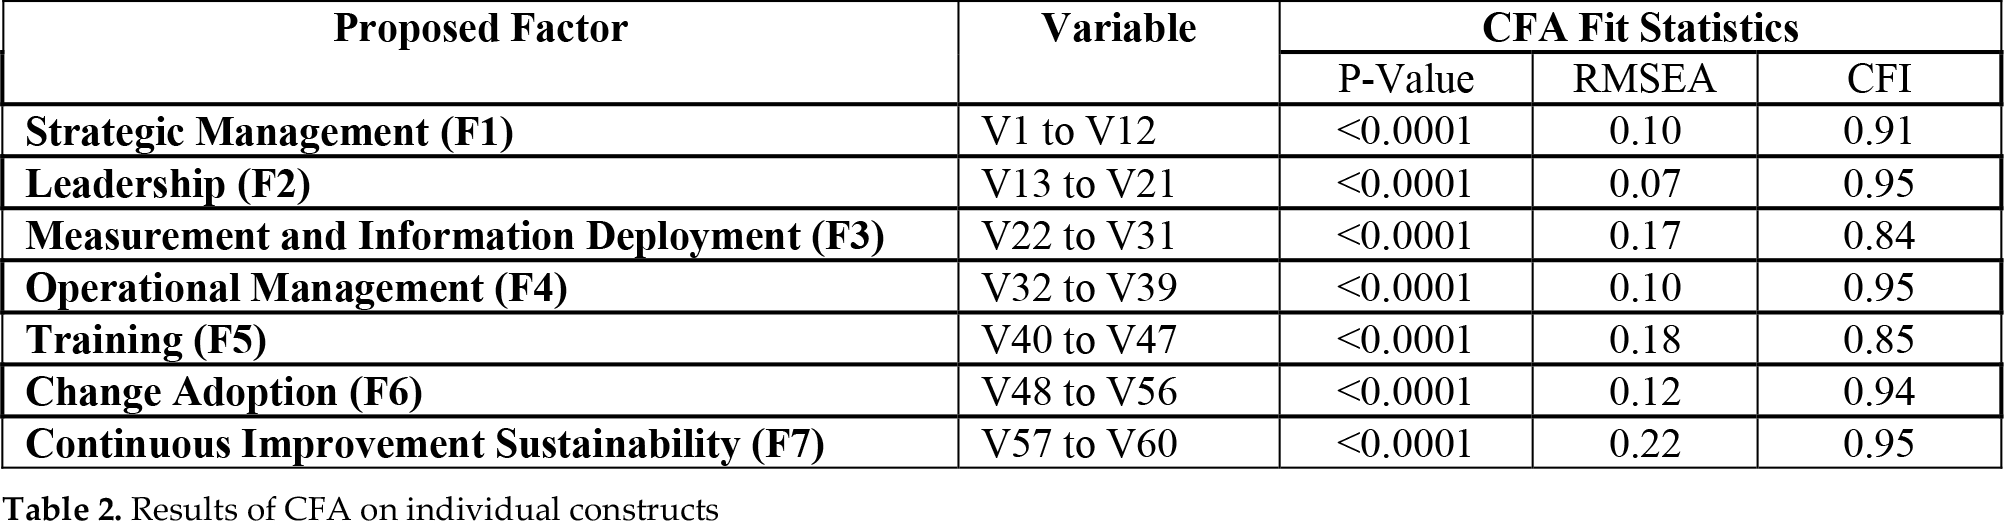
In order to perform the CFA, a data reduction technique was necessary. The reduction technique used was the summation of all individual items within the same factor [40]. The CFA was performed using the CALIS procedure available in the statistical software SAS. The CFA was used to verify if the proposed structure was a good fit to the data by describing similarities of the observed matrices. In this case, the results of the test indicate that the proposed factor structure is not a good fit for the data. Acceptable p-values using the Chi-square test should be equal to or greater than 0.05, acceptable values for the comparative fit index (CFI) should range from 0.9 to 1.0, and acceptable values for the root mean square of approximation should be less than 0.08.
The results for the CFA test for each individual constructs are shown in Table 2. According to these results, none of the seven factors had a structure considered as a good fit for the model (statistically significant). If the proposed research framework does not show enough evidence of being statistically significant, then a reconstruction of the model should occur. [41] advised that if this is the case, then the research has moved from a confirmatory to an exploratory study. According to Biazzo [42], exploratory factor analysis (EFA) seeks to undercover the underlying structure of a set of variables.
Cronbach's α for individual factors

Results of CFA on individual constructs
3.4 Exploratory Factor Analysis (EFA)
The EFA was conducted using the statistical software SAS and the FACTOR procedure. The communality estimates using the method of squared multiplied correlations and factors were retained using a cut-off value of one based on the Kaiser criterion for the eigenvalues. The maximum likelihood was used as the extraction method followed by a varimax rotation. This analysis resulted in five factors that were retained by the Kaiser criterion. In addition to this criterion, the scree plot test [43] was used to confirm the number of factors. Using this rule it was observed that the curve based on eigenvalues formed an elbow that indicated five factors. These five factors were retained, accounting for 86% of the total variance. For each factor, all items with a load equal to or greater than 0.50 were assigned to the corresponding factor. Using 0.50 as the cut-off value, 11 items out of the original 60 were deleted. The structure of the new constructs or factors can be seen in Tables 3 through 7.
Structure of Factor 1 after EFA and Cronbach's α analysis

The first factor was named Change Management (CM). All items with loadings higher than 0.5 were grouped under this factor, related to Change Adoption, Training and Operations Management according to previous research [11, 14, 16, 17]. Items with loadings lower than 0.50 or heavy loads in multiple factors were eliminated. After the assignment of items to Factor 1, a Cronbach's α analysis was performed and an acceptable value of 0.96 was obtained. The new structure for Factor 1 is shown in Table 3.
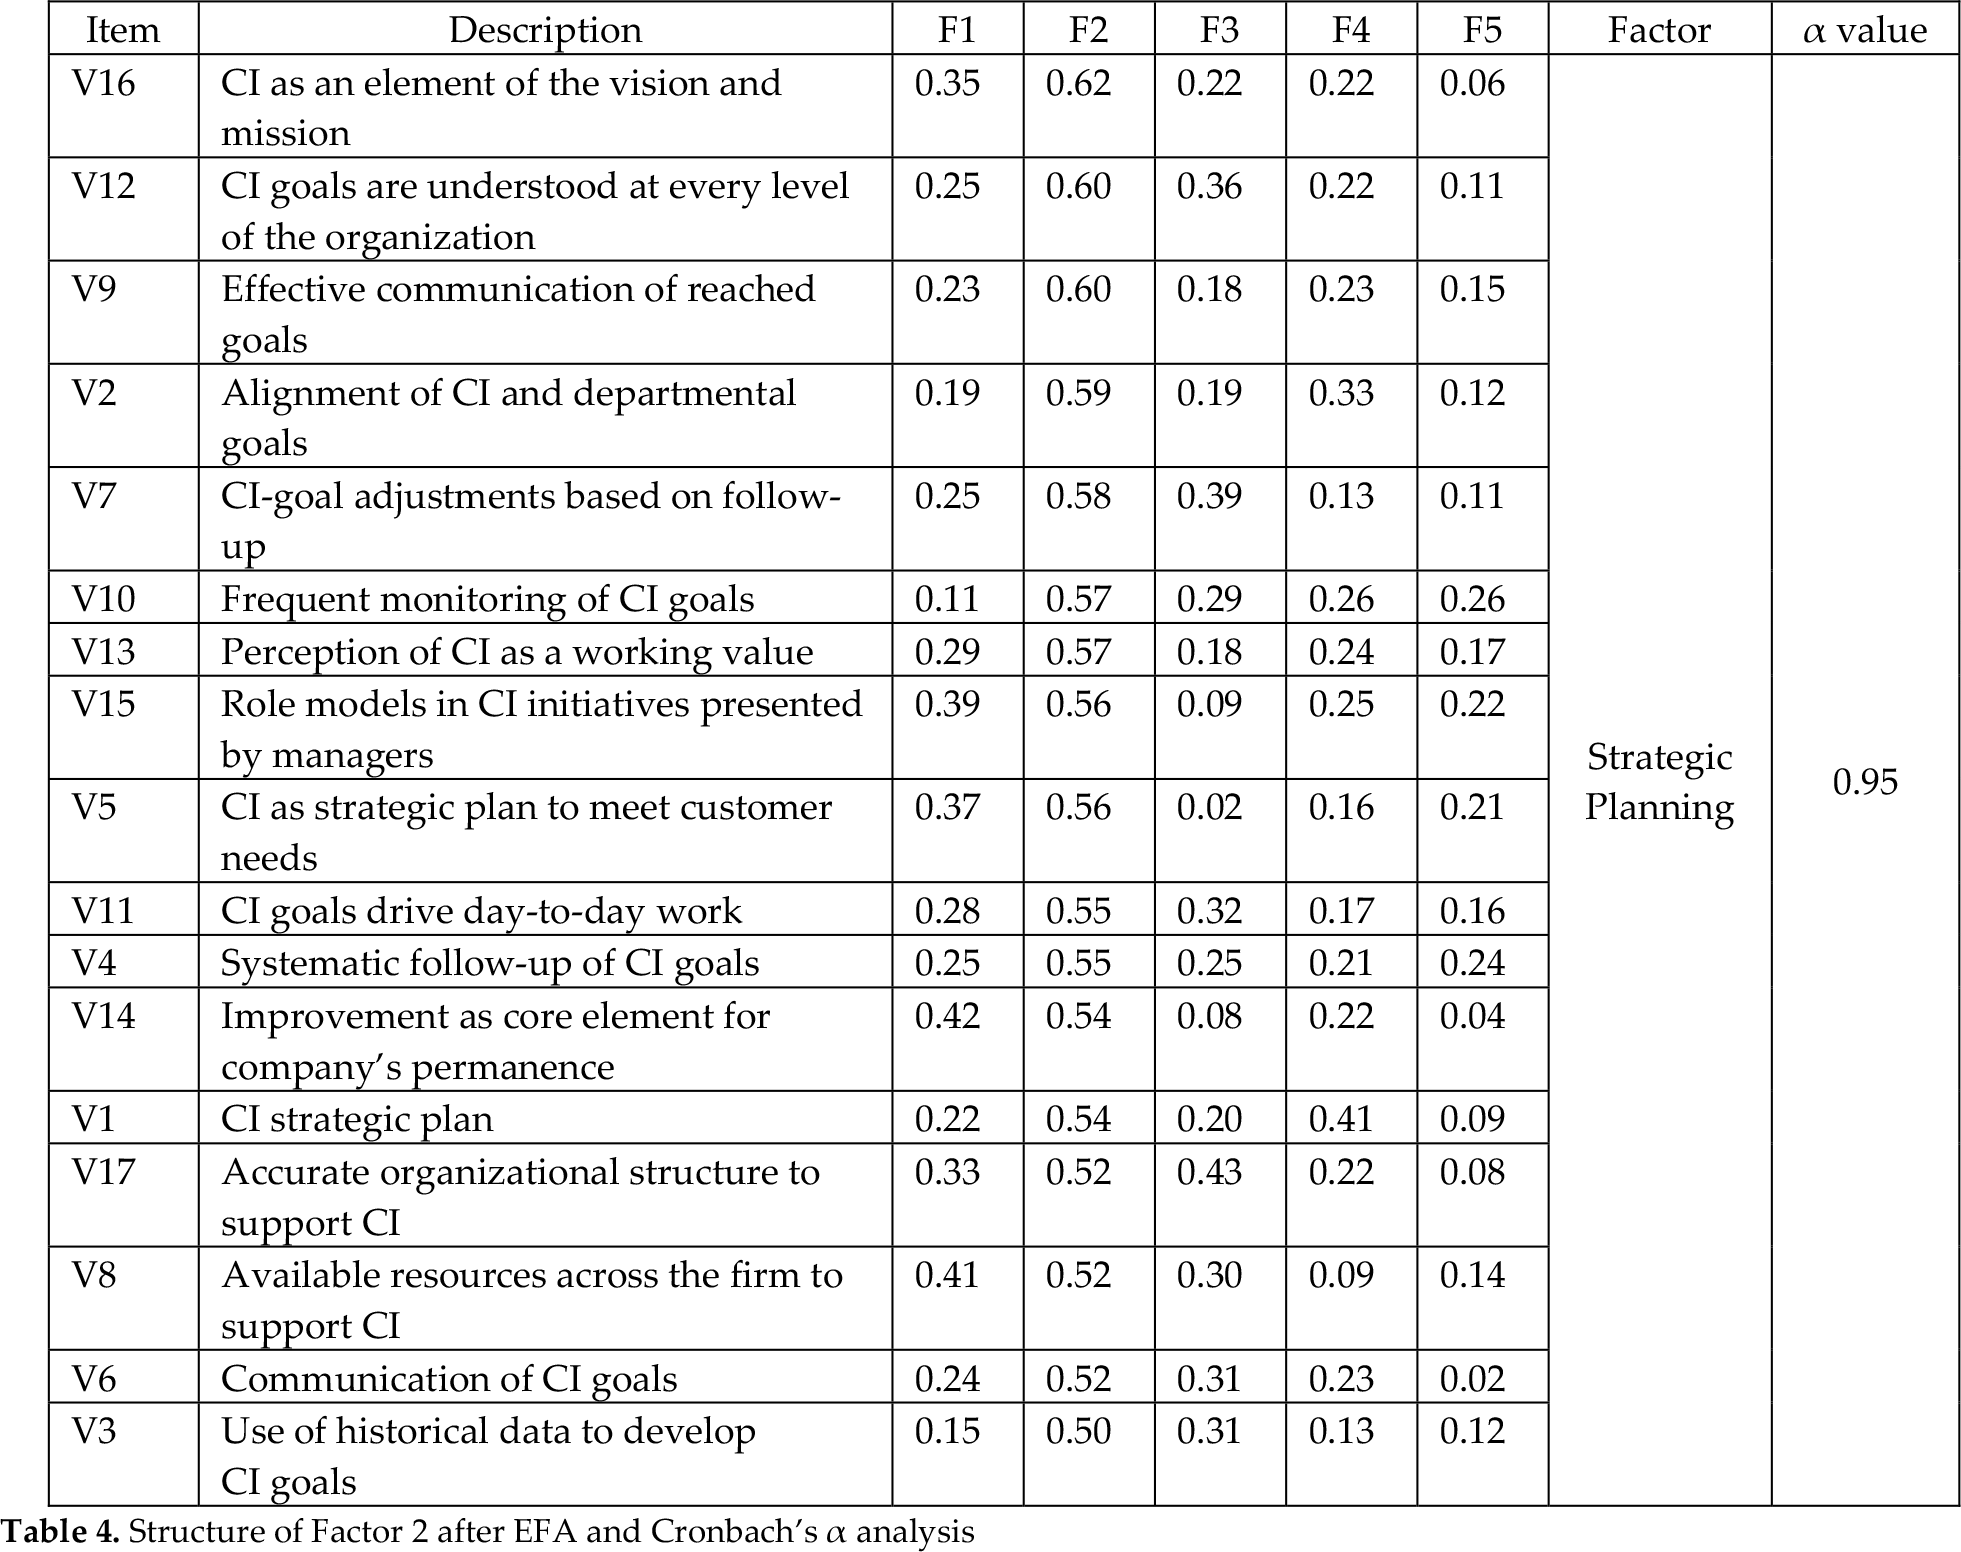
The second factor is Strategic Planning (SP). Items with loads above or equal to 0.5 were classified as factor two items. These items are mainly related to Strategic Management and Leadership according to previous work [11, 14, 15]. Items with loading lower than 0.50 or heavy loads in multiple factors were eliminated. After the assignment of items to factor two, a Cronbach's α analysis was performed and an acceptable value of 0.95 was obtained. The new structure for Factor 2 is shown in Table 4.
Structure of Factor 2 after EFA and Cronbach's α analysis
The third factor is Knowledge Management (KM). Items assigned to this factor show a load above 0.5. These items were identified as relating to Measurement and Information Deployment and Training according to [11], [14] and [16]. After assigning the corresponding items, a Cronbach's α analysis was performed resulting in a value of 0.91. Table 5 shows the structure for Factor 3.
Structure of Factor 3 after EFA and Cronbach's α analysis

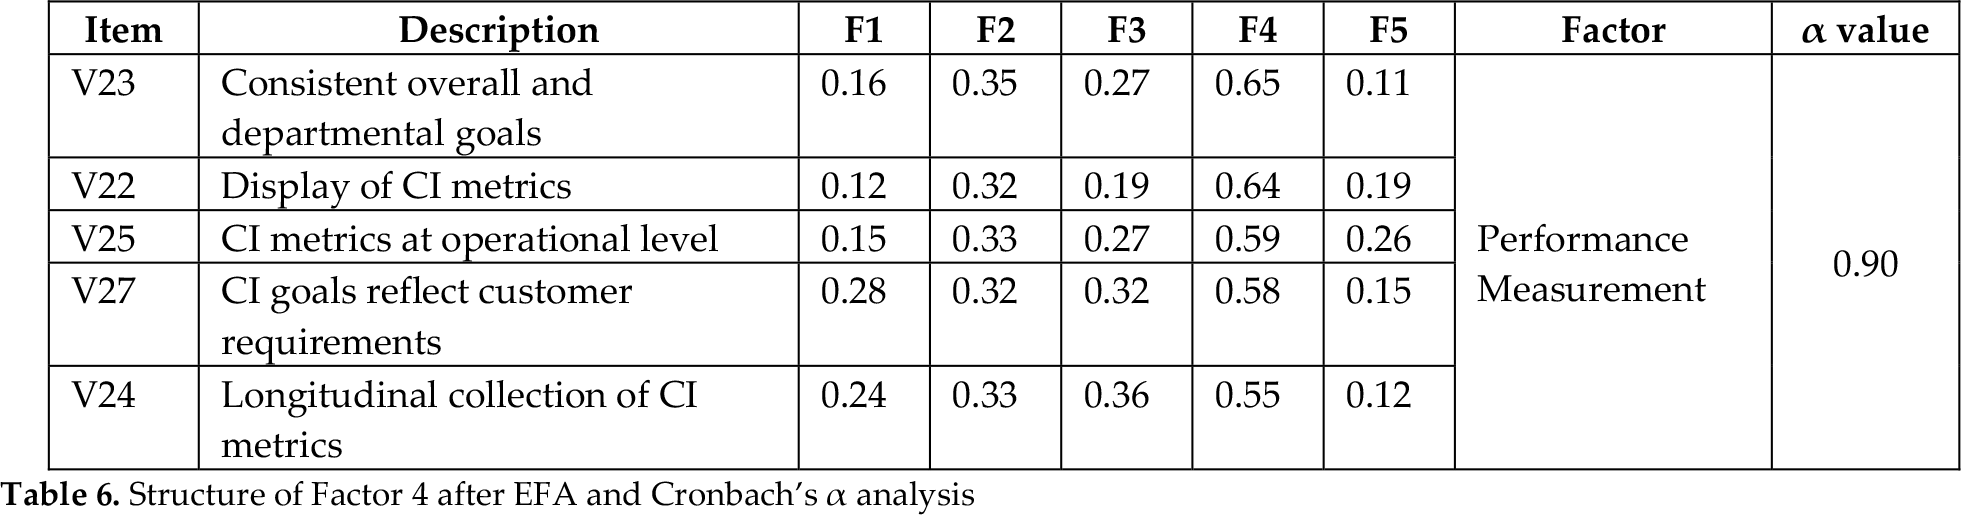
Factor 4 is Performance Measurement (PM); items belonging to this factor have a load higher than 0.5. Items assigned to Factor 4 are related to Measurement and Information Deployment and Strategic Management according to [11], [14] and [16]. A Cronbach's α analysis was performed to ensure internal reliability, obtaining a value of 0.90. Table 6 shows the new structure for Factor 4.
Structure of Factor 4 after EFA and Cronbach's α analysis
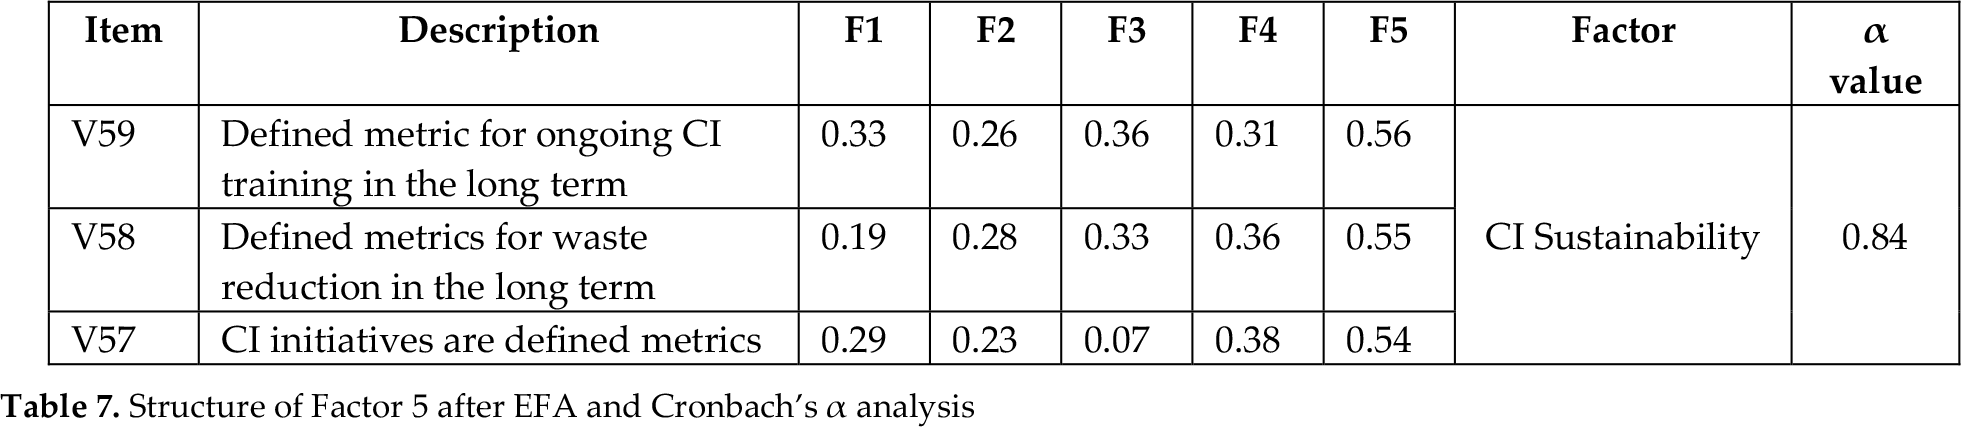
The last factor is CI Sustainability (CIS). To assign the corresponding items, a cut-off higher than or equal to 0.50 was used. Items with lower loads or heavy load in more than one factor were eliminated. The identified items are related to the performance and sustainability of the CI process as indicated by Carleton (2009). A Cronbach's α analysis was performed, obtaining an acceptable value of 0.84. Table 7 shows the structure for Factor 5.
Structure of Factor 5 after EFA and Cronbach's α analysis
3.5 Longitudinal analysis: Sustainability of the CI process
In order to test if the factors that impact the CI process are sustained over time, the five CI constructs revealed in the EFA were analysed. The following null hypothesis was formulated:
H1: Time has no effect on the perception of constructs that impact the sustainability of the CI process
The analysis required the use of an ANOVA test for repeated measurements in order to verify if there were significant changes in time by company in all of the five constructs. There are various statistical techniques for longitudinal data analysis. When analysing repeated measurements, as in this case, the most commonly used statistical approach is the analysis of variance (ANOVA) according to Gueorguieva and Krystal [44]. With this method, the researcher is able to determine if observed change in measurements over time is statistically significant. In order to conduct the ANOVA test, a subscale was constructed by summing all items for each construct, as advised by Suhr and Shay [40]. This technique reduces the amount of variables to just the number of constructs in the framework (in this case five variables). Qualitative data captured by the researchers during each of the four data collection points were used to explain potential changes in the longitudinal analysis of the constructs.
In order to conduct the ANOVA test for repeated measures, a non-parametric test (Kruskall-Wallis) was used to test if there were differences in the perception of employees of the sustainability of the CI process. The Kruskall-Wallis test is a non-parametric test recommended when there is no assurance that data are normally distributed [45]. In the cases where differences were found, the Wilcoxon Each Pair test (a non-parametric test) was used to identify the differences between pairs. Table 8 shows the results of the ANOVA for repeated measures and Figure 4 shows a scatter plot for each company during the period of the study.
ANOVA test for repeated measurements


Sustainability of the CI process during a 14-month period in four different companies
Companies B and D did not present any significant change during the period of the study on any of the five constructs in the analysis (significance level of 0.01). Company A only presented differences in the construct Change Management where period four was found to be significantly different than periods one and two (p values of 0.007 and 0.0009, respectively). Means were 58.07, 61.21, 63.40, and 72.37 for period one, two, three, and four, respectively. This shows an increase in the perception of change management in company A. When reviewing the data collected through the interviews and visits it was found that company A started to perform intensive CI training at the beginning of this research (May 2011). This might suggest that after one year of implementing the training process and the information deployment within the organization, there was a positive effect on associates' perceptions regarding the management of the CI process and the change resulting from its implementation. Even though no differences were found for the other constructs in company A, when looking at data against time, there is an upward trend for all constructs, similar to the trend found in the construct Change Management (CM).
Company C presented significant differences among all constructs during the period of analysis according to the Kruskall-Wallis test (significance level of 0.01). Each pair test was applied to identify where the differences were. It was found that periods one, two, and four were all significantly different than period 3 (significance level of 0.01). Results are summarized in Table 8. Qualitative data from the interviews and visits to Company C were used to explain these changes in time. It was found that Company C during period three was implementing a manufacturing site-wide measurement system, and during this implementation, no CI projects such as Kaizen events were run. These distractions or interruptions might have been perceived by the employees in a negative way within short periods of time.
3.6 Comparison of the CI process across regions
A need still exists to incorporate quantitative and qualitative data analysis and increase validity, as suggested by Patton [46]. There have been a few studies on the subject, the most relevant being those by Savolainen [47] and Marin et al. [48] who formerly conducted longitudinal analysis in the context of CI implementation. These authors bring considerable insights into CI implementation in the regional context, but there is little evidence of the effects of regional context on the sustainability of the CI process. Rather, studies such as [49, 50] deliver results primarily related to industries located in a single region. Hence, the following null hypothesis was formulated:
H2: Region has no effect on the perception of constructs that impact the sustainability of the CI process.
When constructs were compared by regions, it was found that constructs SP, PM, and CS were significantly different (significance level of 0.05) when comparing companies located in the US and Latin America. In the construct SP the means were 66.20 and 62.26 for Latin America and the US, respectively. In the case of the construct PM, the means were 18.70 for Latin America and 17.85 for the US; for the construct CS it was found that the means were 12.16 and 11.03 for Latin America and the US, respectively. In an effort to find an explanation for these differences, the qualitative data collected during the interviews and visits were analysed. These qualitative data might suggest that there is a linkage to higher scores in constructs SP, PM, and CS in Latin America because employees in Latin America are rewarded based on performance. For example, interviewed managers in companies A and B, located in the Latin American region, stated that annual raises and bonuses are directly linked to the results achieved for each objective. In both cases, it was indicated that the percentage of the salary raise is defined based on how indicators are achieved, and the annual bonus is based on the extra savings generated from surpassing goals. Companies C and D (located in the US) indicated that they followed a different procedure to set salaries. At Company C, salaries are increased by an average of 2%, regardless of performance. A similar situation is observed at Company D, where much of the work done towards CI is linked to neither performance nor salary raises.
3.7 Correlation of constructs
To find how the constructs are interrelated, correlation analysis was performed. Field and Miles [51] defined correlation values above or equal to 0.30 as moderate, suggesting that further examination is needed. Based on this criterion, it was found that all the constructs (CM, SP, KM, PM, and CS) are strongly correlated (see Table 9). These results might indicate that the defined constructs could interact in the support and sustainability of the CI process.
Pearson correlations for the constructs in the study

Further analysis of scatter plots (Figure 5) suggests that these correlations should be looked at with caution, however. For example, scatter plots for constructs CM vs. SP, CM vs. KM, and SP vs. KM show a random trend. The other visual correlations show the data scatter in less random patterns. Nonetheless, the results of the correlation analysis demonstrate the importance of SP as a construct to support CM. This is well recognized by authors such as [52], who state that SP helps to preserve time and energy by directing organizational efforts into a designed and proactive CI plan rather than a merely reactive and disorganized response. By supporting CM, PM is also implicitly supporting KM, since dynamics of knowledge, as mentioned by Drucker [53], requires that every organization builds a CM structure led by managers and top executives.

Correlations among constructs
4. Conclusions
Confirmatory factor analysis was performed to test the fit of a list of predefined items and constructs related to the sustainability of the CI process according to the literature. Although the CFA test indicated a lack of fit of the proposed research framework, EFA was used to redefine the research model and regroup the items to a new construct structure. This new construct structure (see Tables 2 to 7) accounted for 86% of the variability of the model, an acceptable value. The analysis of the constructs of the CI sustainability model was conducted based on a longitudinal and regional context. The results could help practitioners to understand how CI sustainability is driven, what inhibitors might slow it down, and what is necessary to sustain the CI process over time. If these factors affecting the CI process are known, companies from different business sectors can develop strategies to improve the performance of each factor. With a detailed focus, awareness of CI might be increased at every level of the organization.
The results of the longitudinal analysis of the constructs indicated that for Companies B and D there were no changes in perception of the CI constructs during the period of study. Differences for company A were only found for the construct change management (CM). But for the case of Company C, differences were found for all constructs in analysis. For this company, it was found that employees perceive events such as interruptions in CI activities in a negative way within short periods of time. This can have an adverse effect on efforts to sustain CI if any change is not properly communicated and embraced by workers. This might lead to the conclusion that time has no effect on CI sustainability but actions do. It was also interesting to compare companies by regional context. It was found that regional context might have an effect on how a company might manage strategic planning (SP), performance management (SP), and the sustainability of the CI process (CS). This difference might be influenced by how companies reward employees' efforts towards CI. The participating companies in Latin America tie CI goal performance to salary increases and end-of-year bonuses while the participating companies in the US do not follow this practice. As mentioned by the CI leader in one of the companies located in the US, the way employees are rewarded makes some metrics harder to reach than metrics directly associated with financial retributions.
The correlation analysis performed in all five constructs of the research framework indicated that there are strong correlations among all the constructs. The highest correlation was observed between Change Management (CM) and Strategic Planning (PM), and Change Management (CM) and Knowledge Management (KM). This finding might suggest that organizations where associates are constantly involved, not only as practitioners of the CI but also as managers of the CI, are better able to learn lessons and have databases which are more supportive of the change resulting from implementing CI initiatives. This strong correlation between CM and PM might also suggest that when organizational change is previously planned and associated to the company's goals, the company's associates better understand it.
As indicated in the literature, incremental innovation is the result of the introduction of CI initiatives through a sustained period. Companies that have been able to sustain the CI process for a long time have most likely developed an innovative culture where changes in perception of the CI process do not occur. Therefore, developing a CI culture will lead to an organization that manages and communicates change in an effective way, where employees feel positive about the CI process.
This study provides supporting evidence suggesting that time itself does not have an effect on the constructs. Rather, it is the actions, such as lack of CI initiatives over time, which positively or negatively affect how constructs contribute to CI sustainability. The results also reveal that there is a component related to economic retribution which, when linked to performance, connects sustainability and the defined goals.