
Abstract
This paper is based on a discrete-event simulation model and reproduces the sewing department of a clothing company involved in the fashion industry. It aims to quantitatively assess the effects of different production configurations on flow time and production capacity.
In particular, the production phases of men's jackets are examined. Eight configurations are evaluated, stemming from the combination of two parameters: batch size and number of machines. For each configuration, the flow time, the production capacity and the waiting time are computed. A subsequent Design of Experiment (DoE) analysis has been performed on these configurations, with the aim of identifying significant single and combined effects of the above parameters on the results observed. The goal is to obtain improvements in the production process. The data provided by the simulation is used in order to make a critical analysis of the system production and leads to the formation of proposals for the improvement of the lay-out.
1. Introduction
The fashion industry is often regarded as coinciding with the clothing sector, which indeed is its main component [1]. Since the origins of fashion theory [2], it has been observed that “fashion” is the word used to describe trends that affirm themselves in a spontaneous way in accordance with the Zeitgeist, i.e., the spirit of the age prevailing at a given moment. It is thus clear that “fashion” is actually a cross-sector concept [3], which is certainly applicable to the clothing industry, but can also be extended to companies operating in other sectors, such as leather goods, shoes, accessories and jewellery.
In the past, clothing was regarded by most people as a necessity and therefore its manufacture had mainly a functional purpose; however, this does not reveal an absence of the “fashion” component, because the quality of fabrics, the clothing design, the presence of accessories and the richness of materials have always been signs of belonging to different social classes [4]. In contrast, nowadays, clothing and fashion purchase decisions in developed countries are more based on “desire” rather than “need” [5]. Consumers also increasingly require product variety [6].
The fashion industry is characterized by short product life cycles, is volatile and exhibits unpredictable demand, tremendous product variety, long and inflexible supply processes and a complex supply chain. In such an environment, efficient supply chain management (SCM) practices can mean the difference between success and failure.
Although different researchers have proposed different viewpoints, a common element is that the fashion industry is full of uncertainty and unpredictability. Therefore, building a system to effectively improve performance is very important.
A company today must be able to understand its weaknesses and mistakes, must be able to make predictions on possible changes and quickly understand where, how and when to make the changes needed in order to optimize its management system.
It is necessary “to keep pace with the times” to satisfy customers, to compete effectively with competitors and to be able to maintain and promote products in the market.
The fashion industry has attracted the attention of researchers in the area of operations and Supply Chain Management (SCM) [7,8], mainly because in recent years the industry has become increasingly complex and dynamic. In this sector, the competition is fierce [9].
As such, it is easy to see that fashion markets are synonymous with rapid change and as a result, commercial success or failure is largely determined by the organization's flexibility and responsiveness [6]; therefore, researchers in the area of fashion have focused their attention on the domain of SCM [10,11]. Competitive sustainable advantages through low cost or high differentiation can be achieved only by managing the interconnections among the various organizations within a network [12].
In this study an analysis of an Italian clothing company involved in the fashion industry has been carried out in order to optimize production processes. In Italy, the clothing sector is very important. One of the strengths of its fashion industry, i.e., the phrase “Made in Italy”, is a sign of success, originality and creativity. In Italy, the production of clothing is particularly developed in local systems that have strong integration between them in terms of both the different stages of the production cycle and different suppliers. The main feature of the clothing industry is that it is based on small and medium sized manufacturing companies. The size of the companies is a key aspect in ensuring flexibility and the ability to adapt to a rapid-growth market, which is related to fashion and production in small batches. Italy is a leader in the production of clothing, although its position is constantly threatened on the one hand by the low cost of production in developing countries and on the other by the phenomenon of imitation of high quality products. Many companies have followed policies of production relocation to countries where labour costs are lower.
This context limits the introduction of new technology, which is a necessity especially for large companies that have the opportunity to use strong capital; however, this approach supports non-automated production in developing countries.
In this work, we exploit simulation with the aim of analysing different operational conditions of the sewing department resulting from the combination of several input parameters.
Simulation represents one of the tools most frequently used to observe the behaviour of a production system in order to highlight their efficiency levels and evaluate new management solutions in a relatively short time [13].
A main advantage of simulation models can be found in their capacity to provide estimates of the efficiency and effectiveness of a system and to assess the impact of changed input parameters on the resulting performance, without the need for examining real case examples [14].
Other research aimed at optimizing the production system of companies involved in the fashion sector includes De Toni and Meneghetti's [15] investigation concerns how the decision variables of the production planning process for a network of firms in the textile-apparel industry, e.g., planning period length, material availability, the link between production orders and customer orders regarding colour selection, can affect the system's time performance. In order to adhere to reality, they studied and collected actual data from one of the most important Italian companies, the Benetton Group SpA and used these observations as a basis on which to build a simulation model.
Ekren and Ornek [16] analysed and evaluated the effects of several pre-defined process parameters (including two different layout types, scheduling rules, machine downtimes, batch sizes and transporter capacities) on the performance of a manufacturing system. They concluded that various manufacturing parameters should be considered jointly when designing or re-designing a facility, because setting different levels for parameters can considerably affect the performance of a facility.
Bottani and Montanari [17] performed a simulation study whose objective was to compare the effects of different supply configurations on the resulting total supply chain costs and bullwhip effect. The parameters considered were:
number of echelons, re-order and inventory management policies, demand information sharing, demand value and responsiveness of supply chain players. The aim was to identify significant single and combined effects of the above parameters on the results observed.
Shafer and Charnes [18] performed a simulation study whose objective was to compare Cellular Layout and Functional Layout systems in a variety of shop operating environments.
The remaining sections of the paper are organized as follows. In section 2, the research approach proposed in this work is shown. Section 3 is divided into two parts: section 3.1 describes the case study and the problem formulation, while in section 3.2, new scenarios are proposed and assessed using Design of Experiment (DoE) methods. The discussion of the results is reported in section 4. Finally, the conclusion section reports the main findings encountered during the study, as well as future developments.
2. Methodology
The procedure proposed for analysing the production scenarios of the clothing company is shown in Figure 1.
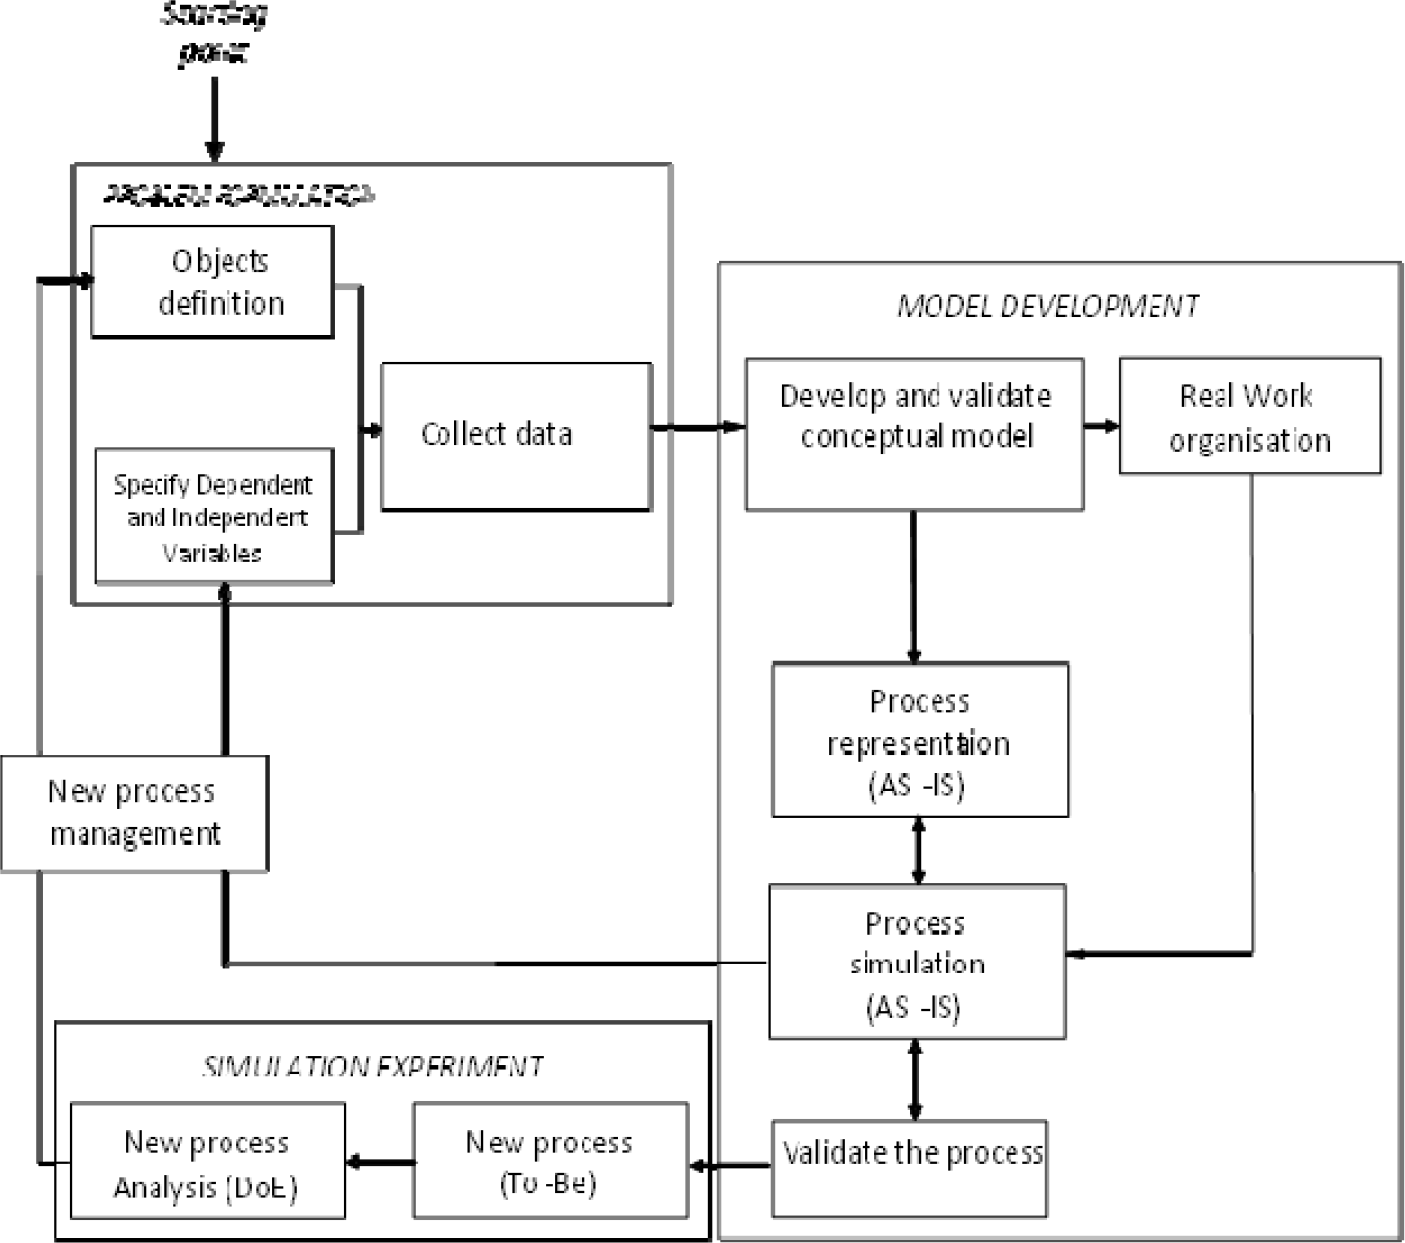
Research method.
In particular, three main phases can be identified: problem formulation, model development and simulation experiments.
2.1 Problem formulation
The starting point of the project is the identification of the strategic objectives. The approach proposed in this study has attempted to take into account the real problems of the company, considering the possibilities for increasing business and the problems connected with the availability of human resources, space and plants. According to the Delphi technique, an ad hoc panel of experts must be created in order to encourage communication and meetings, during which the members can contribute their knowledge of the processes. The Delphi technique [19] is a structured process that investigates a complex or ill-defined issue by means of a panel of experts. This methodology has proven to be an appropriate design for this type of research and permits individual opinions to be obtained within a structured group by using a communicative process. The panel works for a fixed period and the sessions are planned based on a multi-round Delphi process. All the statements are then collected and delivered to the members of the panel, who are required to indicate their level of agreement; the answers are then fed back to the panel. In particular, the panel of experts had to specify independent and dependent variables. Dependent variables reflect the performance criteria and independent variables include the system parameters. In a simulation model, independent variables are manipulated and their effect on dependent variables are recorded and analysed.
A data collection phase proceeds concurrently with conceptual model development. Data requirements must first be established in order to specify model parameters, system layout, operating procedures and probability distributions of variables of interest.
2.2 Model development
As shown in Figure 1, in the representation of the current process (As-Is), the process simulation and its validation are closely connected activities, with frequent interaction. Process mapping is necessary to define a representation of how the company works.
Model validation is the process of determining whether a simulation is an accurate representation of the system under investigation [20].
A “valid” model can be used to make decisions similar to those that would be made if it were feasible and cost-effective to experiment with the system [21, 22, 23].
An invalid model may lead to erroneous conclusions and decisions. The issue of validating the simulation model may be addressed in several ways. In this procedure, computer-based simulation output is compared with output data from the actual system for input-output validation.
2.3 Simulation experiment
Dynamic models are used iteratively to study system behaviour under different operating conditions. Subtle changes in resource availability or system loading can have dramatic effects on the performance of the system. Modellers, reviewers and practitioners should be aware of assumptions (e.g., normality or autocorrelation) that might affect the appropriateness of a given statistical technique for a given situation.
The choice of analysis techniques varies considerably depending on the distribution of input and output variables. In this procedure, new solutions (To-Be) are analysed using Design of Experiment and ANOVA methods. Finally, the new scenarios adopted have to be continuously monitored and improved through a feedback process.
3. Case Study
The study was conducted on an Italian company leader in the production of high-end men's clothing. In particular, the operations of the sewing department for the production of high quality men's jackets have been modelled using the simulation program Arena.
Firstly, the different phases of production of a man's jacket were examined. In the jacket production there are five main steps:
Inside creation Outside creation Creation of the body of the jacket Neck and shoulders union Sleeves seam
These steps are highlighted in Figure 2, which reproduces the layout of the sewing department.
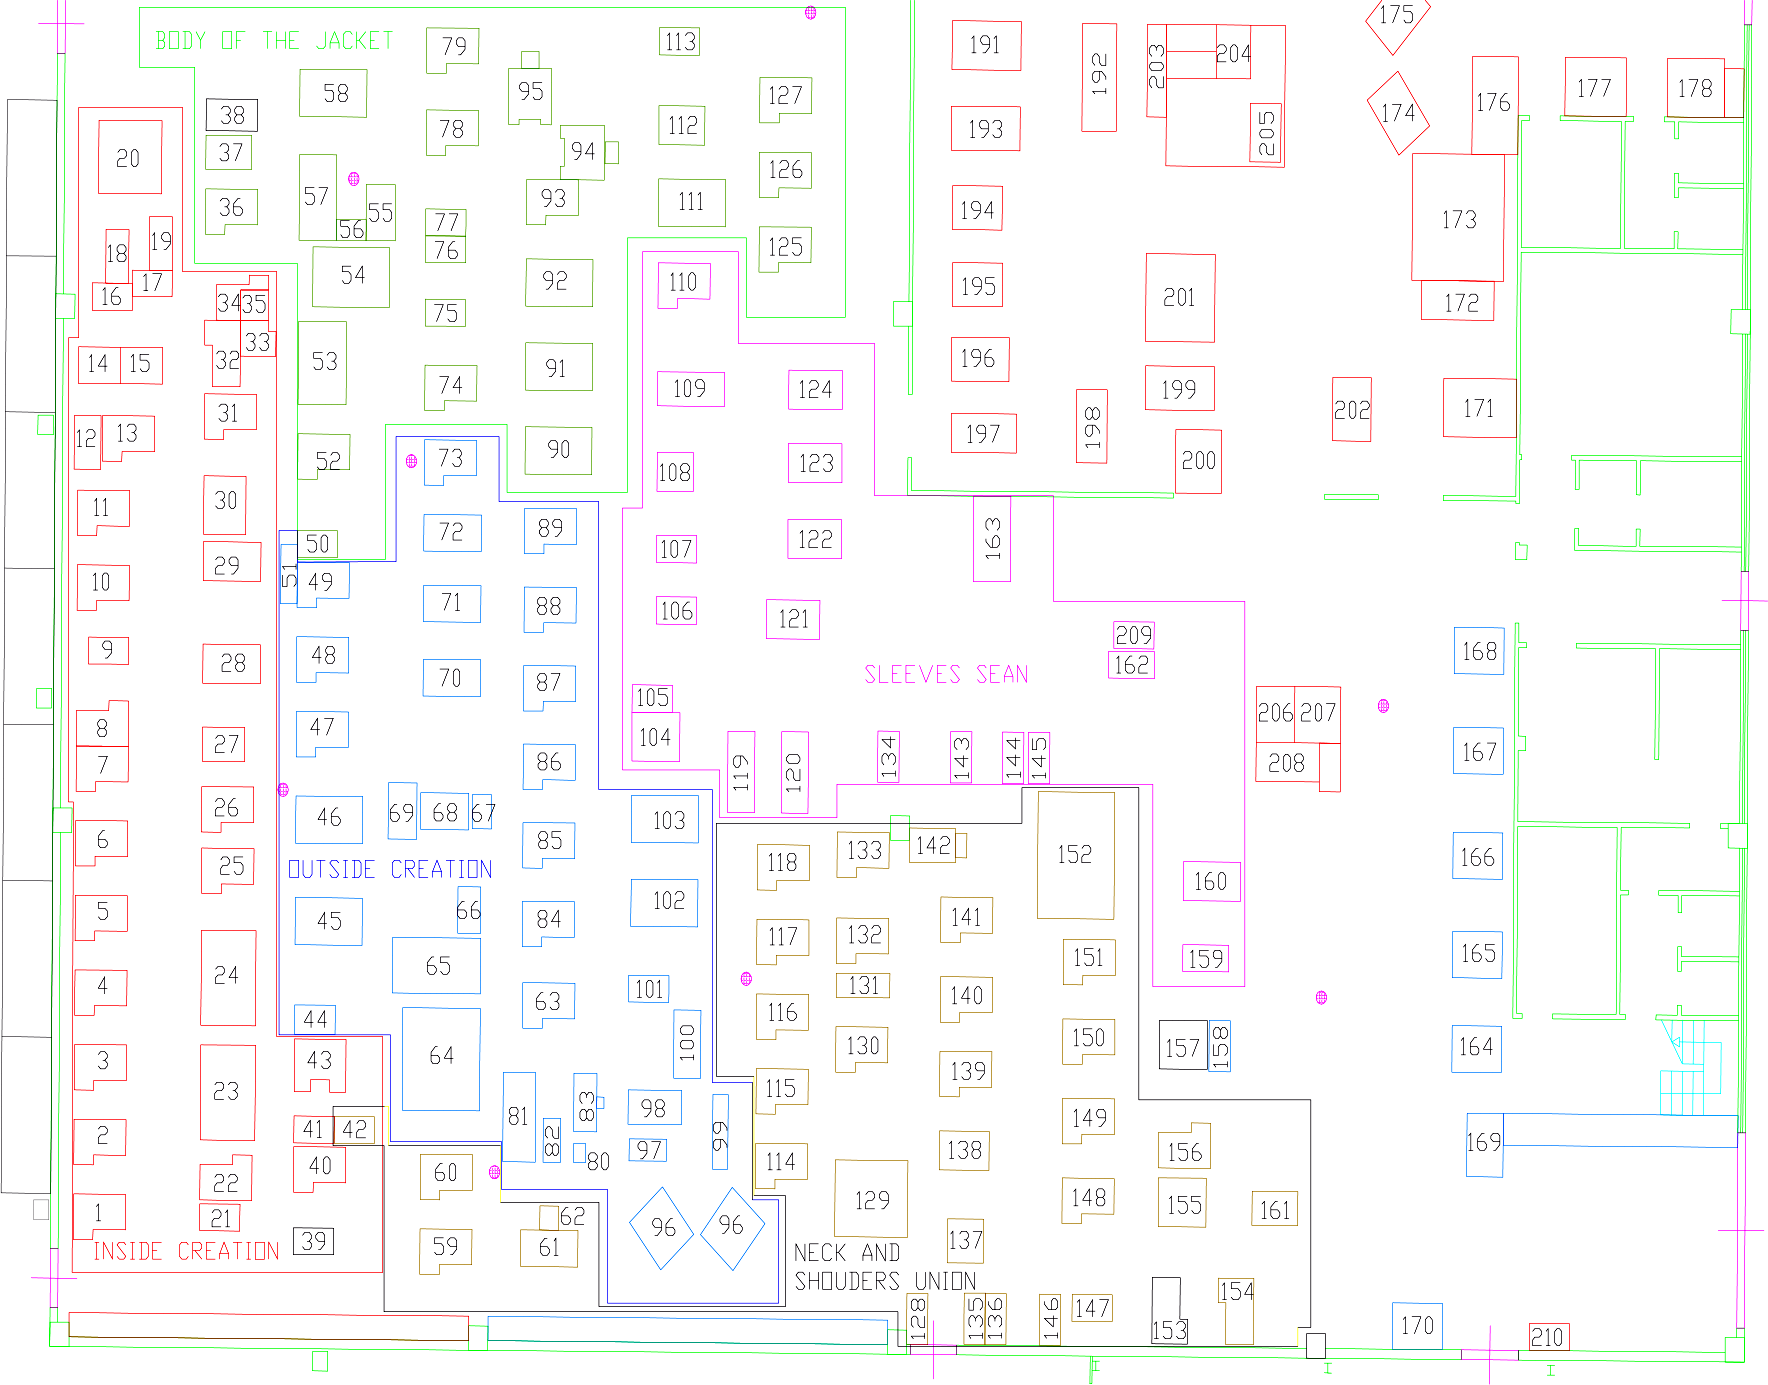
Department production layout.
An ad hoc panel of experts was created in order to identify the objectives and variables in this work using the Delphi method. The panel was made up of eight participants and included two academics, whose research studies were mainly focused on Business Process Re-engineering, five workers (three operators, one supervisor, one process manager) and one company administration representative. The panel worked for a period of two weeks and the sessions were planned on a three-round Delphi process. In this work, the process of data collection was carried out by two academics who took on the role of “facilitator”.
Lists of dimensions and types of machines were collated. The data collected regarding the machines allowed the academics to define the distribution function of unit processing time and the speed distribution function of transport systems. The distance matrix for all machines was obtained from the layout of the manufacturing plant. The assumptions for the current model were as follows:
Demand was assumed to be known at the beginning of each month. Machines needed to be set up before each operation and the setup time did not depend on operation time. Some alternative machines could be used interchangeably for operations of certain part types.
The following step involved the simulations of the As-Is processes. The performance indices (dependent variables) that were chosen in order to define the better solution were:
Flow time: the period required for completing the jacket. Production capacity: the number of jackets that could be generated by the company in a month using current resources. Waiting time: non-productive time, in which the jacket was waiting in the production process without being processed.
3.1 Process Validation
There are many methods suggested in the literature for constructing a point estimate and a confidence interval for the steady-state mean v=E(Y) of a simulation output process Y1, Y2….; for instance, Meketon and Schmeiser [23] introduced the method of overlapping batch means, Bischak [25] studied the idea of weighted batch means and Fishman [26] developed the autoregressive method.
In this study, a replication/deletion approach [27] was applied. This method is based on “n” independent replications of length “m” observations. This method tends to suffer from bias in the point estimator ν, while the other approaches are based on one long replication and tend to have a problem with bias in the estimator Var(ν) of the variance of the point estimator ν.
Initially there was a simulation start-up phase. In order to calculate this period of time, also known as ‘warm-up’, the method proposed by Welch [28] was applied. This phase allows the model to reach a steady state, with a warm-up period (1) of 3 hours.
The replication/deletion method was applied in order to obtain a point estimate and confidence interval for the steady-state mean v = E(Y). Only those observations beyond warm-up period l in each replication were used to form estimates; n =12 replications of the simulation were carried out each of length m = 20 days. Let Yji be the number of turnaround processes per hour carried out and let Xj be given by

Xj are independent and identically distributed random variables with E(Xj) ≈ v and an approximate 100(1-α) per cent confidence interval for v is given by


With a 95 per cent confidence interval we obtained ν=X̄(12) = 811 (parts per month) and

3.2 What if analysis
During analysis of the As-Is configuration, the panel of experts proposed two types of independent variables:
Modification of Transfer Batch (or Lot size) from 20 units (As-Is configuration) to 15, 10 and 5 units. Insertion of new machines so as to reduce bottlenecks. In order to identify the bottlenecks of the production process we used the simulation results of the As-Is configuration. In particular, two machines (P326 and P349A) showed longer queues and have therefore been identified as process bottlenecks. In this case, the Panel of Experts allowed the authors to confirm this identification. These changes have led to eight different scenarios:
L20_Sm: Lot size = 20 and the Same machines (‘As-Is’ configuration); L20_Nm: Lot size = 20 and the New machines L15_Sm: Lot size = 15 and the Same machines L15_Nm: Lot size = 15 and the New machines L10_Sm: Lot size = 10 and the Same machines L10_Nm: Lot size = 10 and the New machines L05_Sm: Lot size = 5 and the Same machines L05_Nm: Lot size = 5 and the New machines
By running the simulation for these scenarios for a time set to a month, we obtained the results summarized in Table 1.
Simulation results.
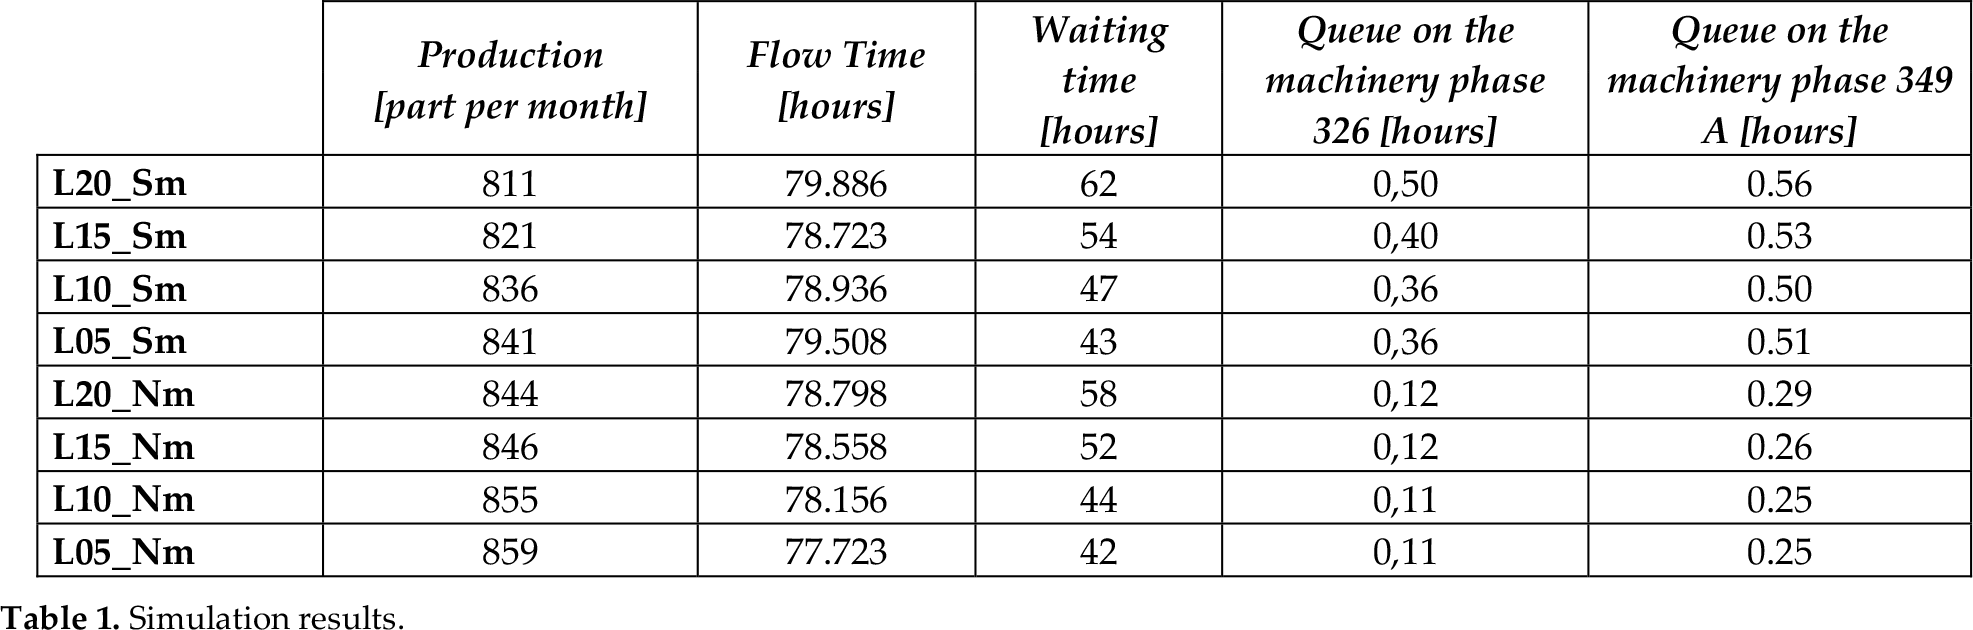
The better solution that emerges is L05_Nm: the reduction of the lot and the introduction of new machinery. The results were as follows:
A decrease in flow time of 2.71% An increase in productivity of 5.92% A decrease in waiting time of 32.26%
The implementation of this solution involves economic investments. In particular, the introduction of two new machines requires an increase in direct cost of about €80.000 per year and an increase in indirect cost of about €30.000 per year. It is worth noting that a valid alternative solution could be the simple reduction of the lot. As shown by the results obtained, a decrease in lot size from 20 to 5 units permits the following:
A decrease in flow time of 0.5% An increase in productivity of 3.7% A decrease in waiting time of 30.75%
To check the validity of such data, a DoE (Design of Experiment) analysis was carried out. The DoE analysis shows whether the results obtained are significant or not. In fact, the DoE is a test or series of tests in which the input variables of a process are deliberately changed in order to observe and identify the corresponding changes in the output responses.
Table 2 presents the main effects of the factors on the performance measures with a 95% confidence level. The final column (p Value) indicates whether or not the factor affects the performance measure. According to Table 2, the significant effects on the performance measured were on the Waiting Time of all configurations and the indices of configurations that had new types of machines and a low lot size (10 and 5), which had a p value of <0.05.
Design of Experiment results.

4. Discussion and conclusion
The procedure proposed in this study aims to create process targets so as to achieve the removal of bottlenecks, assessment of process variations, reduction of throughput time, an increase in the number of achievable processes and optimization of resource utilization.
Based on a discrete-event simulation model, by reproducing the operation of the sewing department of a manufacturing company, we have provided a quantitative assessment of the effects of different configurations on the flow time and production capacity observed in the division. Our analysis covers four possible configurations, resulting from the combination of different parameters, such as lot size and the use of new machinery in order to reduce bottlenecks. For each scenario, production capacity, flow time and waiting time were computed, starting from simulation outcomes. Moreover, a statistical analysis of effects was performed so as to identify the possible significant impact of single/combined parameters on the resulting production capacity.
The key results of this study show that both flow time and production capacity are affected by the independent variables examined, although to a different extent.
In particular, the decrease of lot size and the introduction of new machinery in the critical phases involved a substantial increase in the production capacity and a decrease in the flow time, and their impact is significant at p<0.05. Even the simple reduction of lot size had interesting results.
These results can be justified using lean production theory. In fact, by modifying the batch size from 20 to 5, we move from process batch to transfer batch. A process batch is the product quantity processed at a work centre before that work centre is reset to produce a different product. A transfer batch is the quantity of units that moves from one work centre to the next. Previously, the company has operated using large batch sizes in order to maximize machine utilization, assuming that changeover times were fixed and could not be reduced. Because lean production theory calls for the production of parts according to customer demand, the ideal batch size is one. However, a batch size of one is not always practical, so the goal is to practise continuous improvement so as to reduce the batch size as much as possible. Reducing batch sizes decreases the amount of work-in-process inventory (WIP). Not only does this reduce inventory-carrying costs, but also production lead-time or cycle time is approximately directly proportional to the amount of WIP. Therefore, smaller batch sizes shorten the overall production cycle and as such, enable companies to deliver more quickly and to invoice sooner (for improved cash flow). Shorter production cycles increase inventory turns, allow the company to operate profitably at lower margins and enable price reductions; consequently, they increase sales and the market share.
As the simulation model was developed using average data of the manufacturing industry specialized in creating men's clothes, our results can be useful in practice in identifying the optimal lay-out configuration as a function of the operating conditions. Moreover, the outcomes of this study provide several insights concerning the production components and their trends, depending on the configuration considered.
In addition, our study shows that the simulation allowed the company to evaluate possible or future scenarios. In this context, the choice of performance indicators is very important: the definition of the objectives to be achieved coincides with the choice of indexes to be monitored.
Our study is based on the simulation of a single-product flow. In order to obtain more general results, it would be appropriate to extend the model to include: (1) the flow of different products, with different characteristics and (2) a sensitivity analysis of model outcomes as a function of different values of the input parameters.