
Abstract
In this study, the comparative role of nano-and micro-sized Cu powder in exploring the influence on the tribo-performance of friction materials in the form of brake-pads is discussed. Two friction composites were developed by keeping allthe ingredients constant and varying the size of the selected filler (copper powder). The developed micro-composite contained 10 % (wt) Cu (400–600 μm) while in the nano-composite only a part (2 %) of the micro-powder was replaced by a nano-powder (50–200 nm) since 10 % replacement was not possible because of the agglomeration problem. One more composite without any metallic filler was also developed for the sake of comparison. For tribo-evaluation, the brake-dynamometer testing was selected. The performance properties, such as friction, wear and sensitivity of friction towards load, speed and temperature were studied as per industrial practice. It was concluded that the inclusion of nano-Cu powder (just 2 %) improved the performance properties significantly. Micro-composite was a moderate performer while composite without Cu powder proved the poorest. The quality of a tribo-layer transferred to the disc as studied in SEM was confirmed to be one of the reasons for the improved performance of the nano-composite.
1. Introduction
Non-asbestos organic (NAO) friction materials (FMs) are widely used in automobiles and locomotives as brake pads, brake shoes, brake linings, clutch facings and brake blocks. The performance requirements of FMs are very complex and conflicting [1]. These multi-ingredient composites containing the right combination of ingredients in the right proportion are manufactured with the right technology to achieve the desired amalgam of performance properties [1–3]. Amongst the ingredients are metallic fillers such as copper, brass, iron etc., which are very important in FMs and are added in various shapes, sizes, amounts and combinations basically to improve the thermo-physical properties. These metallic fillers, however, influence the overall friction and wear properties of FM [4–14]. In our previous studies, the influence of different metallic fillers with different contents and shapes was discussed and it was concluded that copper powder (micron-sized) has special advantages due to its highest thermal conductivity (TC) [8–10]. Cu has three roles, viz. improving thermal conductivity, providing primary contact sites and improving sliding performance under severe braking conditions [10,14]. Thus, keeping this in mind it was of interest to explore the potential of Cu powder (nano-sized) in FMs.
Since the last decade, the area of nano-composites (NCs) has been the most explored research area because of the multi-fold potential of such fillers as performance improvers. Nano-particles (NPs) have a very high surface area to volume ratio and hence provide a very large interfacial surface area, as a driving force for enhanced interaction with other surfaces such as a matrix, counterface etc. [15]. A very low content (generally < 2–3 wt %) provides an exceptional increase in mechanical strength asides from its thermal, electrical and biological properties. Consequently, in recent years, the potential of polymeric NCs has been explored for tribological applications [16–25]. However, studies were more focused on anti-friction applications [16–22] rather than FMs [23–25]. Qiao et al. [23] reported on the positive effect (improvement in friction and wear performance) of NPs of styrene butadiene rubber for manufacturing clutch facings, disc brake pads and brake linings as compared to the micron-sized particles. Jang et al. [24] reported that the physical and tribological properties (improved fade resistance and friction stability) were influenced considerably by the inclusion of carbon nano tubes (CNTs). In a recent work in the authors' laboratory [25] while reporting on the influence of micronized and nano-sized abrasives (viz. alumina, silica and SiC; each at 2 %) in NAO FMs, a significantly superior friction and wear behaviour of nano-composites was found and was claimed to be due to the superior quality of the tribo-layer on the counterface. Interestingly, hardly any papers are available which report on the effect of other NPs, especially of metallic NPs, in the FMs. Oesterle et al. [14] stated that the inclusion of Cu in FM is appreciated not only for its high TC and its capability to provide primary contact sites, but also as a soft metal providing smooth sliding and reducing the propensity for noise generation at higher temperatures. Furthermore, they hypothesized that the Cu particles in FMs play a dual role. Apart from reinforcing the FM by providing primary contact sites, they also act as a solid lubricant by contributing to the formation of a tribo-layer of granular material responsible for velocity accommodation between the disc and pad. However, there was no experimental evidence for the claim that recrystallized NPs of Cu enter into friction layers as a soft ingredient once they are detached from the pad surface, although initially they were incorporated in micron size. This hypothesis was confirmed by modelling contact sites on the nanometre scale using the movable cellular automata method. This might be understood best if it was assumed that the soft Cu NPs are incorporated in the tribo-layer [26].
The above hypothesis and simulation studies were the motivating factors for this study of the influence of nano Cu in FMs by developing brake-pads. In the present study, three NAO friction composites were developed in order to understand the effects of nano copper powder on the performance properties. A composite without Cu was considered as a reference composite, while the other two composites were developed with micron-sized and a combination of nano and micron-sized Cu powders. Tribological evaluation was performed on a full scale inertia dynamometer for various performance properties and is discussed in the subsequent sections.
2. Experimental
2.1 Details of Cu powder
Micron-sized copper powder was procured from a local vendor (M/s Kandoi Metal, Jaipur, India), while nano copper powder was procured from Nanostructured & Amorphous Materials, Inc USA. (Purity: 99.8%; APS: 78 nm; SSA: 8.46 m2/g; Colour: black; Morphology: spherical; Density: 8.94 g/cm3). The details of the particle size studied by FESEM are shown in Figure 1.

FESEM micrographs of selected copper powders; (a,b) coarse micron-sized, (c,d) nano-sized
2.2 Fabrication of the composites
Three composites were developed containing 12 ingredients of identical types and the parent composition of 11 ingredients (90 % by wt.) was kept constant. The remaining two fillers viz. Cu powder and barite were changed as per Table 1. The micro-composite contained 10 % Cu powder of micron size while the nano-composite contained a combination of micro-sized (8 %) and nano-sized Cu powder (2 %). A composite with 10 % nano-Cu powder was not possible because of the agglomeration problem [22] 1 . For the sake of comparison, a third composite was also developed without Cu powder by replacing this 10 % amount with an inert filler barite.
Design and designations of composites
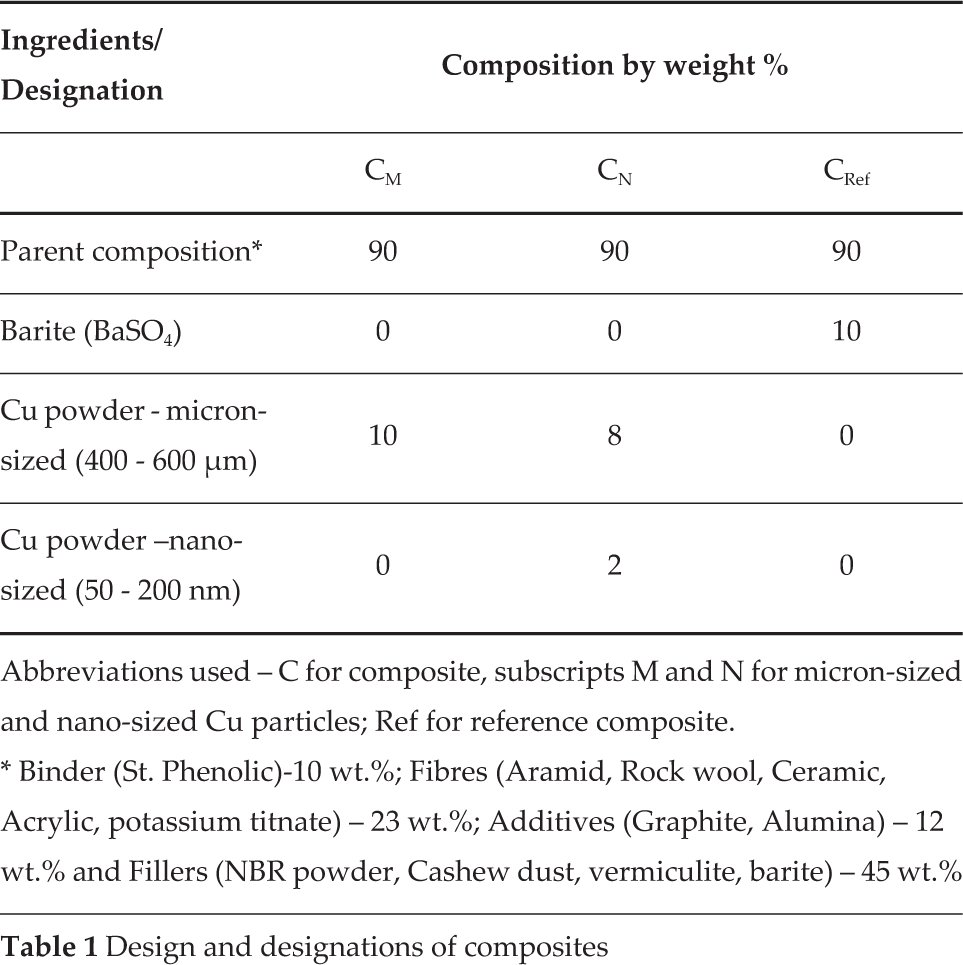
Abbreviations used – C for composite, subscripts M and N for micron-sized and nano-sized Cu particles; Ref for reference composite.
Binder (St. Phenolic)–10 wt.%; Fibres (Aramid, Rock wool, Ceramic, Acrylic, potassium titnate) – 23 wt.%; Additives (Graphite, Alumina) – 12 wt.% and Fillers (NBR powder, Cashew dust, vermiculite, barite) – 45 wt.%
The desired quantity of nano powder (2 % of total mixture) was dispersed thoroughly in petroleum ether (40–60°C) using a probe sonicator for 10 minutes followed by phenolic powder which was added slowly. The mixture was further sonicated for 10 minutes. The resulting paste was poured onto aluminium foil to dry in the open air. This dried mixture, along with other ingredients, was placed in an industrial mixer for homogeneous dispersion as per standard procedure [8] to ensure macroscopic homogeneity using a chopper speed of 2800 rpm and a feeder speed of 1450 rpm. The composites were developed as per the method reported elsewhere [8–10]. The mixture was then placed into a four-cavity mould supported by adhesive-coated back plates. Each cavity was filled with approximately 80 g of the mixture and was then cured in a compression-moulding machine under a pressure of 8 MPa for 7–8 minutes at 150°C. Five intermittent ‘breathings’ were carried out during the curing process to expel the volatiles. The pads were then post-cured in an oven at 150° C for four hours. The surfaces of the pads were then polished with a grinding wheel to attain the desired thickness (14–16 mm) and surface finish.
2.3 Characterization of the composites
The composites were characterized by their physical and chemical (density, porosity and acetone extraction), thermo-physical (thermal conductivity, diffusivity, specific heat etc.) and mechanical (hardness) properties as per standard practice. The thermo-physical properties were measured as per ASTM-E1461-01 standard on an FL-3000 Flash line instrument supplied by Anter Corporation, USA. Square-sized samples (10 mm × 10 mm) with a thickness of 2 to 2.5 mm were used for these measurements at room temperature and the results are collected in Table 2. Worn surface studies were carried out on a Zeiss scanning electron microscope (model-EVO 10M) after the gold coating.
Physical, thermo-physical and mechanical properties of the composites

2.4 Tribological evaluation
A full scale inertia brake dynamometer (Dyno) was used to examine the friction and wear properties of developed composites. The schematic diagram and more details of Dyno are discussed elsewhere [9]. Lab view based software (version 4.0) was provided to calculate the desired output parameters. In this work, Japanese Automobile Standard (JASO C 406) was used for testing [9] which is the norm for performance evaluation in Asian countries. For this study, the two major and most important sections viz. effectiveness-II and fade and recovery-I of a complete schedule were followed instead of a complete schedule to avoid complexity and reduce the amount of time involved in the full testing.
Prior to performance evaluation testing, each pair of pads was subjected to 100 brakings to establish at least 80% conformal contact with the disc. The disc was then replaced with a new one. Each composite test was repeated twice on an unused tribo-couple and the average value of these two tests was reported. Table 3 is comprised of the experimental design (operating parameters) of testing.

The second segment viz. Effectiveness-II was done at three different braking speeds viz., 50,80 and 100 kmph. The tests were conducted under eight different decelerations (O.1g to 0.8g). The deceleration is varied by increasing the pressure. With an increase in deceleration, the severity of the braking increases and the stopping distance is reduced to a set value. At each deceleration (g value) one brake was applied. Eight brake applications were applied at each speed while a total of 24 brake applications were applied in this part of the effectiveness studies. Prior to each brake application a temperature of 80 °C was set.
In the last and third segment, called Fade and Recovery-I, the first 10 brake applications consisted of a fade cycle and the last 12 brake applications were for the recovery cycle. The fade cycle starts with an initial speed of 80 kmph, a deceleration of 0.45 and an initial temperature of 80 °C. In the fade cycle, the temperature of the disc was allowed to rise uninterruptedly in order to observe the influence of temperature (by keeping the air blower switched off) while the recovery cycle started with an initial speed of 50 kmph and a deceleration of 0.30. The air blower was switched on during this test and the initial temperature of the disc prior to each brake was kept under 80 °C.
3. Results and Discussion
3.1 Physical, thermo-physical and mechanical properties
As seen from Table 2, some properties, such as density, TC, diffusivity and hardness, increased due to the inclusion of the copper powder. These were highest for the CN, followed by CM and then Cref, while the porosity and acetone extraction values went in the inverse order. The TC of these composites was in the range of 1.67–2.22 Wm−1K−1, similar to the values reported in the literature for friction composites [27]. The values of TC were in a inverse relation to the density, as expected. It is well accepted that denser materials have better packing and hence a higher TC. NPs have a significantly larger surface/volume ratio as compared to their micro counterpart, leading to a more intense interaction/adhesion with the resin. This finally facilitates the formation of a thermally conducting pathway in the composite which results in the increase in TC. The acetone extraction values indicate the amount of uncured resin, which should be as low as possible. CRef, which did not contain any metal powder, showed the highest amount of uncured resin followed by CM and CN. The hardness followed the exact opposite trend, confirming that curing leads to more hardness.
3.2 Tribological properties of composites
3.2.1 Effectiveness studies (Pressure-speed sensitivity)
Effectiveness studies are concerned with the influence of the operating parameters (pressure and speed) mainly on the coefficient of friction (μ) of FM. μ is the ratio of the frictional force generated to the applied load with which it is pressed against its counterpart. The changes in μ as a function of sliding speed and applied pressure are a very important issue during braking in automobiles [28, 29] as well as in aircrafts [30]. Changes in μ should be minimal since the driver expects the same level of friction under diverse braking conditions.
Effect on friction behaviour
As seen in Figure 2, the μ of the composites was in the range of 0.30 to 0.45 which is in the acceptable range for brake-pads [1]. It is a well-accepted fact that Amonton's law does not hold true for polymers and composites and μ is not constant with variations in pressure and speed. With increases in pressure and speed, μ decreased for all the composites, which again also conform to trends identified in the literature [28, 29]. With the increase in pressure, it decreases (referred to as a pressure-fade), though not always linearly [31,32]. However, with speed this relationship is more complex as μ generally does not show fixed trends with increases in speed [28, 29]. In the present case, μ decreased with an increase in speed which is mostly observed since an increase in speed leads to the generation of more frictional heat which, however, is responsible for a reduction in μ. The variation in speed leads to a thermo-mechanical overloading on the asperities. The shear film disruption results in the surface underneath being exposed and the friction changing accordingly [33–35].

Variation in μ with an increase in deceleration at (a) 50 kmph, (b) 80 kmph and (c) 100 kmph
Pressure sensitivity
The variation in μ with an increase in deceleration (g) at each constant speed reflects the μ sensitivity towards the pressure of FMs and is shown in Figure 2. For an ideal friction composite the line should be parallel to the X-axis or the slope of the curve and undulations in the curve should be minimal. However, μ generally decreases with an increase in (g). The decline was lowest (desirable) for CN. At the lowest speed (50 kmph), CN showed a slightly higher μ (0.42–0.40) while μ for the other two composites was lower than the CN and they were almost similar to each other. As the conditions became severe (80 kmph), CRef showed the poorest behaviour since it showed maximum decline which is considered as an unwanted phenomenon, followed by CM, whereas the nano-composite showed the best behaviour. It should be noted that CN performed better than CM at each speed. Higher μ is not the performance criteria. Stable μ is the ideal requirement. As observed in Figure 2b, CN showed the least fluctuations and the lowest slope, though μ was not the highest as seen in Figure 2c. CN showed the least fluctuations and the lowest slope, though μ was not the highest. Under the most severe conditions (100 kmph), the performance of CRef deteriorated excessively confirming that metallic contents are very much required for the desired friction properties. The performance of CN improved further confirming that the replacement of just 2 % of the coarse Cu powder with nano powder improved the friction behaviour significantly. The greater the severity in the braking conditions, the better the performance offered by CN was. Thus, of among all the composites, CN proved the best from the pressure sensitivity point of view. One of the reasons for this could be the ability of nano-powder to form a very fine uniform friction film on both the rubbing surfaces. This frictional film kept the μ at a constant level. CRef performed the poorest which could be attributed to the appreciable difference in TC of the composites (Table 2). High TC is responsible for carrying away the frictional heat generated at the interface very efficiently and hence the extent of the thermal degradation of the organic material is reduced. This leads to the integrity of the FM being maintained as well as the surface properties and hence μ also varies effectively [9].
One interesting fact as observed from Figure 2 is the correlation between the magnitude of μ, speed and the size of the Cu powder. At the lowest speed μ was higher for CN than CM while for the other two speeds it was the opposite. As per the literature [14] under severe operating conditions Cu acts as a solid lubricant when it enters into a tribo-layer on the disc. The extraction of nano-particles from the composite is comparatively difficult since their adhesion with the matrix is better compared to microparticles [15,16]. Hence at lower speeds, CN showed higher μ since its tribo-layer was not very rich with Cu particles. Hence its performance (slope of curve) was slightly inferior to that of CM. However, for further increases in speed, the tribo-layer on the disc must be more coherent and rich in Cu contents, which leads to more stable μ, rather than higher μ. NPs, being of extremely small size, are known to percolate in the asperities on the counterface and hence form a very good, thin and coherent film [36]. The evidence for this is presented in the SEM section.
Speed sensitivity
Speed sensitivity is defined as a variation in speed spread (SS) with respect to deceleration (g) and Figure 3 shows the performance of the composites from the speed sensitivity point of view. The % SS is the stability in μ when the speed changes from the first to the second level (i.e. from 80 to 50 kmph and this corresponds to mild conditions). While from the first to the third level (100 to 50 kmph) corresponds to a severe condition. For an ideal material, SS should be high (in the range of 85–100 %) and the slope of the curve should be as minimal as possible. As seen from Figure 3, Cref proved the poorest in both these aspects. CM, however always showed higher SS than CN which is appreciable indicating that coarse Cu powder is more suitable for attaining a lower sensitivity to speed. CN, however, was rated excellent based on other criteria. Under both conditions, it showed a very steady value.

Variation in speed spread with increase in deceleration at (a) mild conditions (transition from 80 to 50 kmph) and (b) severe conditions (transition from 100 to 50 kmph)
3.2.2 Fade and recovery (F & R) behaviour
F & R behaviour highlight the effect of temperature on the μ. A loss of effectiveness in braking as a result of an excessive increase in temperature of the tribo-surface is known as fade. On the other hand, recovery is the ability of an FMs to regain the pre-fade normal brake-effectiveness after the temperature comes down [28]. Figure 4 shows the F & R behaviour of the composites. For an ideal composite, the rise in disc temperature should be minimal, μ should be stable and in the required range depending on the vehicle selected (0.30–0.45) and the fade curve (μ vs. number of applications) should have a minimal slope. In the case of the recovery mode, the curve should be flat with a low slope and μ should be in the range of the pre fade value.
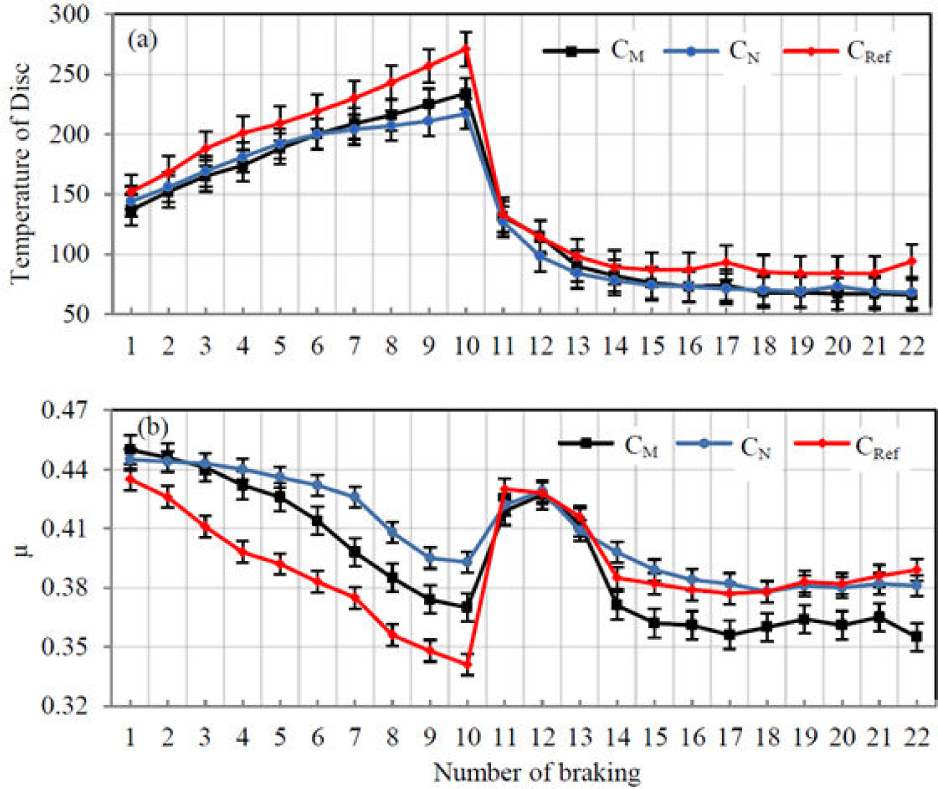
Fade and recovery behaviour of the composites; (a) disc temperature as a function of the number of brakings; (b) μ as a function of the number of brakings
There are two separate testing cycles included in the testing. Up to 10 cycles (fade cycle) the air blower is off & hence the temperature of the disc keeps on increasing to a peak value with a simultaneous decrease in μ due to the fading. For the 10th braking μ is the lowest since the disc temperature is at its highest. During the second cycle (recovery cycle), first the temperature of the disc is allowed to decrease with the help of a blower. The 11th braking starts only when the temperature is around 80 degrees C and the blower is continuously on to control the rise in temperature. Hence the faded μ recovers (increases) showing peaking for almost 3 brakings. Later on it decreases slightly because of repetitive brakings.
Essence of the fade and recovery studies
The F & R characteristics of the composites are collected in Table 4. These were calculated as per the standard pattern of the JASO C406 schedule. The following inferences were drawn from Table 4.
Fade and recovery responses of the composites as per the JASO schedule

Resistance to fade (% fade ratio): performance order-higher the better
This is one of the most important parameters which measures the deterioration in μ when the operating conditions are more demanding. This fade behaviour was due to the increase in the surface temperature as the test was conducted at a constant pressure and speed. Generally, a fade % ratio in the range of 75 to 100 is acceptable as per industry norms. The % fade ratio and hence performance was in the following order for the composites;

As we know, fade is caused by the thermal decomposition of ingredients due to the accumulation of frictional heat on the surface. A higher TC of CN perhaps was responsible for it having the best performance.
The recovery behaviour (% recovery ratio): performance order-higher the better
Composites which recover their friction level considerably after fade cycles are considered as good FMs. In general, the acceptable levels should be in the range of 75–100%. The recovery % of the selected composites was as follows, confirming that CN performed best.

Counterface friendliness performance:
One of the criteria for deciding counterface-friendliness is the rise in the disc temperature during fade cycles. The lower the rise, the greater the friendliness. The performance of the composites was in the following order;

CN proved best in this aspect and was also followed by the CM. However, CRef proved to be the poorest showing the highest disc temperature. The TC of the composites proved to be the influencing factor for controlling the performance because it conducted away the frictional heat generated at the interface very efficiently and finally led to a lower temperature rise in the disc.
3.3 Studies on wear behaviour and worn surfaces
3.3.1 Wear behaviour of the composites
A weight loss method was used to measure the wear of the composites after completing the effectiveness, fade and recovery studies. The wear volume was calculated by using the density data of the composites. Figure 5 shows the wear performance of the composites. Lower the wear, the better the performance. The inclusion of nano Cu powder improved the wear performance significantly. CM showed moderate performance, while that of CRef was the poorest. The wear mechanisms of FMs are extremely complex since several interactions and mechanisms operate simultaneously during the material removal/gain process from both the surfaces. These dynamic processes depend on the composition of the contacting surfaces, including that of a third phase (tribo-layer), which in turn depends on the operating parameters, such as load, speed and especially interface temperature. As per the simulation results and the hypothesis in the literature [14], superficial layers of the Cu MPs are strengthened by severe plastic deformation leading to a nano-crystalline micro structure.
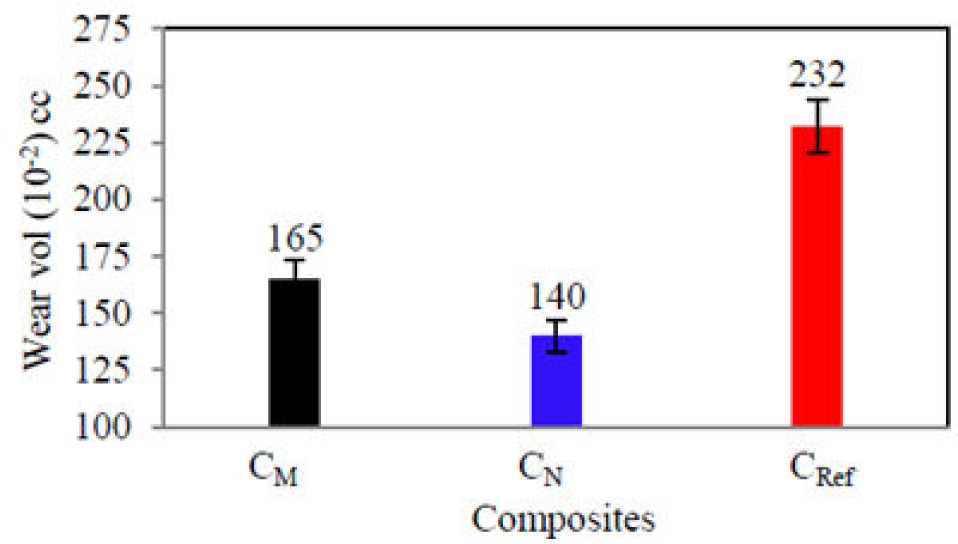
Wear volume of the composites
These nanocrystals at the surface recrystallize at elevated temperatures and form soft inclusions in the friction layer. Although these are harder than graphite at ambient temperature, the presence of particles of soft Cu in a friction layer provides a solid lubricating effect similar to that of graphite inclusions. It leads to the stabilization of a smooth sliding mode by forming a granular layer of mechanically mixed materials from the friction layers and the layer formation causes a reduction in both μ and the amplitude of fluctuations. Thus, in our work an improvement in tribo-performance properties due to the inclusion of Cu as per the above hypothesis was observed and the studies on worn surfaces of the composites, as discussed in the subsequent section, were performed to support these trends.
3.3.2 Worn surface analysis by SEM
The SEM micrographs of the worn surfaces of the composites are arranged as per their decreasing wear resistance (WR) in Figures 6 to 8. The main features are described in the captions.

SEM micrographs of the worn surface of composite CN (highest WR); General features-Smooth topography, hardly any damage to the surface, least amount of primary plateaus; surface apparently covered with continuous thin film possibly rich with Cu; an ideal worn surface, (a) Very good adhesion of ingredients with the matrix and molten thin transferred layer, few primary plateaus; (b) almost similar features, surface apparently covered with continuous thin film. Overall-highest WR perfectly correlated with very smooth topography and least damage to the surface.

SEM micrographs of composite CM-II highest WR; General features-Quite smooth topography, fairly continuous thin film possibly rich with Cu (not as good as in the earlier case), some amount of secondary and primary plateaus; (a) quite good adhesion of ingredients with the matrix and transferred layer, hardly any thick primary plateaus; (b) little thicker patches of back transferred layer. Over ail-moderately high WR-perfectly correlated with moderately damaged surface.

SEM micrographs of CRef-poorest WR; general features-(a) very heterogeneous surface, large damage, large amount of wear debris, heavy back-transfer of material from the tribo-layer on the disc, heavy transfer of fine wear debris looking like porous surface leading to more wear in successive braking, (b) Extremely heterogeneous surface with very rough topography, loosely placed debris confirming extremely poor quality of the surface with thick cracks
The smooth surface topography of CN, showing lowest damage and almost covered with fine film possibly rich in Cu was thought to be responsible for its having the highest WR. On the other hand, the largely damaged surface, secondary plateaus, large amount of debris etc. supported the idea that CRef had the poorest wear behaviour.
It was of interest to examine if there was a substantial difference in the disc topography while wearing against selected composites. The worn disc surfaces are shown in Figure 9.
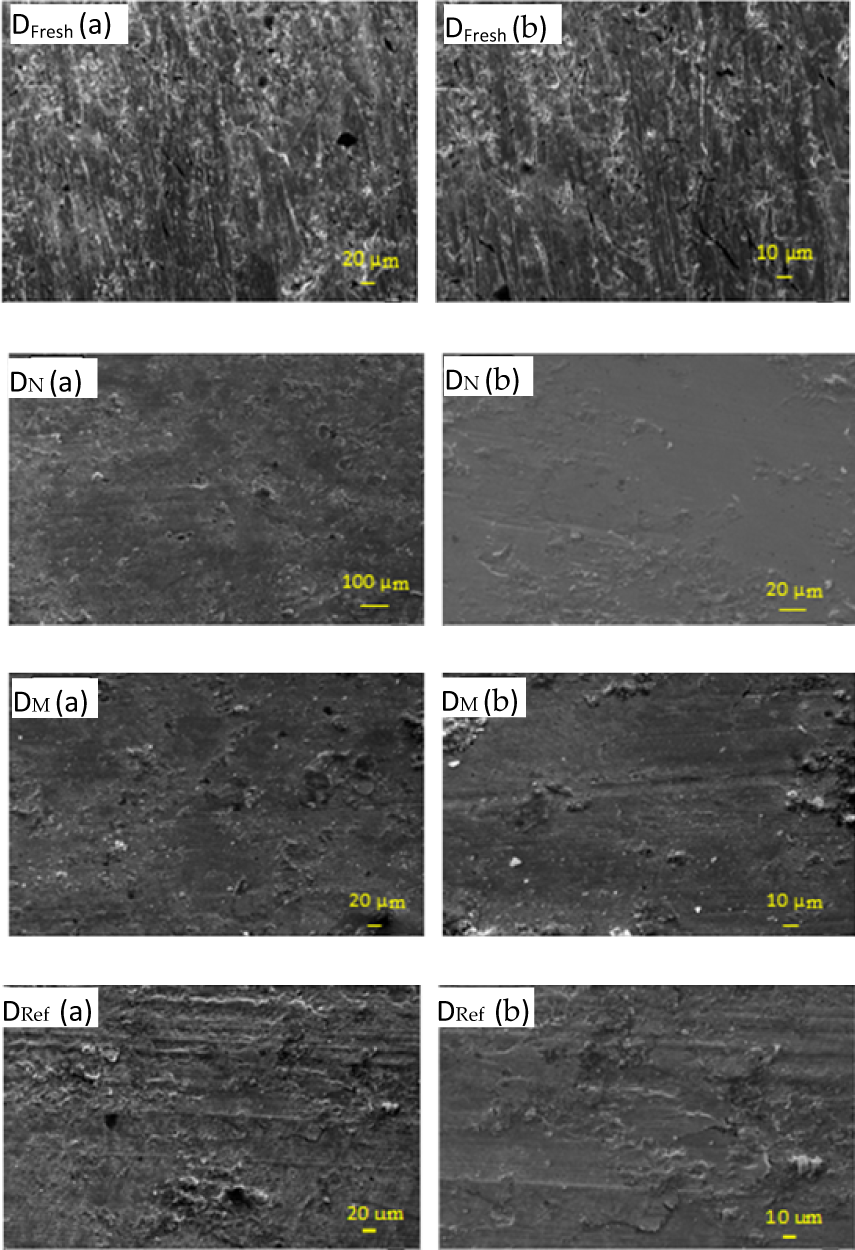
SEM micrographs of the disc surfaces arranged in order of decreasing WR of the composites; (DFresh a and b) fresh disc surface, graphite flakes also appearing in a magnified view; (DN a and b) disc worn against CN showing very fine and thin uniform friction layer due to organic material and combination of micron-sized (8%) and nano-sized-copper (2%); (DM a and b) disc worn against CM; almost similar but slightly inferior type of uniform friction film mainly due to the combination of organic material and copper; (DRef a and b) disc worn against CRef composite; A thick layer of molten organic material and debris transferred from the pad.
A surface of a fresh disc was also included for comparison's sake. Overall, it was observed that the quality of the friction layer on the surface definitely depended on the composite against which it was slid. A composite containing a small amount of nano Cu led to a smoother and more coherent layer of transferred material, while the one against the Cref (which showed the highest wear) was very rough and patchy, confirming the heavy transfer of material from the pad. The disc surface against the CM was slightly less smooth and non-uniform compared to the one against CN.
4. Conclusions
Based on the experimental studies conducted on the role of nano-sized Cu powder in NAO friction composites for evaluating the effectiveness, fade and recovery behaviour on brake inertia dynamometer, the following conclusions were drawn;
All composites showed adequate μ (0.35 to 0.45) which decreased with pressure and speed.
The inclusion of a small amount of nano Cu powder (2 %) in FM affected most of the performance properties in a beneficial way. Most of the properties, such as density, hardness, thermal conductivity and thermal diffusivity etc. increased due to the nano Cu powder.
During the evaluation of wear resistance and the sensitivity of friction for pressure, speed and temperature, the inclusion of 10 % Cu powder proved very helpful for improving all the performance properties. The replacement of 2 % of the coarse powder with an equal amount of nano powder proved significantly beneficial in improving the performance properties further.
The thermal conductivity of the composites played an important role in the enhancement of the performance properties of the composites (fade resistance, recovery performance and counterface friendliness)
The worn surface topography of the pad and the disc could be correlated with wear resistance and a thin uniform and coherent film on the counterface was found to be responsible for enhancing the performance due to the nano Cu powder.
Finally, it was concluded that the inclusion of nanoparticles (Cu in this case) in very small amounts (2 %) can be beneficial for improving all performance parameters significantly. This has the potential for further exploration in its application to industrial friction materials.
Footnotes
1
It is well reported that agglomeration is considered as a general problem of NCs, especially for higher contents and if the optimum content is in the range of 2- 4%. In general, beyond 2 % loading, either the performance of the NCs levels off or shows deterioration [![]() ]. While preparing NCs, the first step is to de-agglomerate the NCs in the right liquid medium using probe sonication which consumes significant amounts of energy. This de-agglomeration becomes extremely difficult if the loading is high, generally beyond 2 %. We selected 10 % Cu contents in all the composites. The replacement of all the 10 % of microparticles with NPs was not practically possible because of these facts. Hence, we had to replace only 2 % which is the most logical solution based on the above discussion.
]. While preparing NCs, the first step is to de-agglomerate the NCs in the right liquid medium using probe sonication which consumes significant amounts of energy. This de-agglomeration becomes extremely difficult if the loading is high, generally beyond 2 %. We selected 10 % Cu contents in all the composites. The replacement of all the 10 % of microparticles with NPs was not practically possible because of these facts. Hence, we had to replace only 2 % which is the most logical solution based on the above discussion.