
Abstract
The success of a New Product Development (NPD) process strongly depends on the deep comprehension of market needs and Analytic Hierarchy Process (AHP) has been commonly used to find weights for customers' preferences. AHP best practices suggest that low-consistency respondents should be considered untrustworthy; however, in some NPD cases – such as the one presented here – this stake can be extremely big. This paper deals with the usage of AHP methodology to define the weights of customer needs connected to the NPD process of a typical impulse buying good, a snack. The aim of the paper is to analyse in a critical way the opportunity to exclude or include non-consistent respondents in market analysis, addressing the following question: should a non-consistent potential customer be excluded from the analysis due to his inconsistency or should he be included because, after all, he is still a potential consumer? The chosen methodological approach focuses on evaluating the compatibility of weight vectors among different subsets of respondents, filtered according to their consistency level. Results surprisingly show that weights do not significantly change when non-consistent respondents are excluded.
Keywords
1. Introduction
More than 89% of manufacturing companies believe that launching new products on the market is the principal driver of future growth [1] [2] [3] [4] [5] [6]. Innovation can be divided into three main processes: project planning, new product development (NPD) and commercialization. The NPD process is one of the most complex within an organization, it embraces the sequence of activities that a company performs to conceive, design and sell a product. This process usually consists of the following steps: identification of customer needs, definition of product specifications, concept generation, concept selection, concept testing, setting of final specifications, project planning, economic analysis, benchmarking of competitor's products, modelling and prototyping. Success for companies proposing new products on the market depends on the deep comprehension of customer needs, preferences and tastes. Anticipating the changes required in existing products represents a crucial aspect for the success, or failure, of new offered products [7]. Thus, both the target market and target customers need to be clearly identified, in order to increase the possibility of successful outcomes [8] [9] [10] [11].
Companies try to better understand customer needs using different methodologies: marketing information systems [12], decision-based design methods [13] (such as quality function deployment [14] [15] [16] [17], the Analytic Hierarchy (AHP) or Network (ANP) Processes [18] [19] [20] [21]), Suh's axiomatic methods [22] or multicriteria analysis [23]. In particular, it arises from the NPD literature that AHP has been commonly used in industry to assist enterprises in the product development phase [24].
Insights into customers' needs typically come from brainstorming sessions, or from unstructured interviews with potential customers, lead users [25] and focus groups. Once out, these needs have to be considered in accordance with their level of importance, thus they have to be weighted. To this aim, AHP seems very helpful, turning “the consumers' voice” into numerical weights – by means of specific questionnaires where respondents are asked to pairwise compare customers [19]. Then, a short computational procedure returns a vector that represents the relative importance of the consumers' needs, in relation to the new product.
Consistently with NPD literature, people tend to express their personal preferences in many different ways, numerically or linguistically, depending on their cultural background or aptitude; however, it often happens that potential customers are not able to precisely tell what their needs are [26] [27]. Conversely, the pairwise comparison approach used in the AHP procedure requires a strict rational approach. Then, a Consistency Index (CI) is computed for each respondent, so as to measure the degree of coherence of the answers in the pairwise comparisons. The AHP best practices [28] suggest that low-consistency respondents should be excluded from the analysis or, at least, assigned a low weight. However, in some NPD cases – such as the one presented here – this part can be extremely big and, despite their incoherence in formalizing their needs, this significant sample of potential customers may be willing to purchase the product anyway, once developed and distributed, if it fits their preferences. Is it, therefore, appropriate to exclude these potential customers from the analysis of market needs?
This paper deals with the usage of AHP methodology in order to find appropriate weights for customer needs, related to the NPD process of a typical impulse buying good; a snack. The aim of the paper is not to show outcome values for primary needs, computed by means of AHP; it is rather to analyse, in a critical way, the opportunity of excluding or including non-consistent respondents in market analyses.
2. The AHP and its contribution in NPD projects
Prior research has emphasized the importance of the Analytic Hierarchy Process and of the Analytic Network Process in new product development, i.e. [29] [30] [7] [31] [32]. In fact, this methodology can be of paramount importance in helping to determine the main features or meanings that the products will assume once released to consumer markets – putting in evidence which characteristics the final user is looking for and their priority. AHP, indeed, allows decision-making elements to be prioritized according to a preference structure that is often neither clearly stated, nor even conscious for the decision maker. Consumers express their preferences by means of pairwise comparisons between criteria that will influence their purchasing choice. This is a kind of approach that performs best when dealing with criteria that cannot be objectively compared, using a widely accepted measure scale – so, as an example, every time emotional or symbolic contents of products are taken into account.
To be clearer, the authors elaborate on the process of new product development. In this process a pool of multiple criteria can influence decisions and outcomes from each criteria can diverge – or be in contrast with one another, or be too many, or not even properly understood – so as to make the process itself difficult to manage. To face such a scenario, a clever choice is to split the whole into sub-systems, which are easier to analyse, without losing trace of multiple relations. Thanks to AHP, evaluators can build a breakdown structure moving from a source node – representative of the main problem – to smaller and less complex components; by repeatedly decomposing one finally comes to the identification of the key variables that are the elementary drivers, which affect consumers' choices. It is worth noting that, when a criterion is split into a certain number of sub-criteria it becomes the source node of a cluster in which all the elements – the sub-criteria, precisely – are homogeneous among them, being different specifications of the same facet of the problem [33].
The breakdown structure can be used to determine how much a single decisional element – in NPD a driver for consumers' choice – should be considered relevant in solving the main complex problem: so, a value is assigned to every element and it represents the element priority in the decision process. To determine all the priorities, AHP requires the decision maker – the consumers, in the case of NPD – to express his personal judgment on how much an element is important with respect to the others, by means of pairwise comparisons. Not all the elements can be compared: in fact, the homogeneity condition has to be respected. This means that comparisons among elements must not cross the boundaries of each single cluster. Therefore, only elements having a dependence from the same source node can be compared. Pairwise comparisons can be expressed either in natural language, or using a nine-point scale [19], which allows natural language judgments to be turned into values. The semantic scale is shown in Table 1.
Saaty's AHP semantic scale

Results of the survey

Respondent classification

To give an example, if the judgment is equal to one, the decision maker believes that the two elements that are compared should have the same priority in the decision making process. On the other hand, if the judgment is equal to five the first element should be considered much more important than the second. This approach allows decisional elements to be compared even when they are not objectively measurable or evaluators do not have a measuring instrument.
The decision maker's judgments on relative priorities are summed up in the pairwise comparison matrix, an n by n matrix where rows and columns represent the decision making elements to be compared. In the i-th row and j-th column the relative judgment is expressed by means of Saaty's scale. The matrix can be thought of as an adjacency matrix of a graph, in which arcs represent the priority network and their values represent the influence between two elements. An element will be as important for the decision making process as it impacts on a higher number of decisional elements and as its impact on other elements increases, not only on direct arcs, but also considering indirect influences over all the possible paths in the graph. It can be proved that the pairwise comparison matrix has a principal eigenvalue, whose eigenvector can be used to represent local priorities for decisional elements within a cluster. In AHP, global priorities are obtained by simply combining local priorities in a bottom-up approach. Therefore, starting from all the pairwise comparison matrices it is possible to determine the importance that each element assumes for the solution of the problem.
In NPD the first step in the process is to define customers' needs. To this aim, AHP can be used to allow potential customers to express their judgments on the importance that each criterion has in their purchasing choice, so as to understand which of them will foster or inhibit the new product prosperity.
As priorities affect final choices, it is necessary to collect reliable judgments from the interviewees; when making comparisons based upon subjective judgments a measurement error is introduced. To keep it limited and acceptable, elements with different orders of magnitude must not be compared. In the same way, the number of comparisons should be kept limited. Nevertheless, when variables can be univocally measured, absolute values are obtained and pairwise comparisons are easy – deriving from a simple application of transitivity. On the other hand, when directly expressing a personal pairwise comparison, perfect transitivity is no longer guaranteed. As an example, one could state that object A is three times warmer than object B and that object B is twice as warm as object C, but at the same time state that object A is only five times warmer than object C. The error that would be introduced in this way is called inconsistency and it is higher and more frequent as the number of pairwise comparisons increases. The key is to put less than nine elements in each cluster [18]. Consistent with this view, the authors suggest isolating the most important criteria for each NPD project and developing the decision process focusing on a reasonable limited number of drivers affecting consumers' choices.
To have some inconsistency in judgments is however acceptable and also symptomatic of an opportunity to develop a better understanding of the problem [34] [35]. However, inconsistency should be kept at a low level; in order to measure it, the Consistency Index (CI) has to be considered. This index can be computed for each pairwise comparison matrix and expresses a distance from the optimal situation where all elements can be measured objectively and where transitivity is respected. Since inconsistency increases with a higher number of elements in clusters, the CI of the matrix is compared with the average inconsistency of matrices of the same order, in which judgments are completely random. This comparison is expressed by the Consistency Ratio (CR): When this ratio assumes a value lower than 0.1, judgments can be considered as sufficiently coherent to be used in the decision making process.
In many cases, a reasonably high number of data is extracted from the surveys presented to consumers; more often this data also results from the examination of different subgroups expressing their point of view. A composite group outcome can be obtained by taking the geometric mean of individual judgments [20]. When looking for a priority rank of product features a convergence among groups can be desirable, in order not to deal with conflicting judgments. This convergence can be assessed thanks to the compatibility (Comp) index, as defined by Saaty in [36]. This index is extremely useful because it allows comparison between vectors of judgments; the closer the vectors, the higher their compatibility [20]. Perfect compatibility is obtained when the index value is one. A 10% deviation from the optimal value is at the upper end of acceptability.
Once again, the authors strongly believe in the value of the AHP approach to be used in the processes of NPD. Too often top managers select new project characteristics under uncertain and risky conditions, with a lack of detailed information [37]. Griffin [38] shows that about 40% of firms do not use formal NPD processes and Cooper et al. [39] demonstrated that almost 40% of investigated firms use a subjective scoring approach in NPD projects. Nonetheless, despite the great potential of AHP in NPD, some technical problems must be addressed. Low consistency may arise in the interviews of a potential customer, expressing opinions on future products that may be much different from those actually used. In the following paragraph, the problem observed during an NPD project is described. The consistent questionnaires resulted to be so few that any data analysis would have been undermined by a low statistical significance. As a consequence, one should reflect if it is preferable to process only a few consistent interviews – following the most consolidated practice in AHP results analysis, but loosing statistical significance – or consider the entire population of respondents, which means taking into account the opinion of all the potential market, including those people who seem to be less confident with the product analysed. In other words, should a non-consistent potential customer be excluded from the analysis for his inconsistency or should he be included because, after all, he is still a potential consumer? This question is prominent if related to the development of an impulse buying good, that is in cases where customers typically decide to buy products without a rational comparison between their needs and the product features, instead just following their emotions [40].
3. The new product development project
3.1 The context
This section presents the case of a New Product Development (NPD) project carried out at the “Stoà” Institute of Management, a primary Italian Business School. During the NPD course, participants of the MBA program were divided into groups and assigned a new product development project by a preselected industrial company. The company was supposed to indicate a mission statement and the key business goals of the project – on top of possible technical specifications in terms of product processing constraints. Groups had typically 30-40 days to perform all the appropriate analyses: identify a preferred target market, carry out some first market surveys in forms of focus groups or key-users interviews, identify product related customers' needs, develop a set of suitable product concepts, prepare a price/cost model, test the market response, consider stakeholders' requirements/constraints, select and refine the final concept, define the product specifications and, finally, prepare a look-like or work-like prototype. The assigned NPD project was organized as a structured competition game; groups worked unconnected, without the possibility of exchanging knowledge or advice. At the end, a panel of experts composed by the MBA Faculty and a company representative were asked to judge and select the winner.
3.2 The case
In the 2011 edition of the MBA Program, one of the most important European companies working in the nuts and dried fruit production and commercialization industry was selected for the NPD course competition. The mission statement defined by the Company included the following specifications for the new product:
it should have be it should be mainly intended for young Italian consumers it should promote the nutritional advantages of nuts and dried fruit.
MBA participants were divided into two groups; both followed a structured methodological approach, starting from the identification of primary and secondary customers' needs [41]. After the first set of non-structured interviews with potential customers, both groups had reached a two-level needs hierarchy, with four nodes in the primary level and several different secondary nodes. Both groups exhibited the same primary needs, which were:
the new snack has a practical packaging the new snack has a balanced nutritive value the new snack has a good taste the new snack has a low price.
The methodological approach requires finding the weights for each customer need. This is very critical for primary needs, because differently weighting a primary need deeply influences the entire new product development process.
3.3 The results
Both groups were instructed to adopt a rigorous quantitative method in order to find these weights, i.e. the Analytical Hierarchy Process. Thus using an online survey tool, they set-up a questionnaire, which – on top of a brief description of the objective and of several other questions related to other aspects of the NPD process – included the six pairwise comparisons needed to find the weight of the four primary needs. The AHP approach was not used to determine the weights of the secondary needs due to their high number. Filling in the questionnaire took a maximum of 10 minutes, whereas including all the secondary needs would have required a two hour interview. However, the adoption of the AHP scheme to determine the primary needs' weights was chosen to carry a secondary result as well: each respondent could be associated with a consistency ratio indicator. This allowed the coherence of the respondent to be quantified and thus to more appropriately manage outliers. Considering that the target market indicated by the company was composed by young Italian consumers (20-35 years old), both groups broadcasted the online questionnaire through their Facebook social network, inviting their friends to follow an external link and to complete the questionnaire within five days. The number of respondent per group is indicated in the Table below:
As expected, considering that the questionnaire target and the data collection method was the same for the two groups, and the respondent distribution was similar for sex, age and education, the results showed a significant similarity in weights for the four primary needs, as reported in the figure below.
3.4 The problem
However, several respondents in both groups presented quite high values of the Consistency Ratio, with a serious lack of consistency. Let us partition the respondents in subsets, named after the following notation: Rkx indicates the subset of the respondent in Group k with CR less or equal to x. For example, R20.2 indicates the subset of the respondent in Group 2 with CR less or equal to 0.20. Conventionally, R1x>1 includes all the respondent of Group 1 and R2x>1 includes all the respondent of Group 2. The groups' subsets sizes are showed in the Table below.
For example, only eight respondents out of 113 in Group 1 managed to keep the CR below the 0.1 threshold, which is typically considered the reference value used to determine whether to keep or discard the specific interview results [42]. Indeed, the higher the number of criteria to compare, the easier it is for the respondent to give incoherent answers. On top of this, such high numbers of non-consistent respondent may usually arise when an interview requires a respondent to give judgments on a field in which the respondents have little knowledge. This should not have been the case, in fact the survey asked respondents to compare only four primary needs and the evaluation object was a snack, which is a widespread fast-moving consumer good and is commonly purchased by young Italian consumers. Thus, according to cited literature and to the AHP best-practices, respectively 92.9% and 75.7% of the respondents in Group 1 and 2 should have been considered not trustworthy. Indeed, in the NPD course competition, not a single questionnaire was excluded from the analysis in both groups. This is because the MBA participants were clearly much more concerned with showing to the audience the results of a large data collection, rather than ensuring a rigorous coherence of their methodological approach. On the contrary, these results pushed the authors to critically analyse the collected data – once the NPD module was finished and the competition ended. Given the validity of the AHP methodology to evaluate the weights of customers' needs in NPD processes, the research question was: “does the inclusion of the non-consistent respondents significantly influence the results when evaluating primary needs weight in this case?”.
4. Results of the analysis
The chosen methodological approach focused on evaluating the Compatibility Index (Comp) of the weight vectors among different subsets of each respondent group, filtered according to their Consistency Ratio. Specifically, the procedure followed the subsequent steps.
The primary needs weights have been re-computed for each group subsets: let Wkx indicate the primary needs weights vector of the respondent in Group k with CR less or equal to x. Wkx is computed through the geometric mean of the judgments of each element in the pairwise comparisons of each Rkx respondent, according to [20] Compatibility Indexes have been computed for pairs of weight vectors. Let Comp(Wkx; Why) indicate the value of the Compatibility Index between vectors Wkx and Why. Three series of Comp values have been computed:
Comp(W1x; W2x) with x = 0,1; 0,2; 0,5; 1; >1. Comp(W1x; W1x>1) with x = 0,1; 0,2; 0,5; 1. Comp(W2x; W2x>1) with x = 0,1; 0,2; 0,5; 1.
The starting point is the compatibility of the weight vectors found by the two groups and shown in Figure 1:
Weight of the primary needs (questionnaires with 0.1 CRmax)

The value is well below 10%, thus it is possible to conclude that the two weight vectors of Group 1 and 2 are compatible, as seemed clear from the histograms in Figure 1.
Index a) has been computed to verify whether the inclusion of a low-consistent respondent significantly changes the weights distribution, so that the weight vectors found by the two groups are not compatible anymore. Authors expected the index value to increase with x, questioning if the value would reach 10%.
Index b) has been computed to verify whether the exclusion of low-consistent respondent significantly changes the weights distribution, so that the weight vector found using all the interviews (i.e., the entire population) is not compatible with the weight vector found using only the more consistent respondent (i.e., filtering). Authors expected the index value to decrease with x, questioning if the value would reach 10%. The results of the Compatibility Index computations are shown in Table 4 and Figure 2 below.
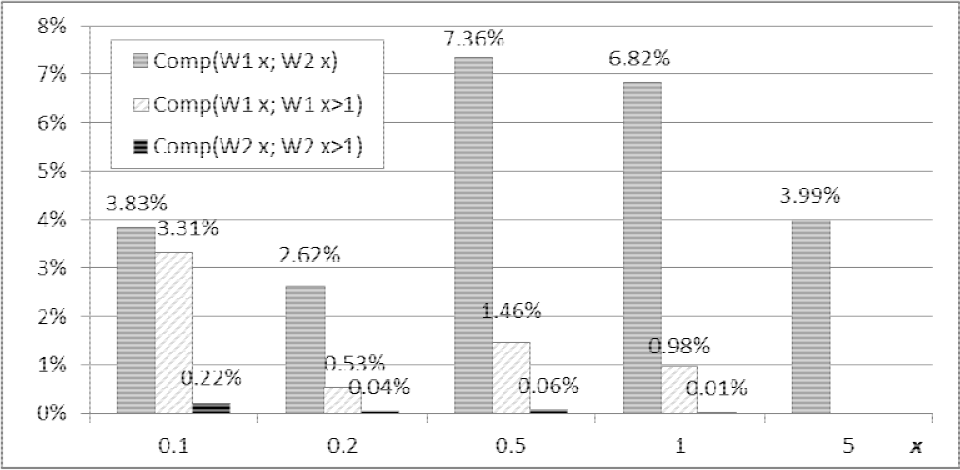
Compatibility Indexes
Respondent subsets size

The compatibility indexes shown in Table 4 stay well below 10% and, as is also reported in Table 5, the weights do not significantly change if non-consistent respondents are excluded. Weight vectors seem much more stable in Group 2 but, considering the scope of the survey – a preliminary evaluation of customers' needs for the development of a simple consumer good product – the weights variations in Group 1 can also be considered acceptable.
Compatibility Indexes

Primary needs weights variation, including non-consistent respondent

Clearly, some variations in weights were experienced comparing the entire population of respondents and the subset of respondents with the highest level of consistency (x=0.1). This happened especially in Group 1, where a ±4% was registered on two compared elements (Price). Nonetheless, the compatibility indexes showed excellent values. Thus, to answer to the research question, authors maintain that “the inclusion of non-consistent respondents did not significantly influence the results, when evaluating primary needs weight in this specific case”.
5. Conclusions
This research presents the results from the analysis of two groups of customers expressing their preferences – in term of product needs priorities – in an NPD project. The great majority of respondents showed an unacceptable value for the Consistency Index, and thus should have been excluded. However, this would have compromised the analysis, depriving it of statistical significance. Such a problem is not uncommon when carrying out surveys by means of the AHP approach. In this specific case, authors performed a critical analysis on the results, evaluating the Compatibility Index of the weight vectors among different subsets of each respondent group, filtered according to their Consistency Ratio. The compatibility indexes resulted to be widely acceptable and weights variations, when including or excluding the non-consistent respondents, were not significant. Bearing in mind the purpose of the survey – a preliminary evaluation of customers' needs for the development of a simple consumer good product – it seems that to include non-consistent respondents does not significantly influence the results. This opens the door to another more general question, that can be addressed in future works: “does it make sense to filter the respondents according to their consistency, when evaluating the customer needs in an NPD project of impulse purchase goods?”.
Footnotes
6. Acknowledgements
The Authors would like to thank the MBA/MDGI Team of the “Stoà” Institute of Management in Ercolano (Italy) and in particular the past Director of the Master Prof. Marcello Lando for his guidance and Ms. Giovanna Ciarcia for her support and assistance during the NPD project.