
Abstract
A hybrid energy system (HES) is a trending power supply solution for autonomous devices. With the help of an accurate system model, the HES development will be efficient and oriented. In spite of various precise unit models, a HES system is hardly developed. This paper proposes a system modelling approach, which applies the power flux conservation as the governing equation and adapts and modifies unit models of solar cells, piezoelectric generators, a Li-ion battery and a super-capacitor. A generalized power harvest, storage and management strategy is also suggested to adapt to various application scenarios.
1. Introduction
Stand-alone or autonomous systems, such as wireless sensor networks [1] and flapping wing robotic insects [2], require an off-grid power supply with a high sustainability, stability and reliability. Current practice usually applies a harvester to transform a single source of environmental energy to electrical power, such as solar or vibration [3], whose supply is highly restricted by the environmental conditions and results in an abrupt failure due to a sudden inconvenience of climate. Hybrid energy systems (HES) are one of the most promising solutions and combine different environmental energies and enhance power reliability. An HES consists of a combination of energy harvesters and also storage units such as a rechargeable battery and a super-capacitor to reduce power loss.
Current HES research usually focuses on the direct development of the hardware equipment or prototype and then a forwarding test to verify the feasibility [4], which is of very low efficiency and reproducibility to other kinds of HES. HES modelling can eventually reduce the time and cost, and more importantly guide all kinds of hardware development through advice on choosing device parameters.
Many unit models are thoroughly developed, such as the one/two diodes model of a solar cell [5–7], the spring-mass-damp model of mechanical vibration generators [8–10], the PNGV model of a Li-ion battery [13–15] and the RC-network model of a super-capacitor [17–19]. Although these models provide high accuracy of simulation, it is barely reported of system models of HES adapting them, mainly because they aim to simulate each unit device performance from different aspects. In the following article, a HES model is suggested by adapting these unit models into a power flux system.
2. General Model of Hybrid Energy System
The proposed HES model consists of four modules: an energy harvester, energy storage, management and energy output. In this paper, the harvesters are a combination of a solar cell and a piezoelectric generator, and a Li-ion battery and a super-capacitor serve as the storage units, as shown in Figure 1.

Hybrid energy system model
The governing equation of the general system model (Equation 1) is based on the principle of energy conservation.

P* is the power flux of each module in Figure 1. Pbat, Psc > 0 indicates the discharge of the battery and capacitor. Other harvesters and storages can eventually be added to the model to form a more hybrid energy supply system, once the unit models of the relative device are developed with an output of power flux.
3. Energy Harvesting Module
3.1 Photovoltaic (Solar Cell) Model
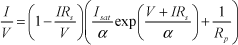
The single diode equivalent circuit [7], as shown in the dotted box in Figure 2, is applied to develop the current-voltage characteristic equation of a solar cell (Equation 2).


Solar cell model – single diode circuit
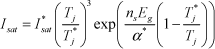
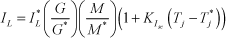
Five parameters are included in the model: LI - the light current, LI - the diode reverse saturation current, α- the ideality factor and Rp and Rs - shunt and series resistance. They are a function of the environmental conditions, involving irradiance G, junction temperature TjT and air mass AM (in form of correction factor M / M*). Considering Rp and Rs as constant, the other three parameters can be interpreted by Equation 3–5, where * indicates the value under SRC (Standard Rating Conditions, with G* =1000W/m2, T*j = and AM* =1.5), ns is the series cell numbers in one module, Eg is the gap energy of cell material and KI is the temperature coefficient of the short circuit current. [6]

After the identification of the five model parameters, the module introduces a determination process for maximal power point aiming to simulate the MPPT (Maximal Power Point Tracker) and to provide the output power of solar cell module Ppv. At the MPP, an additional equation is available:
From Equation 2 and 6, the maximal power point (Imp, Vmp) can be calculated and eventually the output power:

3.2 Piezoelectric Generator Model
The piezo-generator is commonly in the form of a bimorph cantilever and is based on the 31-mode (or transverse) piezoelectric effect [3]. The equivalent circuit can be illustrated as shown in Figure 3 and the piezoelectric effect is simulated with a transformer [9].

Piezoelectric generator model – transformer circuit
The governing equations of the vibration and piezoelectric effect are then deducted from the equivalent circuit as in Equation 8 and 9 [9, 10].


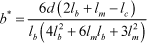
δc(t) - strain in piezo-ceramic layer, ÿ(t) - environment vibration acceleration (on the fixed end of the cantilever beam), d31 - strain constant of the ceramic, Yc - Young's modulus of the ceramic, εc - dielectric constant of the ceramic, h c - thickness of the ceramic layer, m - free end mass weight, b* and b** - geometrical factors of the beam, determined by Equation 10 and 11, where lb, lc and lm stand respectively for the length of whole beam, free end mass block and the ceramic layer, d is the distance between the layers of ceramic and substrate in the beam, and Ib is the effective inertia moment of the beam [11].

Equation 8 involves µ1, the mass correction coefficient, to compensate the beam weight effect on vibration. µ1 can be calculated from Equation 12, where λ is the linear weight of the beam [10].

On solving the differential equations of Equation 8 and 9, the open circuit voltage Voc(t) can be identified. In case of a continuous harmonic excitation, Voc(t) will also be in sinusoidal form, noting the amplitude as Vm.
A rectifier serves after the piezoelectric generator to properly supply the load. It's proven that in a scenario with both Full-Bridge (FB) and Voltage-Doubler (VD) rectifier, the maximal power of the final output is determined by Equation 13, where ω is the excitation frequency, Cp is the equivalent parallel capacitor and wb is the width of the beam [12].


4. Energy Storage Module
4.1 Li-ion Battery Model
The PNGV model is widely used in rechargeable battery simulation, as shown in Figure 4 [13]. Voc is the static open circuit voltage. Resistance Ro reflects the ohmic polarization effect, while resistance Rp and capacitor Cp express the combined effect of electrochemical and concentration polarization. Capacitor Cb interprets the gradual variation of battery voltage.

Li-ion battery model – PNGV circuit
The governing equations of the PNGV model are Equation 15–18 in a discrete form, where k is the order of sample data. The five parameters Voc, Ro, Rp, Cp and Cb, included by the model, are a function of SoC, state of charge [15]. These relationships can be determined from the regular HPPC (Hybrid Pulse Power Characterization) test [16].

Flow chart of the battery model output calculation


Equation 19 applies an Amper-Hour integral method to calculate the current SoC, where Cm is the maximal capacity of the battery [13, 15].
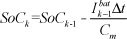
Figure 5 shows the calculation process of output power Pbat. γ bat is the indicator of the charge/discharge state (1-charge, 0-discharge, −1-no change) and Pbat0 is the system power demand from the battery. Vcm, Vdm, Icm and Idm are the charge/discharge control limits of the voltage and current.
4.2 Super-Capacitor Model
The RC network always simulates a double-layer capacitor. This paper applies a circuit as shown in Figure 6 [17]. The first branch, consisting of Ri and Ci, interprets the transient stage of five seconds after an abrupt change. The second branch, consisting of Rd and Cd, interprets the retardant stage of the follow-up 20 minutes after the abrupt change. Rl reflects the leakage in a static stage.
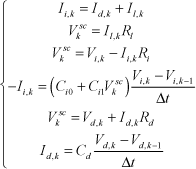
Like the battery, the super-capacitor model includes discrete equations [17, 18]. The transient stage is described with Equation 20, while Equation 21 illustrates the transient stage. All the model parameters, Ri, Ci0, Ci1, Rd, Cd and Rl can be determined from the constant current charge test [19].

Super-capacitor model – Parallel RC Network
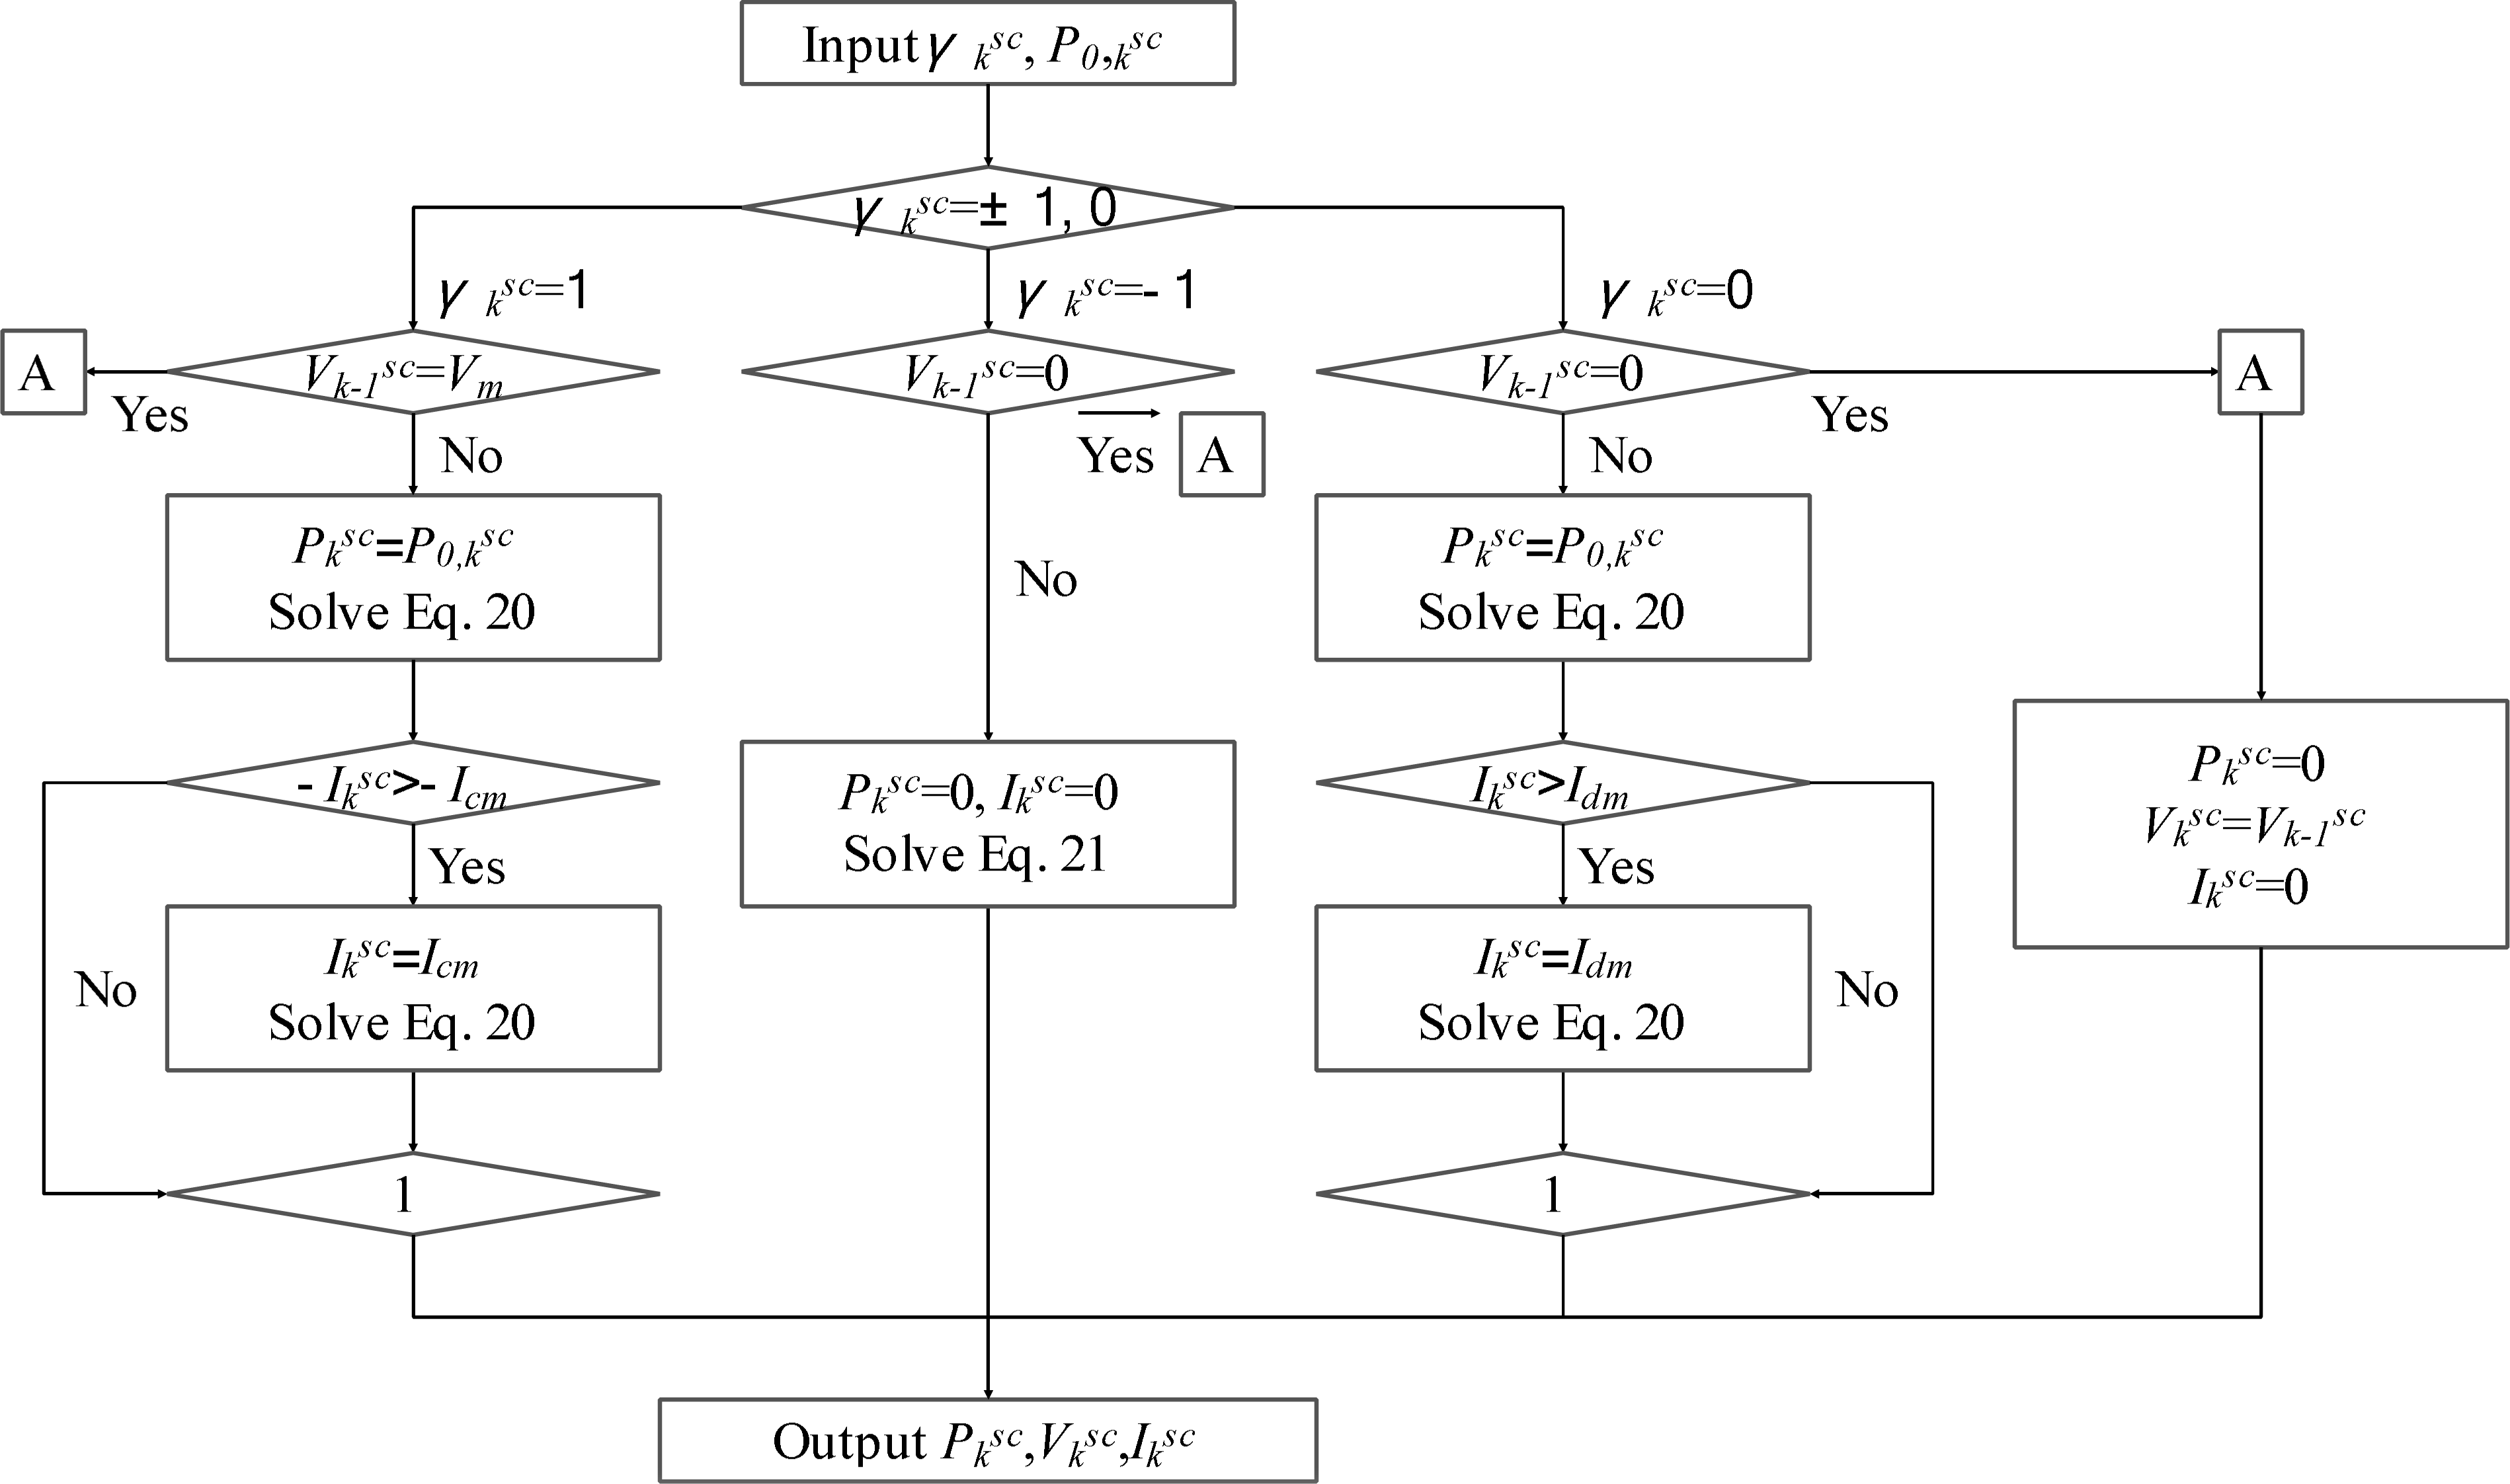
Flow chart of the super-capacitor model output calculation

Similarly to the Li-ion battery, a calculation process for super-capacitor output power is shown in Figure 7.
5. Energy Output Module
Energy output modules can be any kinds of load. A typical one is the wireless sensor network, which operates intermittently and periodically [1]. Noting the period as T and duty cycle of active status as D, the output power demand can be expressed as Equation 22.

6. Energy Management Module
The energy management module is the core part of providing a strategy of power distribution. The structure is shown in Figure 8.
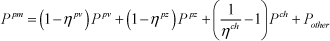
The energy lost term Ppm is illustrated in Equation 23, with η* being the efficiency of the relevant DC/DC device.

Energy management module
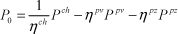
Hybrid energy systems with multiple input sources and storage units require a power distribution strategy to manage the energy flux. A General Coefficient Distribution Method (GCDM) is proposed to simulate the strategy. GCDM can be interpreted with Equation 24 and 25, where a certain combination of β* and α* i presents a relative distribution strategy.


The sum of Pbat0 and Psc0 should match the gap of system power demand P0:
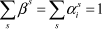
In other words, the distribution strategy is supposed to accord with the principle of power conservation. As a result, the coefficients in GCDM should be restricted with Equation 27:
Two common management strategies are raised here to explain the implementation of GCDM, with definitions of trigger conditions and values of β* and α*i, as shown in Table 1. Other strategies can be modelled with different definitions of trigger conditions, βs and αsi.
Two power management strategies modelled using the General Coefficient Distribution Method
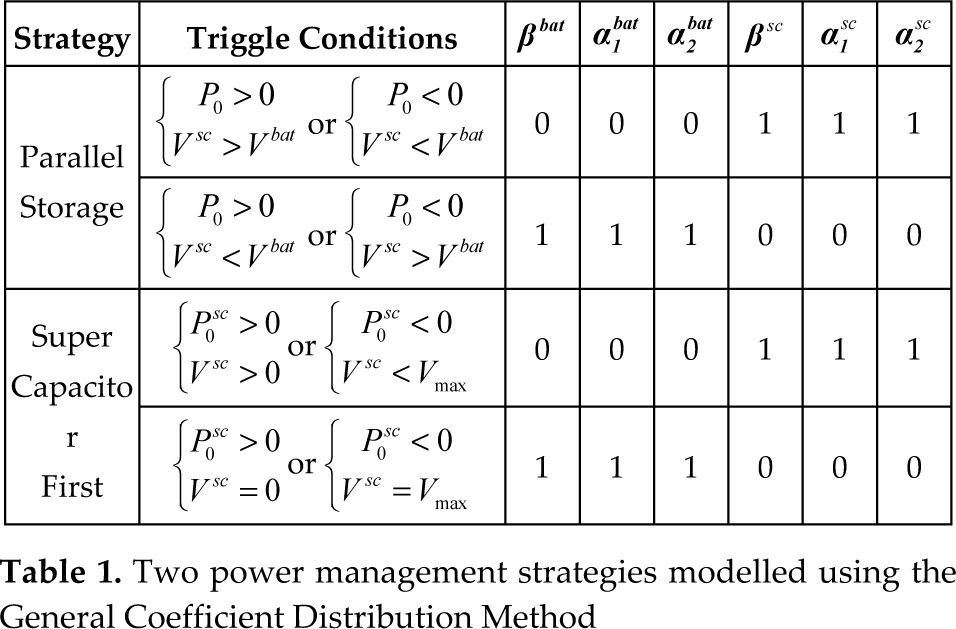
The simplest design is to have a battery and super capacitor parallel in the circuit. If the system asks for extra power from storage (P0 > 0), the unit with a higher voltage will at first discharge and its coefficients will be one while others' are 0; on the contrary in case of a charge (P0 < 0).
Another strategy example is to have super capacitor prior to charge or discharge, since a capacitor presents a better performance in instantaneous high-power charging /discharging. In case of a positive power gap (P0 > 0), the distribution coefficient can be firstly defined as βsc = αsc1 = αsc2 = 1, βbat = αbat1 = αbat2 = 0 when Vsc > 0, and won't change to βsc = αsc1 = αsc2 = 0, βbat = αbat1 = αbat2 = 1 until Vsc = 0 (super capacitor fully discharged).
7. Summary
An accurate and comprehensive electrical model has been proposed to simulate the power flux of a hybrid energy system (HES). Photovoltaic and piezo-generators are the primary choice of harvesters in this model. As hybrid energy storage, a Li-ion battery and super-capacitor are included and a status identification and output calculation process is respectively illustrated. A generalized energy management strategy, the General Coefficient Distribution Method, is approached with combinations of distribution factors. This system model can be reproduced into other HES by alternating the relevant harvester and storage modules and be simulated under a Matlab environment. With the help of an HES model, hardware development can be significantly accelerated and more oriented with adjusted parameters.