
Abstract
Identification of the assignable causes of process variability and the restriction and elimination of their influence are the main goals of statistical process control (SPC). Identification of these causes is associated with so called tests for special causes or runs tests. From the time of the formulation of the first set of such rules (Western Electric rules) several different sets have been created (Nelson rules, Boeing AQS rules, Trietsch rules). This paper deals with the comparison analysis of these sets of rules, their basic statistical properties and the mistakes accompanying their application using SW support. At the end of this paper some recommendations for the correct application of the runs tests are formulated.
Keywords
1. Introduction
SPC is an approach to process control that has been widely used in both industrial and non-industrial fields. It is primarily a tool for understanding process variability. SPC is based on Shewhart's conception of process variability. This conception distinguishes the variability caused by obviously effected common causes (the process is considered to be in a state of statistical control [1]) from the variability caused by abnormal, special (assignable) causes (the process is considered not statistically stable) using control charts. The main goal of SPC is the identification of abnormal variability caused by special (assignable) causes, with the aim to make the process stable, to minimize process variability and to improve the process performance. To meet these goals SPC must be built as a problem-solving instrument and the sequence of the subprocesses “Out-of control signal revelation – Root cause identification – Action acceptance – Verification of action” must be the axis of the SPC application. A control chart is the main SPC instrument for the analysis of process variability over time. It is a graphical depiction of process variability and its natural and unnatural patterns. The control chart displays a value of the quality characteristic that has been measured or some sample statistics that have been computed from the measured values in a sample versus the sample number or time. The central line in the control chart represents the average value of the quality characteristic corresponding to the statistically stable process (only the natural pattern is presented and only common causes influence the process). The control limits are set so that when the process is statistically stable, nearly all the points in the control chart fall between them (for most applied ±3σ control limits this is 99.73% of points). As long as the points are within the control limits and they show a natural random pattern, the process is considered statistically stable. But if some points are out of the control limits or the points inside the limits show a non-random (unnatural) pattern, it is assumed that an assignable cause of the abnormal process variability is present and it must be removed from the process via searching for it and a corrective action or some improvement must be realized.
2. Natural and unnatural patterns
In general, the points plotted on the control chart form an irregular up-and-down pattern (natural or unnatural). An advantage of the control chart is that it enables observation of the process behaviour over time to search for the occurrence of any unnatural patterns [2] as a symptom of the special (assignable) cause and as a signal for the reduction of the process variability and improvement.
A natural pattern is a pattern where the points fluctuate randomly. It can be characterized as follows:
most points lie near the central line only a few of the points spread out and reach the control limits very rarely some point goes outside of the control limit
When some or all these attributes are missing the pattern will be classified as unnatural. Many types of unnaturalness can be recognized in control charts, but several generic patterns that can be detected for various processes have been defined. The most recommended and applied non-random patterns for the Shewhart control charts, including their description and their typical symptom in the control chart, can be found in Table 1 and 2 [2–6].
Mostly recommended unnatural patterns and their description

3. Tests for unnatural patterns recognition
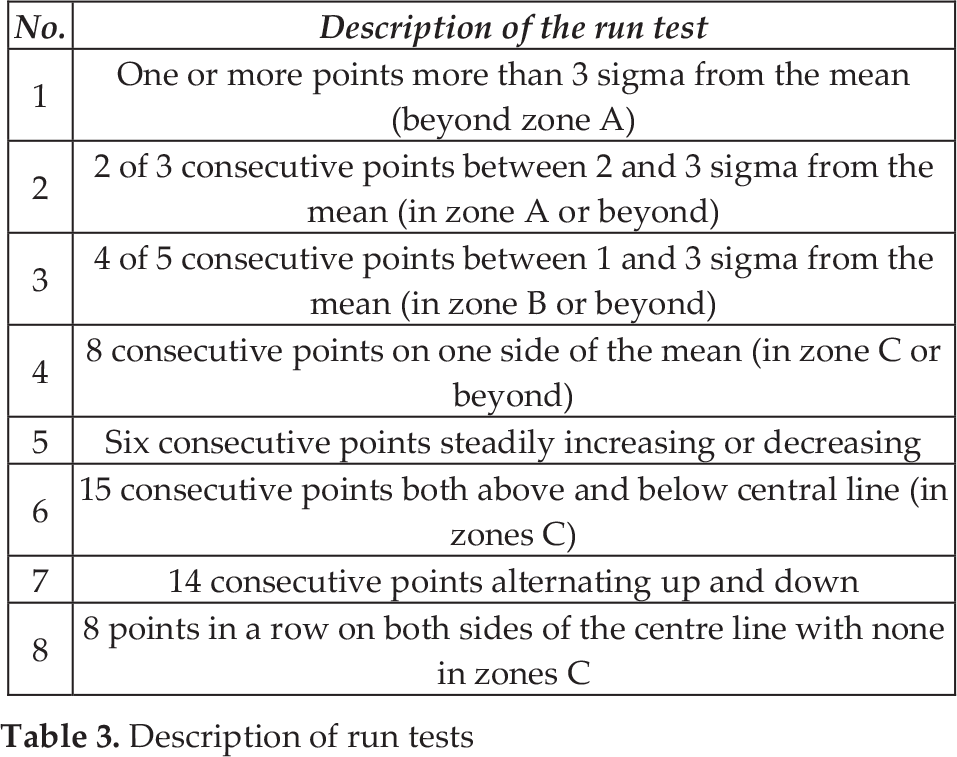
To standardize and simplify the process of unnatural patterns recognition, statistical tests (rules) that quantify the length of the unnatural patterns were formulated. They are based on probability calculations that tell us the portion of points lying near the central line, near the control limits, etc. We will discuss the tests that cover unnatural patterns 1 – 6 (see Table 2). The definition of these rules can be found in Table 3.
Mostly recommended unnatural patterns and their description

Description of run tests
In this paper the sets of the rules that are most well-known and applied (Shewhart rule, Western Electric rules, Nelson tests and ISO 2859 tests), special sets defined by large companies (Boeing, AIAG, GE) and the most new set by Trietsch [2]) are analysed (see Table 4).
Analysed sets of run tests

Note: Numbers in brackets = the order of the rule in the particular set of the rules; number of points = the length of the particular run.
Rules 1 – 4 were defined to quickly recognize patterns linked to shifts in the process. Rule 5 is connected with the trends, Rules 6 and 8 with patterns caused by incorrect sample strategy and Rule 7 with abnormal oscillation.
The relations between unnatural patterns (see Table 1 and 2) and analysed run tests can be found in Table 5.
Relations between unnatural patterns and rules

Historically, the first rule for the detection of the assignable cause was developed Shewhart [7] (Rule 1 in Table 4). As we can see, this basic rule (known as Criterion 1) is incorporated into all sets covered by Table 4. The set of Western Electric rules [8] added to the Shewhart criterion run tests, covering unnatural patterns such as smaller or sustained shifts (called zone tests), mixtures, stratification and systematic variation. To be able to apply these tests the region between the control limits in the control chart must be divided into six zones, each of one sigma width and the location of the predefined sequences of the points in relation to these zones must be evaluated. As the normal distribution of the applied statistics is supposed, in zone C 68.27% of values, in zone B 27.18% of values and in zone A 4.28% of values are expected when the process is statistically stable (see Figure 1).

Definition of the zones
Rules 2, 3 and 4 were designed for quicker identification of the shifts from the mean as compared to Test 1 (early warning indicator).
As it can be seen in Table 4 the most complex, in terms of the rate of covering, of all eight defined rules are Nelson rules [9]. In addition to the Western Electric set, Nelson defined a run test for the oscillation and trends. In Rule 4 he changed the length of the run from eight to nine points. As compared to the Western Electric rules the sequence of the rules had been changed by Nelson, too. The standard for the Shewhart control charts ISO 8258 [10] has wholly copied the Nelson set of rules. Also in [2] Trietsch works with the Nelson rules but in Rules 6, 7 and 8 he changes the length of the runs to reach better statistical properties of these tests.
Boeing and GE [11, 12] have less complex sets of rules, based on the first four Western Electric zone rules.
4. Determination of the root assignable cause
Precise recognition of unnatural patterns will not be effective when we are not able to assign the root causes to the patterns. Determination of the root cause asks for a high level of experience and deep knowledge of the analysed process. In spite of this crucial fact the generic Rules 1 – 8 have a large advantage, the possible general root causes linked to them are defined in many publications (see Table 6).
Definition of possible assignable causes in relation to the unnatural patterns and rules

Definition of possible assignable causes in relation to the unnatural patterns and rules
5. Statistical properties of the run tests
Application of the runs tests sensitizes the control charts, which means that control charts with these supplementary rules reveal small changes in a process more quickly or reveal other assignable causes (for instance the wrong subgrouping). However, the user must be aware of the fact that on the other hand every supplementary run test increases the overall false signal. In spite of the fact that the false alarm linked to the particular rule can be small, the overall false alarm rises with the number of applied rules. For example: let the overall false alarm α be computed using the formula (assuming k independent rules):
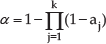
When gradually applying 2, 4, 6, 7 and 8 additional rules (suppose that α i for every particular test will be 0.0027), α gradually rises with the number of rules (α = 0,005 for k = 2, α = 0,011 for k = 4, α = 0,016 for k = 6, α = 0,019 for k = 7 and α = 0,02 for k = 8) as compared to α = 0,0027 for the basic rule (one point out of the control limit in the Shewhart control chart). In addition, this formula supposes independent rules. In practice this assumption is often observed. For that reason supplementary rules must be simultaneously applied with a high caution because of the danger of making the problem solving process complicated (for more detailed information see [3]).
However, in practice some rules can be dependent. In such situations a better formula for the computation of the overall false alarm is [2]:

When applying several run tests simultaneously the user should consider the following issues:
type of run test number of tests length of the run
6. Recommendations for application of the rules
In the professional literature several strategies for application of the rules for assignable causes can be found. They have many differences but the main idea is a common one: run tests must not be applied routinely; it is very impractical to apply all known rules simultaneously because of the danger of an unacceptable rise in false alarms.
As can be found in the mentioned literature, some authors differ in their ideas of what rules to apply routinely, but predominantly they recommend Rule 1 in conjunction with Rule 4. For additional sensitizing of the control charts some of the authors recommend Rules 2 and 3. Wheeler [13] recommends using these rules only when increasing sensitivity of a control chart is absolutely necessary. From some strategies an effort can be seen to separately apply rules for the identification of patterns for shifts and patterns for subgrouping problems (for instance Wheeler [13] suggests that the main use of the Rule 6 is at a start-up of SPC, rather than in an on-going control). Some authors emphasis stress on the phases of SPC implementation when selecting suitable rules. Montgomery suggests that “sensitizing rules can be helpful when the control chart is first applied and the focus is on stabilizing an out-of-control process. However, once the process is reasonable stable, the routine use of these sensitising rules to detect small shifts or to try to react more quickly to assignable causes, should be discouraged” [3, p. 197].
7. Run tests and different types of control charts
In practice it is not obvious that another fact influencing the correct interpretation of the control charts should be considered, i.e., the applicability of the particular run test to the different types of control charts. The following conclusions can help to solve such problems:
all rules can be applied to x-bar chart and individual charts supposing normal distribution of the variables Rules 1 – 4 can be applied to dispersion charts (R, s) without any modification when the sample size is five or more (it should lead to the symmetric control limits) the nonparametric rules (Rules 5 and 7) work sufficiently well for continuous distribution the rules can be applied without any problems in control charts np and c supposing that normal approximation is valid and the control limits are reasonably symmetrical the same for control chart p and u with constant control limits.
8. Analysis of the selected SW products
As was mentioned in the previous chapters the routine application of the run tests can lead to a reduction in the effectiveness of SPC implementation. Nowadays there are many SW products that support this part of SPC. They enable an increase in the effectiveness of problem solving in SPC but at the same time they bring a danger of the routine application of the rules with negative effects.
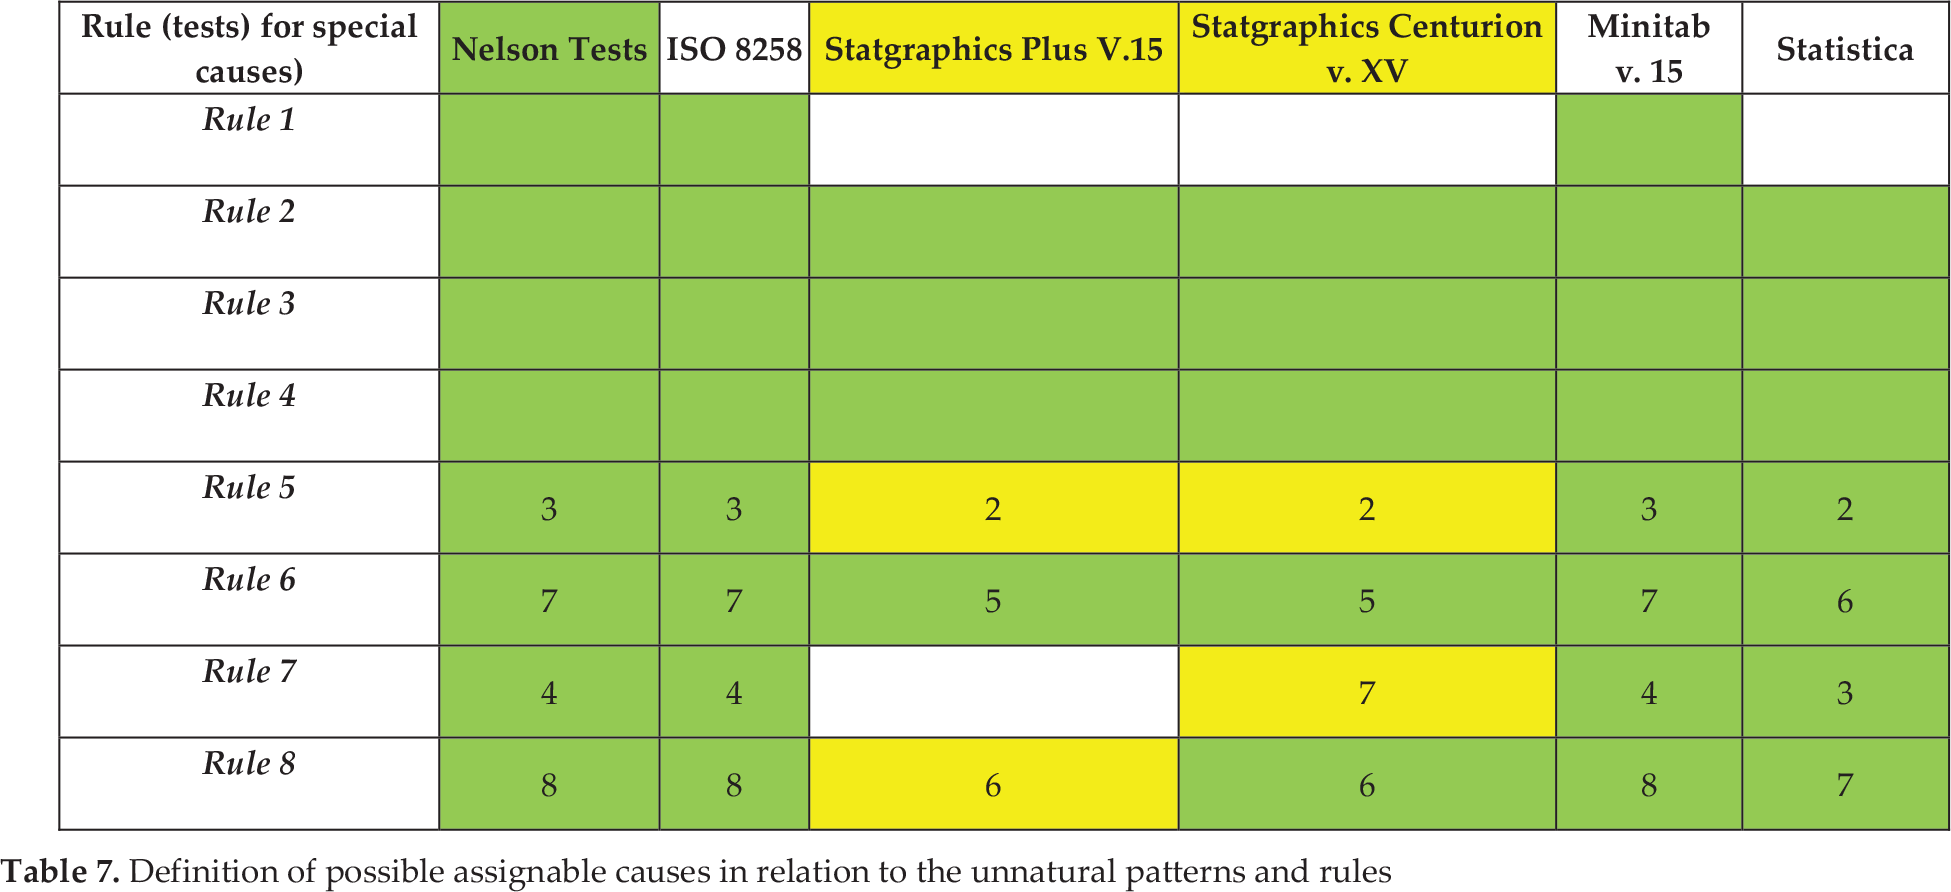
This chapter contains the main results of the analysis of SW (Statgraphics [14, 15] Minitab [16]), used for education at the Department of Quality Management at the University of Ostrava, Czech Republic and the excellent statistical SW Statistica [17] used by many well known Czech universities. This analysis was focused on the above-mentioned SW support for control chart unnatural pattern recognition with respect to the problems discussed in the previous charters.
In general all analysed SW cover the set of Nelson rules (the same as those used in ISO 8258) with some slight departures. Only SW Minitab contains all the Nelson rules (tests for assignable causes) including Shewhart Criterion 1 (Rule 1). The rest of the analysed SW have Rule 1 incorporated into the basic control chart analysis outside the set of runs tests (for that reason in these SW, the term “runs tests” is used). From the point of view of the common types of the unnatural patterns defined in this paper (large shift, smaller sustained shift, trends, stratification, mixture and systematic variation) all analysed SW cover all these types, except Statgraphics Plus where systematic variation is not considered. The Statgraphics SW have a slightly different definition for Rule 5, Rule 8 (Statgraphics Plus) and Rule 7 (Statgraphics Centurion).
Every analysed SW was searched using many different standpoints such as: the term used for the unusual pattern, the term used for the run tests, explanation of the statistical base of the run tests, the different default run definitions compared to the default number of rules, the possibility of choosing the rules, the possibility of changing the length of the runs, the possibility of changing the definition of the zones, the indication of the patterns in the control chart, the possibility of recording the assignable causes in the control chart, the possibility of recording the actions in the control chart, warning about the simultaneous use of the rules, warning about the necessity to have an extensive knowledge of the process, the types of control chart covered, the same default set of rules for different control charts, information on what control chart rules are applicable, the existence of the definition of the potential general assignable causes, description of the rules and interpretation of rules. The former analysis of the properties of the analysed SW showed that all SW, more or less, suffer from some disadvantages that can lead a little experienced user to the incorrect conclusions and to incorrect information for the process control. This can unfortunately result in ignoring these run tests in the analysis of the process stability or the whole SPC application failing. For that reason in the next charter the simple methodology for the correct control chart interpretation is formulated.
9. Recommendations for the application of rules for unnatural patterns recognition
Based on the analysis of the professional literature (Chapters 2 – 7) and the analysis of the selected SW products (Chapter 8), the author of the paper proposed the methodology for the application of run tests, effective control chart interpretation and successful SPC application. This methodology can be described as follows:
Before applying the runs tests or the tests for special causes check the default set of tests for the selected control charts in the used SW. Never routinely apply all runs tests or tests for assignable causes even if they are defaulted in your SW. Check if the chosen control charts have reasonably symmetrical control limits because in such a situation the next conclusions are valid:
all tests (Rule 1 – Rule 8) can be applied to the x-bar chart and the individuals chart supposing the normal distribution of the variable Rules 1 – 4 can be applied to the dispersion charts (R, s) without any modification when the sample size is five or more the rules can be applied without any problems to control charts np and c supposing that normal approximation is valid and control limits are reasonably symmetrical the same for control chart p and u with constant control tests 5 and 7 work sufficiently well for continuous distribution because of their nonparametric nature. In a situation when the control charts have reasonable symmetrical control limits, select the suitable test according to the following schema:
Rules 6 and 8 apply at the beginning of the SPC implementation to verify rational subgrouping in the phase of statistical stability, make sure to start with Rules 1 and 4 if additional sensitizing of the control chart is necessary add Rules 2 and 3 (or only one of them) when your knowledge of the process has increased during the previous SPC implementation add some of the other standard tests or your own fitted test; test 5 is applied singularly (its marginal increase in sensitivity to real signals is more than offset by the greater increase in false alarms (see [13, p. 137]) Rules 1 – 4 apply to both halves of the control chart separately. When using two control charts (for instance x-bar and R) start with an analysis of the dispersion control chart. Remember that where the run test is violated it does not always indicate where the process change had occurred. Work out the list of possible root causes of the identified unnatural patterns (see Table 6) with adequate actions. Set the root causes of the identified unnatural patterns. Realize adequate actions to remove or reduce the detected assignable (uncommon) causes' influence.
10. Conclusions
Based on the theoretical background in the introductory chapters, this paper deals with the analysis and comparison of several known sets of rules for special causes identification (Shewhart rule, Western Electric rules, Nelson tests, ISO 2859 tests, special sets formulated by large companies [Boeing, GE] and the most new set by Trietsch). In light of the conclusions of these analyses the next multi-criteria analysis of the selected SW products, with a focus on tests for special causes identification, were carried out with the aim to reveal the advantages and disadvantages of every discussed SW from the point of view of support for meeting the main goal of SPC. Based on these analyses the methodology for the correct and effective application of these tests was then formulated.
Footnotes
11. Acknowledgement
This paper was elaborated in the frame of the specific research project No. 2013/49.