
Abstract
Interuniversity consortia are linked together through direct (participation in the same consortium) and indirect (participation of the same member in two consortia) connections. The resulting network can be analysed with the techniques of Social Network Analysis. In this article we show that in our sample the consortium's centrality increases its turnover rate and its capacity to reach the break-even point. Moreover, we show that interuniversity consortia, including non-academic organizations, have a lower turnover value than purely academic ones. The results may enhance understanding of the role played by relational capital in the performance of non-profit organizations, which may also lead to policy recommendations.
Keywords
1. Introduction
Academic consortia are groups of academic institutions pursuing the exchange, promotion and management of research and development activities in a well-defined scientific area. They can be established in order to reduce a project's costs, share knowledge or other intangible and tangible capitals, and promote joint research activities.
They are multifunctional research organizations, sometimes real communities of practice, where researchers and technicians share their human capital and know-how. Academic consortia can be characterized by a national scope (in which the main national universities participate) or by a local scope (in which one or few universities frequently participate with private business companies and other public organizations).
Both national and local Italian interuniversity consortia share several characteristics. First of all, most of them are by statute non-profit organizations. Moreover, the majority of them are stable, with long-lived contracts of up to five years. Again, the funding sources for these organizations often consist of the same entities, which commonly are provided by each member of the consortium (different participants can provide different ratios depending on their role and commitment), other firms or public organizations, (not necessarily taking part in the consortium, but benefiting from its activities), and the Italian Ministry of Education (MIUR).
Very little has been written in the literature about these consortia, therefore the aim of this article is to investigate their economic performance combined with the relational capital distinguishing them as aggregations of distinct entities. The article is aimed at enhancing the comprehension of the role played by relational capital in the performance of non-profit organizations, which may also lead to policy recommendations.
The article consists of a first part where prior research and hypotheses are presented, followed by a descriptive analysis of the sample. Then, hypotheses are verified through non-parametric tests and are discussed in the conclusions.
2. Prior research and hypothesis of the study
Relational capital is often considered a critical component of organizational intellectual capital. It represents an organization's relations and knowledge exchange with its external stakeholders, as well as its reputation. While Bontis [1] considered only the relationships with customers (such as their loyalty to the organization), other authors (such as [2–5]) included those with other stakeholders, also considering the reliability of relationships with key suppliers and allied partners, the lobbying and networking skills, the critical understanding and intelligence about competitors, etc… [6] pointed out that the organizational network of relationships is an important source of value. Indeed, literally hundreds of articles have studied many aspects of inter-organizational relationships (IOR) [7, 8]. Organizations can be connected through partial ownership (joint ventures or minority investment), co-operative agreements, research and development partnerships, cross licensing, strategic alliances, coalitions, franchises, research consortia, communities of innovation and various forms of network organization [9–16].
While many authors have studied network structure through the SNA, only a few of them have evaluated the role that a network structure plays with respect to various economic development strategies [17]. Tichy et al. [18] described the first applications of Social Network Analysis (SNA) to IOR. Paulson [19] defined an inter-organizational network (IORN) as “any bounded set of connected organizations where “boundary” is a membership criterion which follows commonly understood norms and where “connection” is any actual or likely, direct or indirect, interorganizational influence”.
Studies on research consortia (RC) have focused on the relation between participation in RC and the overall research productivity of participants [20], on the relation between the level of competition in industries and the rate of RC participation [21], on the factors that facilitate the collaboration between industry and university [22, 23] and on intellectual property issues [24].
We consider interuniversity consortia as networks of organizations and analyse their characteristics by applying basic techniques of SNA and calculating Closeness centrality and Betweenness centrality. The former represents the average distance between one node and all other nodes, while the latter measures the number of shortest paths crossing that node [25]. Both measures are indicators of the importance of an organization in the consortia network.
In this article we analyse the effect of the structure of the relationships within a university consortium on its performance, by testing the following three hypotheses:
H1: consortia with better relationships (i.e., with higher centrality indicators) have a higher turnover rate on average; H2: consortia with better relationships (i.e., with higher centrality indicators) are more likely to reach the break-even point; H3: consortia which include non-academic organizations among their members will achieve a higher profit;
The rationale behind H1 and H2 is that:
the associations with more members, as well as those within a dense network of relationships, can carry out research on a larger scale, drawing more substantially on both economic and intellectual resources; a higher number of researchers and therefore a higher amount of exchanged knowledge and available assets (publications, patents, workshops, shared practices) will lead to higher quantity and quality of the activities that are the consortium's target. Therefore, output will probably increase in both intellectual and economic terms; most of the time academic consortia are by statute “non-profit”, thus we consider, on the whole, the break-even point to be as desirable as the achievement of profits.
The third hypothesis is based on a purely economic and managerial assumption. It suggests that the participation of non-academic institutions may increase the amount of available economic resources. Non-academic public and/or private organizations often provide more funds to the consortium than academic ones. On the other hand, the latter contribute specific know-how and intellectual capital to the consortium that are necessary to achieve the goals of the consortium. Thus, in private/academic consortia we expect higher turnover rates, considering that activities and projects should generate real economic benefits in order to justify investment from private partners and, more generally, investment from institutions whose aim is not only the growth of national scientific and cultural heritage.
3. Data and methods
This study is based on the consortia which involve the “Tor Vergata” University of Rome, which is one of the biggest universities in Italy, and participates in more than half of the Italian interuniversity consortia. We could not include other Italian interuniversity consortia in the analysis, because economic and relational data were fragmentary, unreliable or unavailable. We analysed in depth a total of 42 consortia, effectively existing and operative. We compiled a complete list of all the universities and other organizations participating in each consortium. Data were collected from the Management Accounting Committee of “Tor Vergata” University of Rome, and from the official consortia's web sites, when available.
3.1 Network construction
The network consists of a node for each entity, in particular 42 nodes for consortia, 79 nodes for Italian universities and four for foreign ones, 64 nodes for private companies and 20 for public ones. A non-oriented arc (i.e., edge) connects a consortium with a university/organization whenever the latter is a member of the former. 499 edges were detected between consortia and Italian universities, four between consortia and foreign universities, 65 between consortia and private companies, 21 between consortia and public ones. Thus, the network created has 209 nodes and 589 edges in total.
A particular kind of network, called “affiliation network”, was chosen for the SNA modelling. The first set of actors is made up of universities and other consortia's member, the second one contains only the consortia. This model reflects the main features of our network because:
the absence of arcs between pairs of consortia and pairs of members, which derived directly from the network's construction, sets up a bipartite graph at the base of the affiliation networks' theory. the two distinct sets, one of events and the other of members of the events, jointly represent all the relationships, which are the scope of analysis, that is, several universities and other organizations “linked” by their common participation in an interuniversity consortium.
Figure 1 shows the complete affiliation network: black nodes described by A# represent private organizations, grey nodes described by E# are public organizations, grey nodes described by U# are universities, white nodes described by C# are consortia, and white nodes described by US# are foreign universities. U30 represents the “Tor Vergata” University of Rome. In the figure, all the Italian universities are shown, while less than 8% of them are not connected to any of the consortia of the sample, and are discarded in order to calculate the consortia's centrality coefficients.

Complete affiliation network
In order to analyse this network and calculate the necessary indicators we used the software “Pajek”, created by V. Batagelij and A. Mrvar from Ljubljana University [26].
We analysed two performance indicators: the turnover rates and the net profit or loss. Data were collected and classified with respect to the triennium 2007-2009. Some data were missing for different reasons (consortium founded in 2008 or 2009, information not provided by the consortium or balance sheets written according to different criteria from the others). Where information was not available for 2009, conservative projections based on the data for 2008 were used.
The consortia's relational capital is described using the centrality indicators described before, producing variables named CC(i) and CB(i) that stand for, respectively, closeness and betweenness centrality of the i-th consortium.
Consortia's turnover rates are indicated with s i , a continuous variable representing the book value, as reported in the i-th consortium balance, and with Si, a discrete ordinal variable with integer values between 1 and 3, which stand for three different turnover classes, defined as follows:

4. Results and Data Analysis
In the following sub-paragraphs we test the three hypotheses discussed before in the article. Since values are unlikely to be normally distributed, we perform our analysis using non-parametric statistics such as Spearman's (ρ) and Kendall's (τ) rank correlation coefficients, and tests such as the Chi-Square Test and the Mann-Whitney U-Test
4.1 Hypothesis 1
Table 1 reports the correlation values between the centrality coefficients of all the consortia CC(i) and CB(i) and their turnover rates in the triennium 2007-2009: si(2007), si(2008), si(2009). Results show that a positive correlation exists between centrality and sales, which is most of the time strongly statistically significant.
Kendall's and Spearman's correlations between centrality indicators and sales in the triennium 2007-2009. Asterisks indicate significance at less than 0.001 (***), 0.01 (**), and 0.05 (*) levels.

We define the following dummy variables:
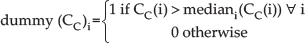

For each year in the triennium 2007-2009, and for both dummies, we separate the consortia into two groups according to the dummy values. Table 2 shows the results of a non-parametric Mann-Whitney's U Test applied to the sales values of the two samples over the three years. In the U Test the null hypothesis to be tested is that the two samples come from distributions with the same median, while the unilateral alternative hypothesis is that one has a median value higher than the other. In order to test H1, our alternative hypothesis for the U Test is that the consortia characterized by a higher centrality will outperform those with a lower one in terms of sales. In all cases, median sales of the groups with higher centrality values are higher than those with lower ones (regardless of the method we choose to calculate the consortium centrality). The statistical significance of such results is very strong in all cases; as such we can consider H1 verified.
Mann & Whitney's U Test between turnover rates in the triennium 2007-2009, grouped according to centrality indicators. Asterisks indicate significance at less than 0.001 (***), 0.01 (**), and 0.05 (*) levels.

4.2 Hypothesis 2
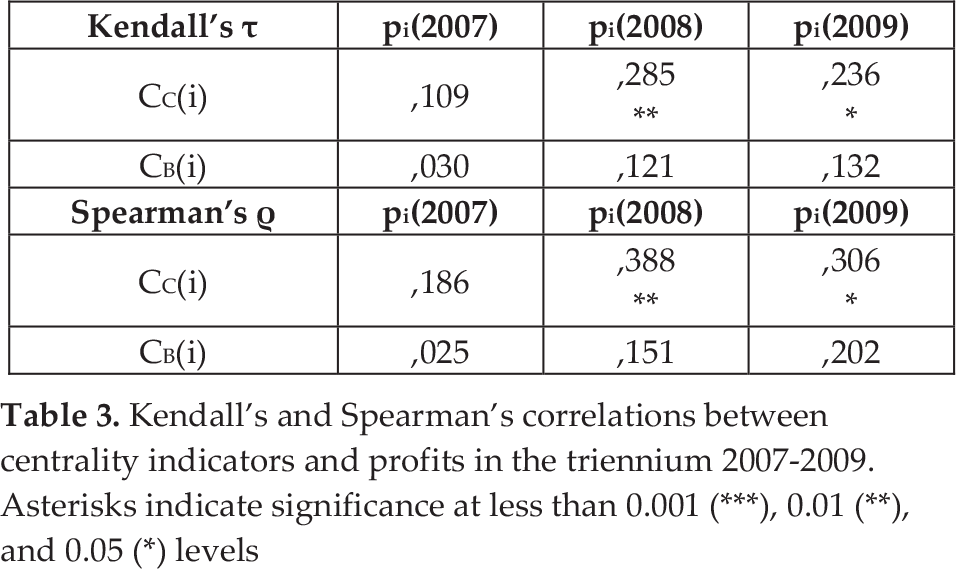
Table 3 shows the correlation values between centrality coefficients CC(i) and CB(i) and profits in the triennium 2007-2009: pi(2007), pi(2008), pi(2009). The positive correlation is quite weak for almost all couples; moreover it is statically significant only between closeness centrality and profits in the years 2008 and 2009.
Kendall's and Spearman's correlations between centrality indicators and profits in the triennium 2007-2009. Asterisks indicate significance at less than 0.001 (***), 0.01 (**), and 0.05 (*) levels
The amount of profits may change dramatically according to several variables, such as the purpose of the consortium (base research, research and development, teaching, service providing, etc…), its assets and the source of their income. In many cases, consortium managers want to invest the entirety of its income, not exceeding the break-even, because the consortium rules would otherwise force him/her to devolve the positive difference. Thus, we define the variable dummy(p)i as:

Doing so, we focus our research interest on the consortia capacity of reaching at least the break-even point, hypothesizing that only a loss could be considered a negative performance in an objective way.
In order to test H2, we performed a Chi-Square Test on the proportions, recurring to 2×2 contingency tables (see Table 4 and Table 5) that classify (in the three years from 2007 to 2009) the number of consortia according to the centrality and profits dummies.
Contingency table between closeness centrality and profitability of consortia in the three years from 2007 to 2009

Contingency table between betweenness centrality and profitability of consortia in the three years from 2007 to 2009

Mann & Whitney's U Test between sales in the triennium 2007-2009, grouped according to the categories of consortia members. Asterisks indicate significance at less than 0.001 (***), 0.01 (**), and 0.05 (*) levels.

The Chi-Square Test shows that there is a strong relation between closeness centrality and profitability (p=0.007), while the Null Hypothesis cannot be rejected in the relation between betweenness centrality and profitability.
4.3 Hypothesis 3
In order to test the third Hypothesis we define the following two dummies:


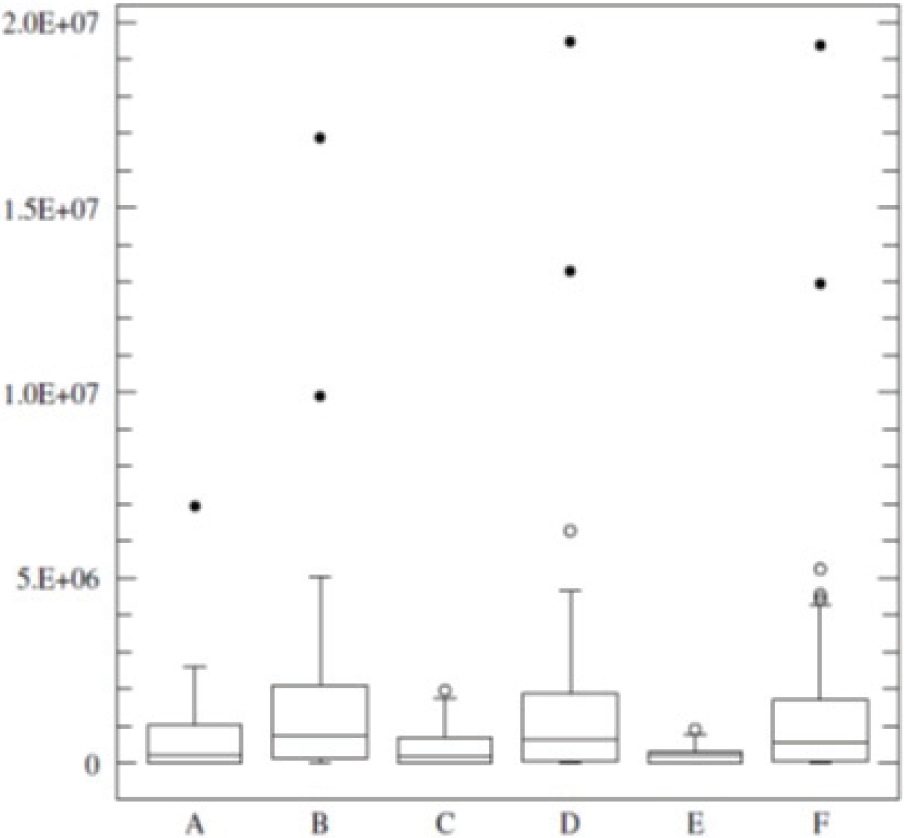
For each year in the triennium 2007-2009, and for both dummies, we separate the consortia into two groups according to the dummy values, then, we compare their sales values using a Mann-Whitney U Test. However, a descriptive analysis of the sample (see Figure 2 and Figure 3) shows that H3 cannot be verified. In fact, the median values of sales when, at least one company is a member of the consortia is on average 300% less than those of the others. Similarly, the median values of sales when, at least one non-academic public organization is a member of the consortia is on average 400% less than those of the others.

Boxplots of sales values achieved by consortia from 2007 to 2009, grouped according to dummy(com.)i. A: year (2007), dummy(com.)i.=1; B: year (2007), dummy(com.)i.=0; C: year (2008), dummy(com.)i.=1; D: year (2008), dummy(com.)i.=0; E: year (2009), dummy(com.)i.=1; F: year (2009), dummy(com.)i.=0
Boxplots of sales values achieved by consortia from 2007 to 2009, grouped according to dummy(n.a.o.)i. A: year (2007), dummy(n.a.o.)i.=1; B: year (2007), dummy(n.a.o.)i.=0; C: year (2008), dummy(n.a.o.)i.=1; D: year (2008), dummy(n.a.o.)i.=0; E: year (2009), dummy(n.a.o.)i.=1; F: year (2009), dummy(n.a.o.)i.=0
Thus, we apply the U-Test to verify if such differences are statistically significant or casual. Our alternative Hypothesis is now the opposite of H3: the median values of sales achieved by consortia without non-academic members will be higher than those achieved by other consortia.
In all cases, median sales of the groups without non-academic public organizations or private companies are higher than those with lower. The statistical significance of such results is very strong in all cases and so we can reject the hypothesis that the two samples come from the distribution with the same median and consider as verified the opposite of our original H3.
5. Limitations of the study
Our study's sample of consortia might be biased by its construction, which is centred on the Tor Vergata University of Rome. Therefore, our results will need further investigations in order to prove their external validity. Nonetheless, as discussed before, Tor Vergata participates in a relevant number of consortia, which are connected with almost every other Italian university, thus we expect future research to be in line with the results discussed here.
6. Conclusions
In our article we explored the relation between the social network as described by the members of 42 interuniversity consortia, and the economic performance of the consortia themselves. We calculated the closeness centrality and betweenness centrality coefficients for each consortium and gathered data concerning their turnover rates and profits in the triennium 2007-2009. The analysis consisted in the testing of three hypotheses.
In the first one, it was hypothesized that higher centrality coefficients are likely to increase the turnover rates of a consortium. We were able to reject the null hypothesis through Kendall's and Spearman's non-parametric correlation coefficients and through Mann & Whitney's U Test: all of them confirmed our alternative hypothesis with strongly statistically significant results.
In the second one it was hypothesized that higher centrality coefficients are likely to facilitate a consortium in reaching the break-even point. We were able to reject the null hypothesis for closeness centrality, but we could not verify any statistically significant result for the betweenness centrality.
In the third one it was hypothesized that the participation of non-academic organizations in interuniversity consortia is likely to increase their turnover rate. Surprisingly, our empirical evidence showed that the opposite hypothesis is true. Experts in the field suggest that a similar result may depend on intellectual property issues: when Italian private partners and universities cooperate, often the outputs of the consortium are prototypes or patents. Consortium agreements often give private members the right to exploit the consortium's outputs in order to make profits, paying some royalties to the consortium or to its members.
On the whole, we showed that high centrality coefficients can improve the performance of a consortium, both in terms of turnover rates and in term of the expected probability of reaching the break-even point. Our results reinforce those achieved by Kianto and Waajakoski [27] using a radically different approach (they found that inter-organizational social capital, assessed through interviews, enhances organizational growth in terms of turnover increase).
Future developments include the extension of our analysis to the entire population of interuniversity consortia, verifying the relations between centrality indicators and research performances in terms of number of publications, impact factors and citations of publications, number of patents, number of conferences organized, etc. These goals are challenged by the lack of reliable and organized data.
Footnotes
7. Acknowledgments
We wish to thank the Management Accounting Committee of the Tor Vergata University of Rome for disclosing their data and funding our research. Moreover we would like to especially thank Simone Gitto for his contribution to the analysis of the consortia's economic performance, Roberto Dotto and Paola Pasqualino for their support in the preparation of this article, Agostino La Bella, Ercole Angelucci and Cinzia Lazzari for their supervision.