
Abstract
Background
Citizen science is a growing practice in which volunteers, including non-scientists, conduct or contribute to research by collecting and analyzing data. The increasing importance of citizen science in the last years has led to an increased interest in detecting how citizen science can contribute to scientific advancements in different areas. Recent research shows that citizen science has become a means of engagement between scientist and the public, encouraging scientific curiosity and promoting scientific knowledge.
Methods
In this article, we report on how to apply computational analysis techniques to Twitter messages to reveal the impact of citizen science in health-related areas. The main objectives are (1) to characterize central topics of these discussions, and (2) to identify particularly important actors in these social media networks.
Results
For the topics, our findings suggest that sustainable development goals, technologies and health, and COVID-19 are those most addressed by the users. Other topics represented in the data are cancer, public health, mental health, and health and well being of sea and earth living creatures related to sustainable development goals.
Conclusion
Based on our results, those entities or actors who are most cited and retweeted are Twitter accounts of projects and not primarily individual professionals or citizen scientists.
Keywords
Introduction
Citizen Science (CS) can be described as the scientific work undertaken by members of the general public, sometimes under the direction of professional scientists or collaborating with them. However, there is no unique and commonly approved definition for CS yet, and this is still under discussion. 1 Since CS has experienced growth as a practice over the past decade, 2 the number of volunteers has increased and so has the use of new digital and web-based technologies. 3 The adoption of emerging technologies, alongside the usage of current technologies, allows a citizen scientist to collaborate, share, produce and measure data in a more accessible way, besides improving the communication and participation. 4
Social networks are an important medium of online collaboration widely used in the CS community and beyond. Social networks are described as web-based services where individuals can create a public or semi-public profile and share a connection with a list of users. 5 One of the main features of the social network sites is the social component, helping people connect in an informal way. Social networks have also become an important tool for business, science dissemination and as a reference to understand and study the trends, ideas, even feelings and thoughts of every user and therefore turning into a great opportunity to conduct studies even with new methodology. 6 Amid all the currently existing social networks, Twitter has a leading role as a broadcasting communication medium for researchers, stakeholders, organizations, etc. 7 The Twitter microblogging platform is used as a fast and open communication channel to share results, distribute news and updates and thus serves as an engaging tool in CS. 8 Every event happening in the world is likely to be discussed on Twitter by professionals, organizations and non-professional users and therefore susceptible to be taken up by the CS community if it fits in with existing lines of discourse.
When it comes to public discussions, nowadays health has become one of the most addressed topics, specially owing to the COVID-19 pandemic. In this context, we understand “healthcare” as the maintenance or improvement of health by means of diagnosis, treatment, prevention or the cure of diseases and illnesses (physical or mental). 9 The importance of both concepts is easily recognizable, hence there are projects aiming to gather information about people’s health or to communicate the latest discoveries in healthcare, among others.
In this study, we draw on a more general methodology of data analysis and a data corpus selected and harvested from the Twitter blogosphere. The primary selection criterion for this corpus was the relation to CS. In a first study, we have analyzed the associations of CS discussion with “sustainable development goals” (SDGs). 10 However, the same corpus of data that we are continuously extending by incorporating Tweets as they come in also shows a strong representation of discussions related to health and healthcare topics. In this new study, we aim at gaining more insight into discussions around health and healthcare on Twitter. For this purpose, we generate and model networks around users, trending topics and identify the main actors in these interactions. All the work undertaken in the previous research will be properly described in the research methodology section to introduce the analysis of the present study.
Our analysis has been guided by the goal to answer the following questions:
CS, health, and Twitter
CS is well known for being linked to environmental studies, biology and conservation, yet there are also many CS projects related to health, healthcare and health research. 11 Historically, there have been several examples of what we can call citizen science in healthcare, like women’s health studies or HIV-related activities, 12 Nowadays it is easy to find CS projects related to health, from data collecting or data processing projects, ranging from investigations related to the Parkinson disease or 3D mapping of retinal neurons to wildlife health in the Monkey health project or arboviral vector surveillance. 13 In the field of health and healthcare, Twitter data has been analyzed in areas such as the use of antibiotics, 14 monitoring the perception of 2009 H1N1 pandemic 15 or, more recently, analyses of communications on COVID-19 and the misinformation related to it by Shahi et al. 16 Beyond providing information, this social network site (alongside others) is believed to have the potential to change healthcare as we know it by Hawn 17 Some authors believe that in medical practice, for example, Twitter is the most popular way of communication, that it creates a collaborative atmosphere for researchers, patients, and physicians but misinformation is still the enemy to beat. 18 Accordingly, we should be able to use Twitter to learn more about the intersection of CS activities and health-related issues. This analysis starts with collecting and filtering data followed by analysis of content, including the identification of dominant tropics. It is also important to study the networks through which the actors/users are interconnected to detect specific subcommunities and their behavior. Such structural patterns have been studied for very different types of networks and they also exist in Twitter. These analyses unveil characteristics of information flow, content sharing as well as dominance. For Twitter, it was discovered that most of the discussion evolves around retweets, replies, supporting statements to the original tweets, and additional features. 8 In this study, we offer a view on the panorama of the CS community in Twitter and the conversation about healthcare and health-related areas. We scrutinize the data by means of social network analysis (SNA) and text analytic in order to know the most popular hashtags and the most important topics, also the networks formed by retweeting and citing users. All this information will lead us to understand the state and actors in the discussion facilitating the dissemination and could be of interest to project owners, other citizen scientist, stakeholders, and organizations.
Methods
Study design
This observational study is based on a continuous process of improvement and evolution that started for the first time we faced the Twitter data from the Citizen Science community. In the early stages of our project, we made a preliminary study of the tweets we were about to analyze. These tweets were harvested on the Lynguo platform 1 that provides access to the Twitter application programming interface (API) together with filtering functionality. Through LYnguo, we collected tweets about Citizen Science based on a list of keywords related to this topic. This harvesting of tweets has been ongoing since September 2020. The preliminary analysis consisted in downloading the available tweets, all of them containing words like “Citizen Science,” “citsci,” or hashtags related to CS. Then, we checked the amount of tweets available and we removed possible duplicates. Once the duplicates are out of our dataset, we identify those tweets that are original and others that are retweets. The retweets are easily recognizable as they are labeled “RT @User,” meaning that someone retweeted a tweet from that user. So, this first step became the initial process in every analysis, we wanted to perform in any different topic. This harvesting containing all the tweets about CS serves as raw data for potentially multiple purposes.
Inside this set of tweets, we can find several topics being discussed by all the members inside the CS community. In order to focus on a specific matter, we needed to find a way to isolate tweets from a certain subject. To accomplish this, we designed a filtering function based on keywords. These keywords are terms related to a specific subject. Applying this filter we extract the tweets containing those words and therefore, obtaining a dataset about the topic we want to analyze. What we are reaching with this process is a specialization that allows the proposal of specific research questions that, when answered, can potentially translate into a better knowledge of the community and also policy recommendations in different levels of the society.
Initially, we applied basic analysis techniques such as the hashtag extraction and count, the creation of networks based on the retweet relation and the analysis of the users based on their retweeting activity. These, although traditional, provide a good insight into the activity of the community. Hashtags are an important part of the text 19 since hashtags give a category or topic label to the text helping to identify different subjects. 20 Retweets are also very important since this feature provided by Twitter allows the users to spread information and generate connections and subcommunities. These connections lead to the creation of the aforementioned networks of users from which the analysis of centrality and topological features give information about the importance of the users. All these analyses are present in our first study about eLearning.
To deepen and advance our analysis, we included modern Machine Learning (ML) approaches. This ML process quickly became an essential part of our study due to the valuable information they offer. The main techniques used are the Language detection and the Topic Modeling.
Besides, we introduced some new ideas as the use of the Twitter API to complement the data obtained from Lynguo. From the API, we are able to collect information such as the followers. Analyzing the followers helps us understand who are the top users for content creation or information spreading.
The combination of all the previous techniques and the results they offer can lead to the complete understating of the state of the discussion around any topic, so their automatized use and the visualization of the results is the path to follow to gain knowledge around any topic of interest. This stage of the study design is contained in our study about the conversation around sustainable development goals (SDGs).
Regarding our specific interest in health and eHealth issues, we wanted to provide a panoramic view of the conversation around it. This interest arose since some authors have highlighted that topics such as health and healthcare are discussed both in citizen science groups and in Twitter. 21 It must be noted that not only tweets have been analyzed, but also the presence of specific projects and professionals. 22 As it was previously stated, the study design is in constant revision and improvement, so in the present study, we wanted to enhance some of the techniques that had been previously used. For example, the Topic Modeling has been revised and now in the study, we use bidirectional encoder representations from transformers (BERT) specially tuned to detect topics on Twitter. Besides, we analyze the networks formed by other means of connections as the mentions and the interconnection of hashtags from which we can initially differentiate topic groups.
With the processing pipeline, we created and the new additions and improvements, we start by downloading the tweets from Lynguo to obtain all the tweets collected from 30 September 2020 until 7 September 2021.
Following the stated about the preliminary analysis, we found that this initial collection was composed of 365,609 tweets. There were 149,227 original tweets, being the rest retweets. One tweet can appear more than once if it is a retweet as several users can retweet it or if it was written a few times. There was a total of 103,432 unique users. We also found 44,687 tweets mentioning one or more users.
But we needed it to be about health and healthcare, so we proceed to apply the filtering function. The initial dataset previously described was filtered by using health and healthcare keywords. These were extracted from a selection of words related to healthcare (complemented with their homologous in other languages due to the presence of tweets in other languages), such as healthcare, electronic health record (EHR), EHRs, E-Health, E-Health networks, or health. Reaching 114 total keywords.
Alongside these keywords, we also selected the “Grouping” and “Classification” keywords from the dataset of taxonomy that the National Uniform Claim Committee (NUUC) 23 provides. The selection of these keywords from the NUCC was based on the purpose of this voluntary organization, since they provide a standardized data-set for use in an electronic environment, but applicable to and consistent with the evolving paper claim form standards.
With the first set of keywords that we selected alongside those from the NUUC, the final number of keywords ascended to 359 words. This filter aimed to select the rows of our dataset that contained one or more of these keywords inside the tweets. Once we completed the filtering the new filtered dataset would contain tweets about health and healthcare. This dataset about Health and Healthcare was used to apply on it all the different techniques previously described to understand the conversation and possibly turn into policy recommendations inside this specific topic. All the different techniques will be properly described in their own subsections so as to explicate the processes behind them.
In summary, the design of this study can be depicted in a workflow chart, as shown in Figure 1. It can be seen how after the filter from the dataset containing tweets presumably about health and healthcare every analysis is performed from that collection of tweets.
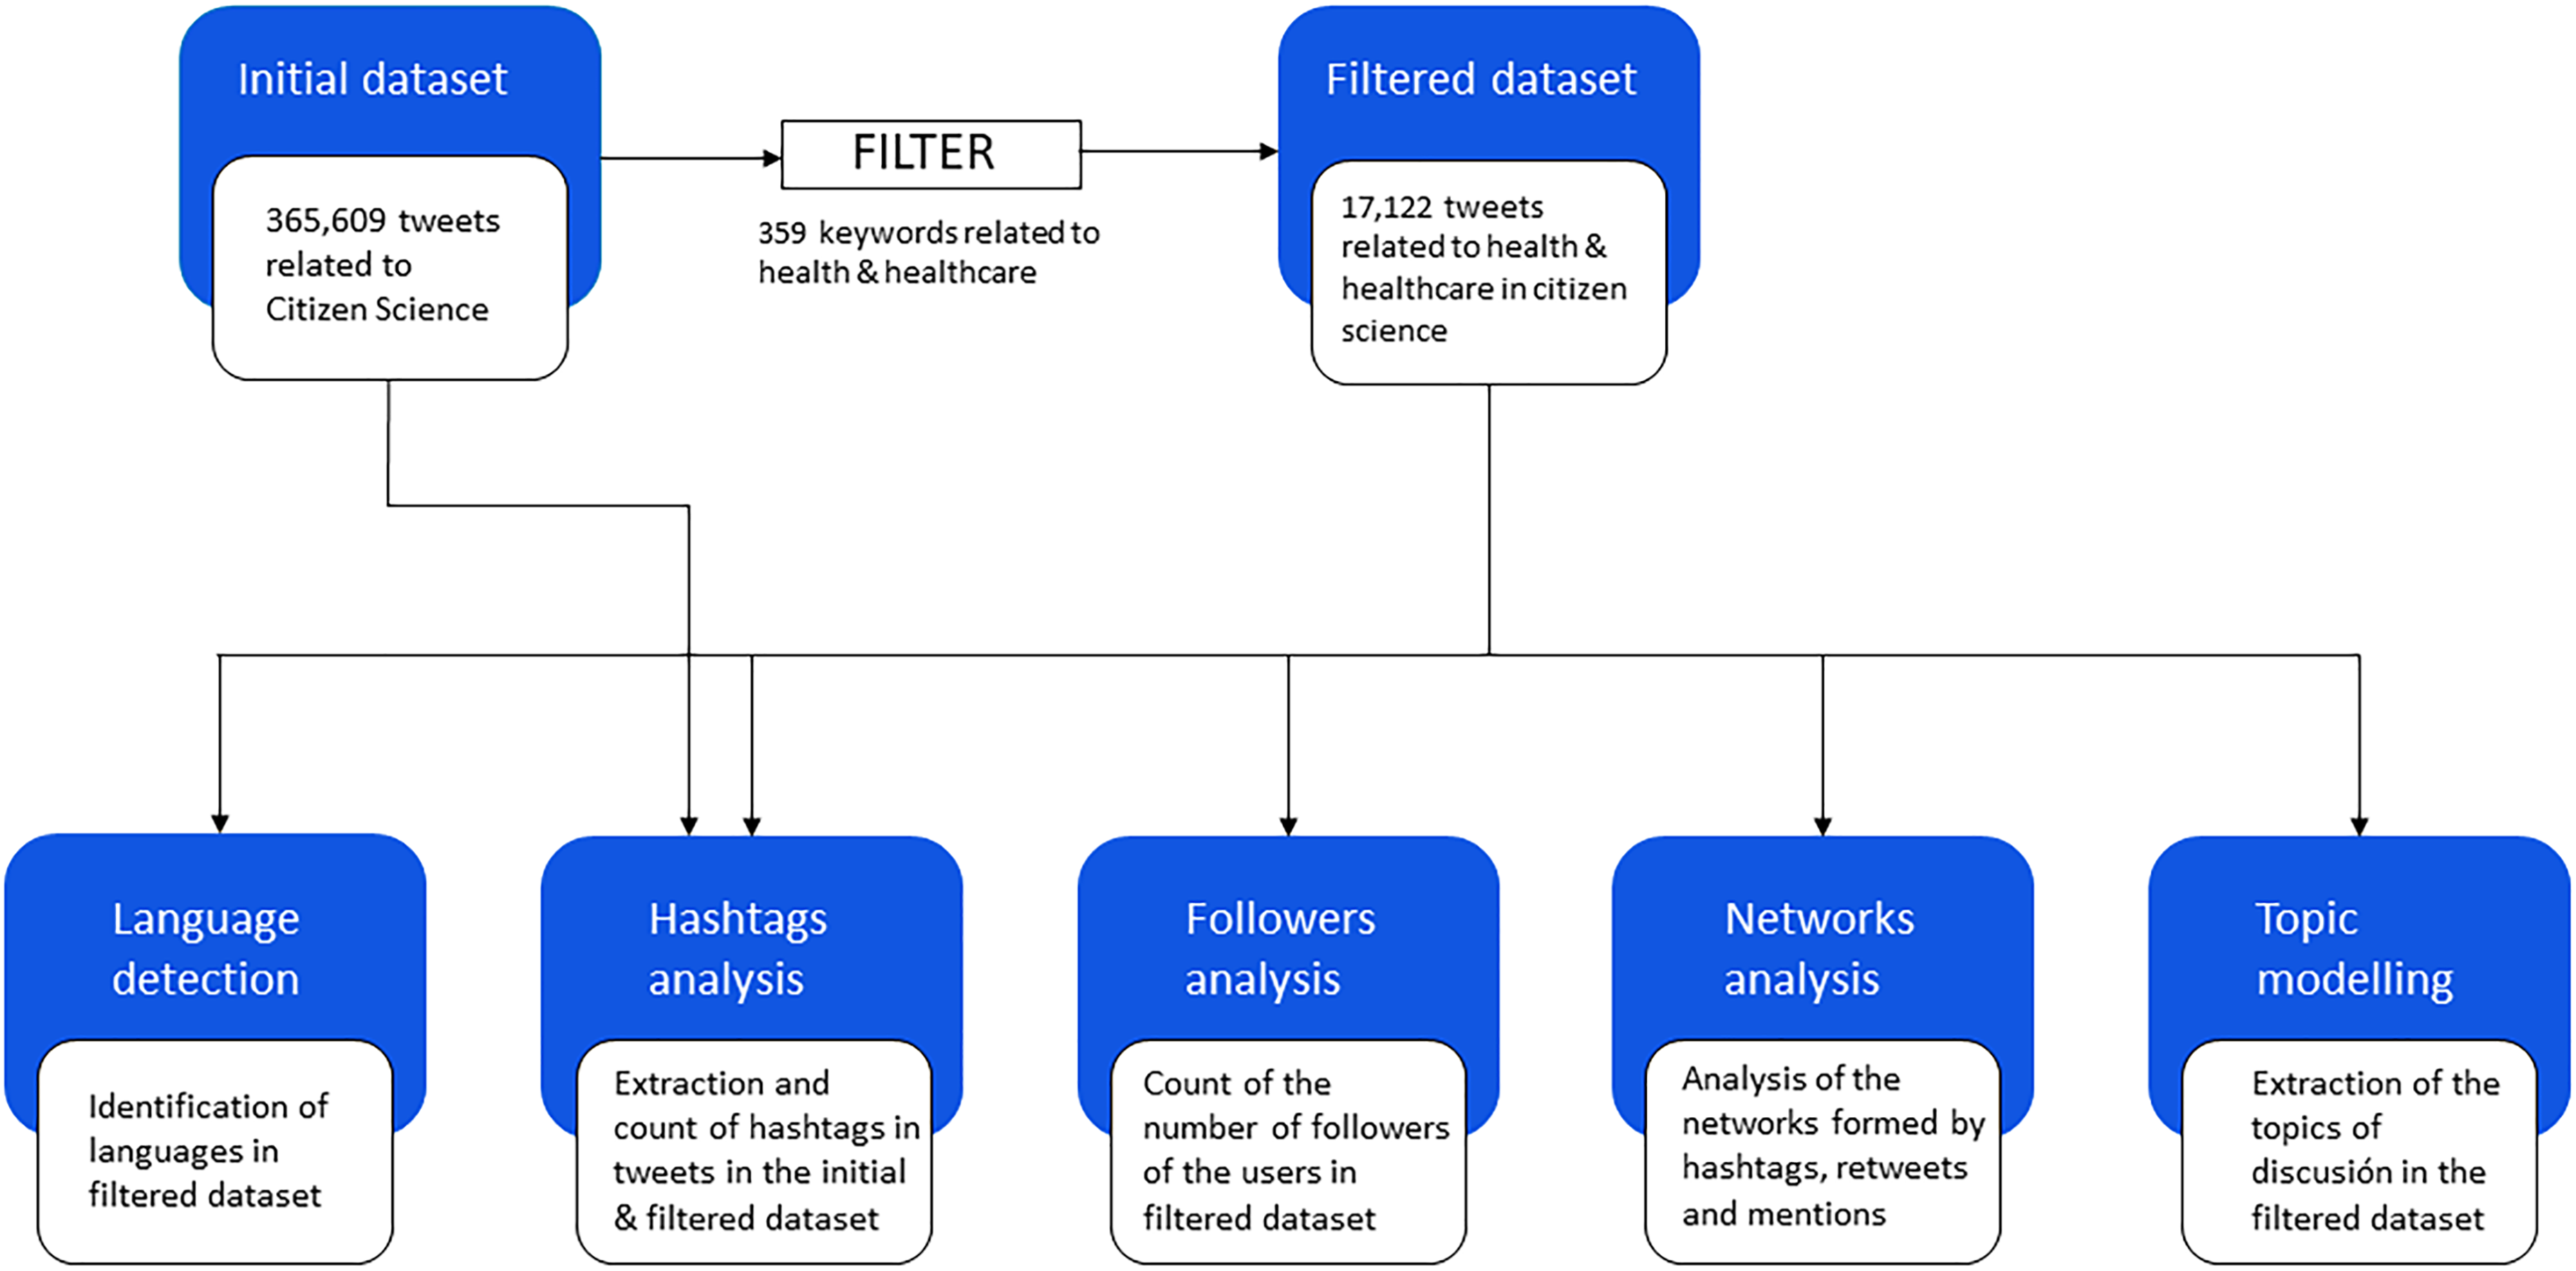
Workflow of the present study.
Language detection
In order to discover the number of the different languages in our filtered dataset and therefore answer to Q2, we trained an natural language processing (NLP)-based multinomial Naive Bayes classifier. To train the model 10,337 texts were used, in 17 different languages: Danish, English, Italian, Tamil, Turkish, Malayalam, Kannada, Russian, Portuguese, Hindi, Dutch, Spanish, French, German, Swedish, Arabic, and Greek.
Hashtag analysis
Twitter features the use of hashtags (# symbol, followed by a single word or several words written together) in order to classify tweets or so as to promote ideas, topics and/or people. The use or retweet of one or more hashtags connects people as they write about the same topic showing a concern about the subject. We performed an analysis of the hashtags in the initial dataset and in the tweets related to health by counting the occurrences of each word preceded by a hash symbol and by analyzing the usage throughout the time. We also represented the connections between hashtags based on their co-occurrences in the form of another network that allows for analyzing semantic or topical relations. This new technique will be properly explained in the following sections.
Follower analysis
We extracted the number of followers of every user in our filtered with a health keywords dataset. We believe that the number of followers shows, in a way, how important an user is as the info that it provides may be interesting, thus, the people follow it.
To count the followers of every user present in our dataset we performed a query for the followers_count through the Tweepy API.
Network analysis
In this research, we present several networks formed by some features extracted from the tweets. We will show the connections between hashtags as it is quite usual to find more than one hashtag in each tweet and, therefore, different hashtags will be connected to others depending on the topic, event, or also people they talk about. This behavior in the end will form a network of interconnected hashtags. In order to analyze which hashtags are connected to others we treat the connections inside one tweet as the edges of a graph and extracted them from the texts in our dataset.
Another network was created with the mentions that we find in the tweets. When using Twitter, mentioning and retweeting are the two main modes of user–user interaction. 24 If a user considers that a piece of information could be relevant to other users, he/she cites then within a tweet to capture their attention.
To obtain the mentions we extracted from the filtered dataset those tweets that contained a mention inside them (@+username). The edges of the network were created by linking the username from the User column of the filtered dataset to the @+username inside the tweet written by that user. To represent the network, we present a directed bipartite graph. By using the bipartite approach we present unique nodes divided in the direction of the mention, the first set of nodes represent the users who mentions and the second set the mentioned ones.
The last network is built with the retweets. Some users tend to congregate other users around them and CS communities behave the same way. Normally, the central users of that community receive high amounts of retweets, but it is not reciprocal. To analyze this aspect we extracted the links between users that retweet others and retweeted users. In order to obtain the data about retweets we selected those tweets that were retweets (marked as RT @username :) and created the edges linking the username from the User column to the @username from the retweet extracted from the text column. We presented it in a directed bipartite graph once more being the first set of nodes the users who retweet and the second set of nodes the users that have been retweeted a tweet. In order to obtain the data about retweets
For all the networks in this analysis, we have applied the method of
The “coreness” of a given node X corresponds to the maximum

Representation of coreness.
For the additional detection of cohesive subcommunities, we applied the Louvain method. 27 The basis of this method is to the first find the small communities by optimizing modularity and repeating the grouping nodes.
For the network of retweets, we performed an analysis of the graph structure, focusing on the different values from the nodes of our directed network, aiming to measure the “influence” of the users in our filtered dataset. The analysis grounds in the Indegree, Outdegree, and Betweenness. 28 With the Indegree we can see how many times a user has been retweeted. The Outdegree tells us how many times a user has retweeted other users. Finally, the Betweenness shows how many times a node (account) is in the middle of the flow of information, indicator of being a bridge, a strong connection between others in our network.
Topic modeling
Topic modeling is an unsupervised learning technique to identify patterns and relationships between texts 29 widely used in different fields. The importance of this technique in social network analysis lies in the possibility of unveiling what are the users talking about, the trends or the most important documents in a set of text. 30 Thus, we decided to perform the analysis using the Bertopic model, a topic modeling technique that combines BERT NLP models with a class-based term frequency-inverse document frequency (TF-IDF) to create easily interpretable clusters that are the topics. 29 The decision of using this model in this study instead of the latent dirichlet allocation (LDA) model 31 or Non-negative matrix factorization (NMF), 32 which were used in the previous study and are well known and documented, resides in the easiness when tuning the BERT model in comparison with other models. Also, another feature that stands BERT as a good choice for SNA is the sentence embedding that it offers.
Sentence embedding is a technique that represent entire sentences and their semantic information as vectors, making it more easily understandable for machines. 33
The way of applying Topic Modeling is described as follows: We started by cleaning the corpus from stopwords, punctuation, and symbols (e.g. converting the hashtags to normal words). Once we got the corpus clean from undesirable elements we created the model selecting the following parameters: we created a multilingual model to fulfill the language parameters, for the top n words, we decided to select the typical representation of 10 and after that we left the rest of parameters as default.
The only exception came with the parameter min topic size since the minimum size of the topic can negatively or positively affect the number of tweets that are left unclassified, but creates a lower number of topics which is easier to manage.
We tried topics sizes of 100, 50, 20, and 10 (default) obtaining the best performance with a topic size of 10. The number of topics detected with this model increased to more than 300, which is understandable since the data contains tweets collected during a year so a large amount of topics was something expected. In this situation, the best option was to take advantage of the parameter reduce topics. Each topic has its own vector extracted from a class-based TF-IDF procedure, using this we reduce the number of topics by iteratively finding the most similar topics and merging them. After the reduction we obtained 20 topics.
For the analysis, first we decided to check the intertopic distance to determine how different the topics were, with this purpose we chose to get the visualization of intertopic distance alongside the extraction of the words that represent the topic and help the clustering, known as keywords.
Results
The starting point on this study was to first identify conversations about health and healthcare in Twitter. The first step once we had explored the initial dataset, the one with the tweets talking about CS, was trying to find a text that talked about health and healthcare. Applying the filters explained in the subsection “Filtering process” we found that 17,122 tweets contained discussion about health and healthcare. This represents a 4.7% of the full data-set described in subsection “Data structure.”
In these filtered tweets we can find 7964 unique users and 6331 unique tweets. There were 2960 tweets that mentioned one or more users. The number of tweets was over our expectations given that CS is more oriented to other areas. 11
In order to determine whether there is a diversity in this conversation we decided to make use of the NLP-based model to unveil the languages of the health texts in Twitter.
The main languages found were English (73.7%), German (13.1%), French (5.62%), Spanish (5.13%), Dutch (1.73%), Italian (0.37%), Portuguese (0.16%), Swedish (0.13%), and Danish (0.07%). English is the predominant language, nothing unexpected since it is the most frequent language in science and science dissemination.
In the light of these results, it can be observed that inside the filtered dataset we find tweets related to CS, health and healthcare, different users and mentions, and therefore, we obtained a partial answer to RQ1.
The results of the language extraction suggest that people from diverse countries in Europe are involved in the conversation, although English is the predominant language in our filtered data-set. So, it appears to be a multilingual/international conversation around health and healthcare inside the CS community.
With the aim to answer to the RQ2 we analyzed the presence and use of hashtags in the dataset and in the filtered dataset.
When analyzing the initial dataset we found 1,059,463 hashtags, obtaining a number of 30288 unique hashtags (removing every duplicated hashtag). Inside this initial dataset, we isolated those texts that were retweets and found inside them 582,330 hashtags, 19,789 of them were unique. Also, outside those retweets (texts containing mentions or plain text) we found 477,454 hashtags, being 29,435 unique hashtags.
Knowing the total amount of hashtags in our initial dataset, we wanted to check which ones were the most used hashtags. In Figure 3, we can see the 10 most used hashtags. #Earthquake is the first one followed closely by #SDGs. Then we find #seismograph and #openscience with around 2000 less appearances than the others. If we continue we find #communityscience, #biodiversity, #opendata, or #scicomm. When searching for hashtags there is one inconvenience or difficulty, some hashtags are over-represented due to bot accounts that repeat them many times every day. For example, #earthquake and #seismograph could be nurtured by bot accounts tweeting information from earthquakes detection. Prior to the visualization we removed some other hashtags with more than 35,000 appearances that come from bot accounts registering wind and pollution.

Top 10 hashtags in the initial dataset.
If we focus on the filtered dataset we find 50,439 hashtags, and when extracting all the occurrences of hashtags we removed those which were duplicated and obtained a number of 4135 unique hashtags. In the retweets, the count scales up to 36,938 with a number of unique hashtags of 2749. Inside the tweets that are not retweets (containing mentions or plain text) we find 7525 hashtags, 2262 are unique.
The number of unique hashtags in the retweets and outside them is quite similar, when counting the repeated ones the multiple appearances of the retweeted tweets augment the count of hashtags.
Once we know the total amount of hashtags in the filtered dataset it is time to discover which are the most used hashtags. In the total count, represented in Figure 4, we can find that #SDGs is the most frequent one with 878 appearances, followed by #openscience, #health, and #scicomm with around 600. Then we find #covid19, #digitalhealth, or #publichealth with more than or almost 400.

Top 50 hashtags in the filtered dataset. Graph represents the hashtag name with the number of appearances.
If we only count those hashtags that have been retweeted the situation is similar as presented before. The most retweeted hashtag is #SDGs, again with a large difference with the rest, as shown in Figure 5.

Top 10 most retweeted hashtags in the filtered dataset.
The following hashtags are the same as shown before, the only difference is the position where they appear. For example, #scicomm is more retweeted than #health and #digitalhealth is more retweeted than #covid19.
In all the cases, we can see that #SDGs is the most used hashtag. This can be understood according to the fact that some of the development goals are related to health, SDGs such as SDG3. The goal here is to provide and ensure healthy lives and promote well-being for all at all ages.
All these hashtags of the filtered dataset have been appearing, used and retweeted from 30September 2020 to 7th of the same month of the year 2021, so it would be normal to find fluctuations in their presence through the days and months. In addition, the happening of some events could trigger a higher use or retweet of these hashtags.
To analyze the evolution of the use of hashtags through the time we counted their appearances in the texts based on the dates of publication of the tweets or the date of a retweet. This results in two graphs, one containing the evolution of the use of hashtags and other containing the evolution of the retweeted hashtags (hashtags inside the retweeted texts). These two graphs show in X-axis the date of publication or retweet and in the Y-axis the number of times the hashtag has been used or retweeted. Each hashtag is assigned a color, the line fluctuates in the Y-axis indicating the appearances or retweets.
In Figure 6, we see the evolution of the use of the 10 most retweeted hashtags. The evolution of the hashtags is very similar with the exception of the hashtag #health. The green line, which corresponds to #health, always presents higher values in the Y-axis. Anyways, #dhpsp, #stem, #covid19, or #telehealth also have different high peaks of usage.
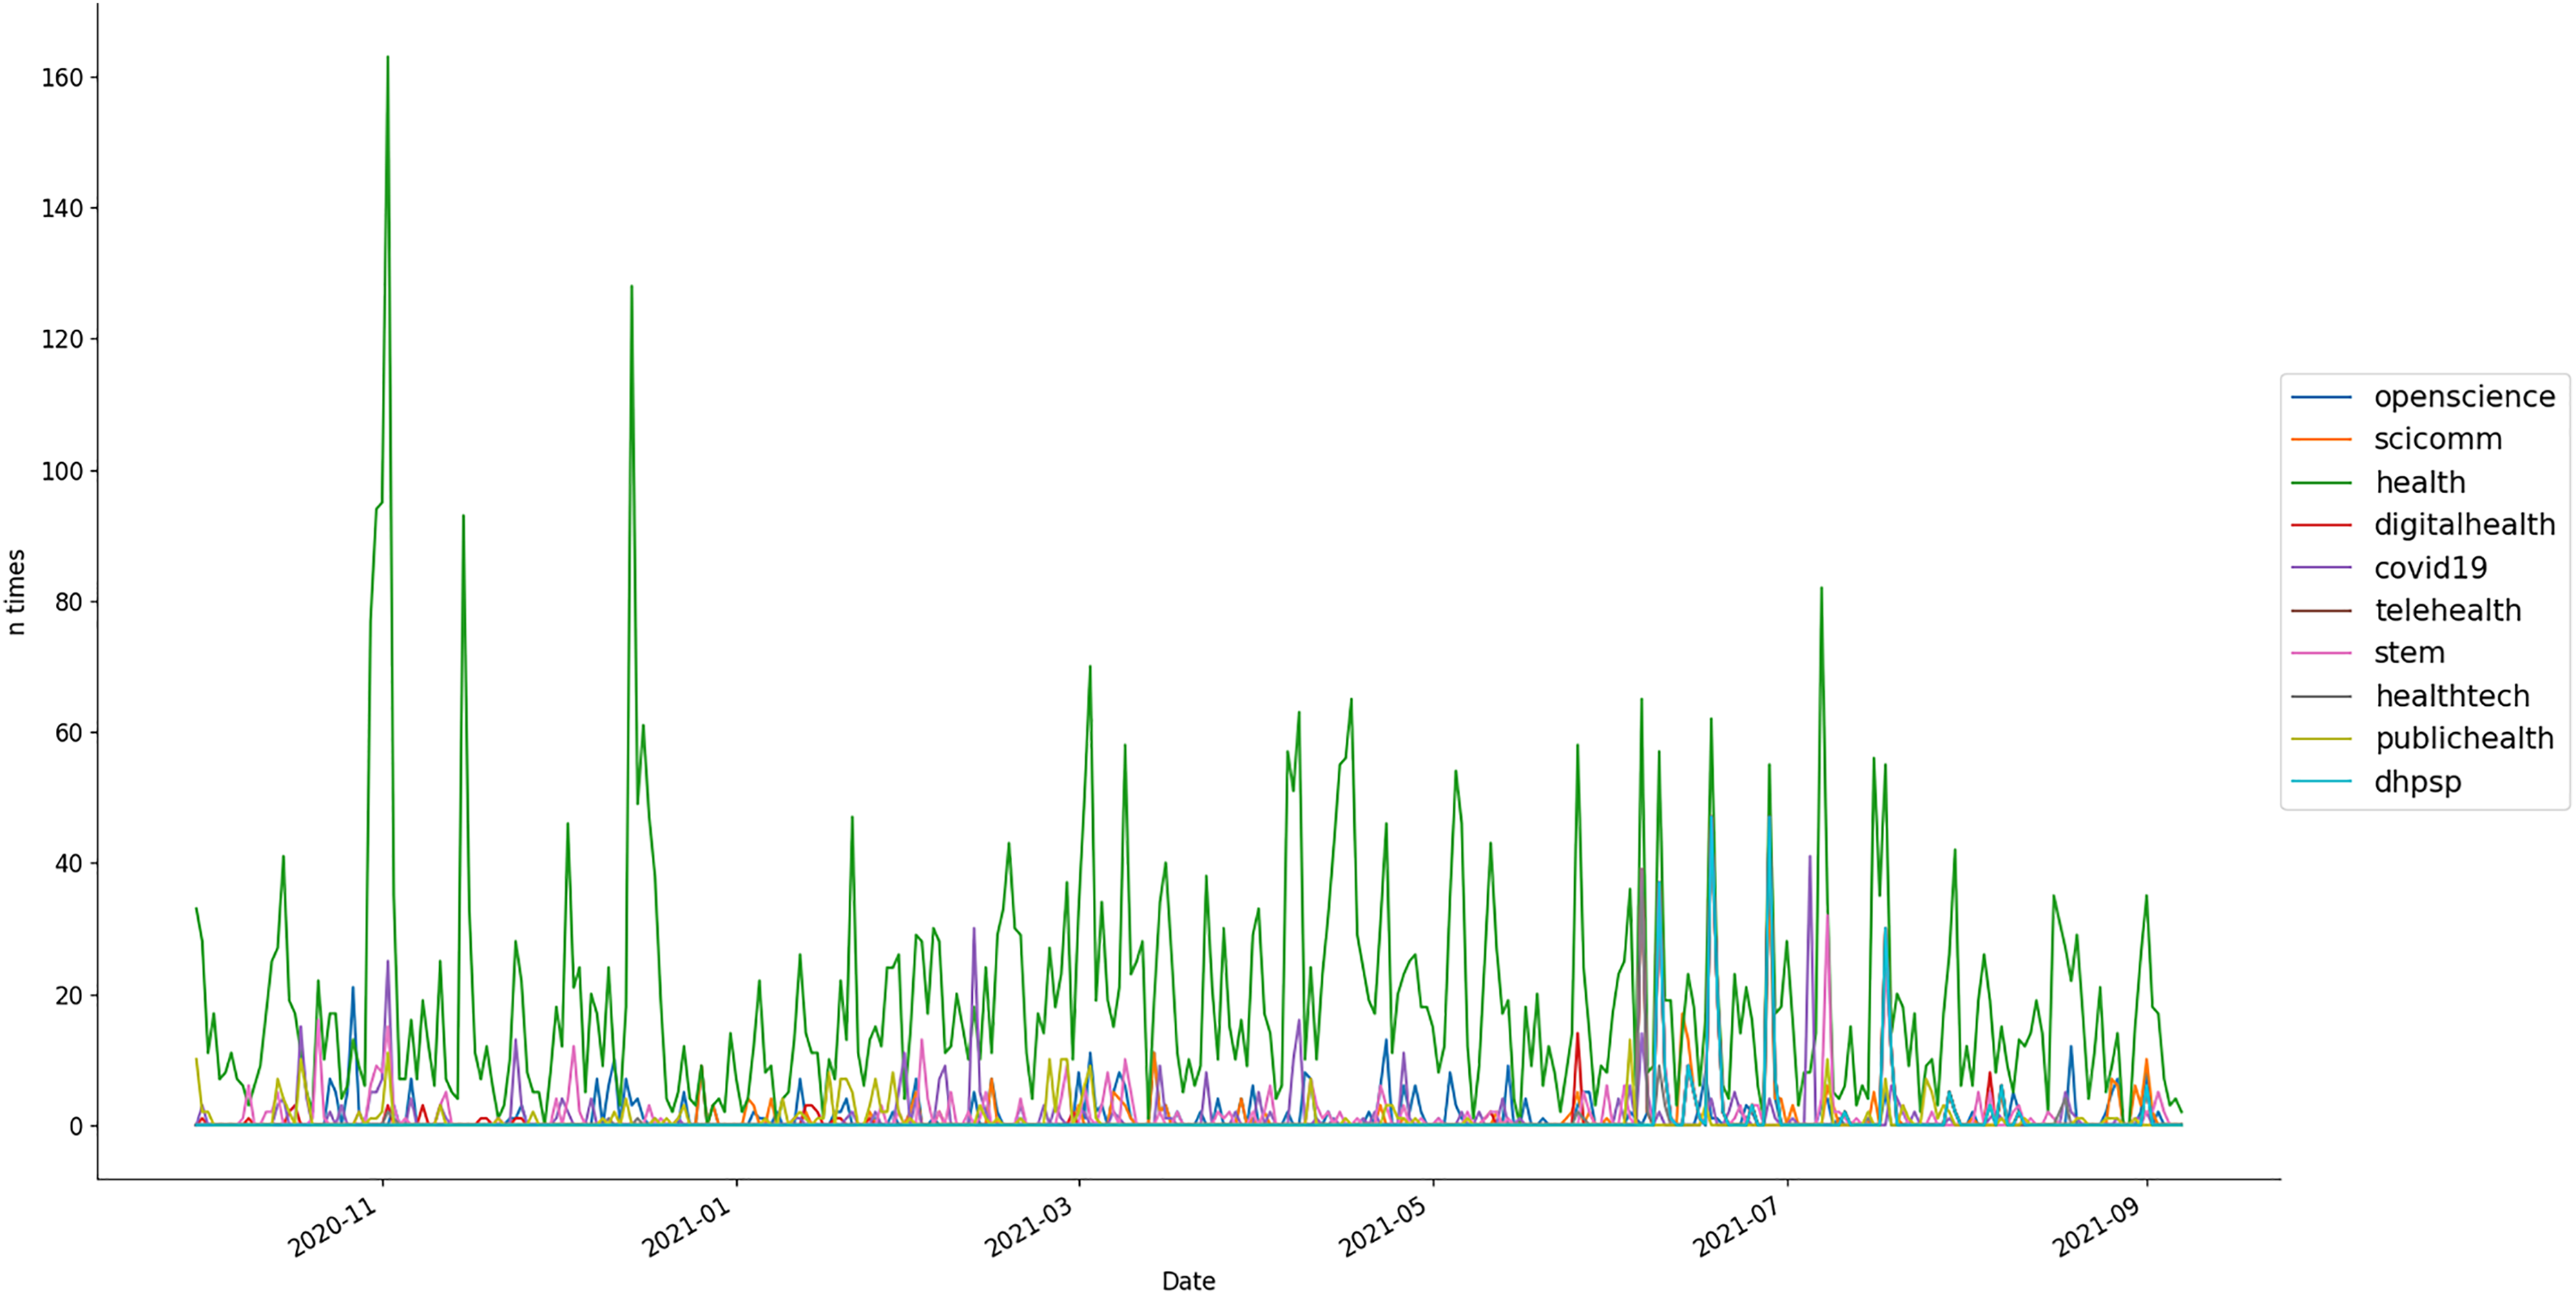
Temporal evolution of the top 10 retweeted hashtags in the filtered dataset.
When counting the use of hashtags, in Figure 7, it can be seen that #health again has the higher values in the Y-axis, meaning that through the time it is the most used one. Paying attention to the rest of the hashtags, #openscience and #stem have the highest peaks in several months. We see a great increment of use of the hashtag #citscihelvetia2021 in January 2021, this is due to the use of the hashtag in the days of this conference (14 and 15 January 2021). The rest of the hashtags have more discrete values, with the exception of #scicomm which almost equalize the values of the other three hashtags. #openscience has an increase in use between December last year and January of 2021. After that #health and #monitoring have the higher peaks in use through the rest of the year.

Temporal evolution of the top 10 used hashtags in the filtered dataset.
It is quite usual to find more than one hashtag in each tweet and, therefore, different hashtags will be connected to others depending on the topic, event, or also people they talk about. This behavior in the end will form a network of interconnected hashtags.
In order to analyze which hashtags are connected to others we treat the connections inside one tweet as the edges of a graph and extracted them from the texts in our filtered dataset. The resulting graph contained 24,934 edges and 5183 nodes.
The graph formed by the hashtags returned a number of 23 cores. The maximal k was 26, so each node with a degree lower than 26 was trimmed from the graph. This allows us to visualize a graph containing 47 nodes as shown in Figure 8. The redder the nodes the more times this hashtag has been used with other hashtags.
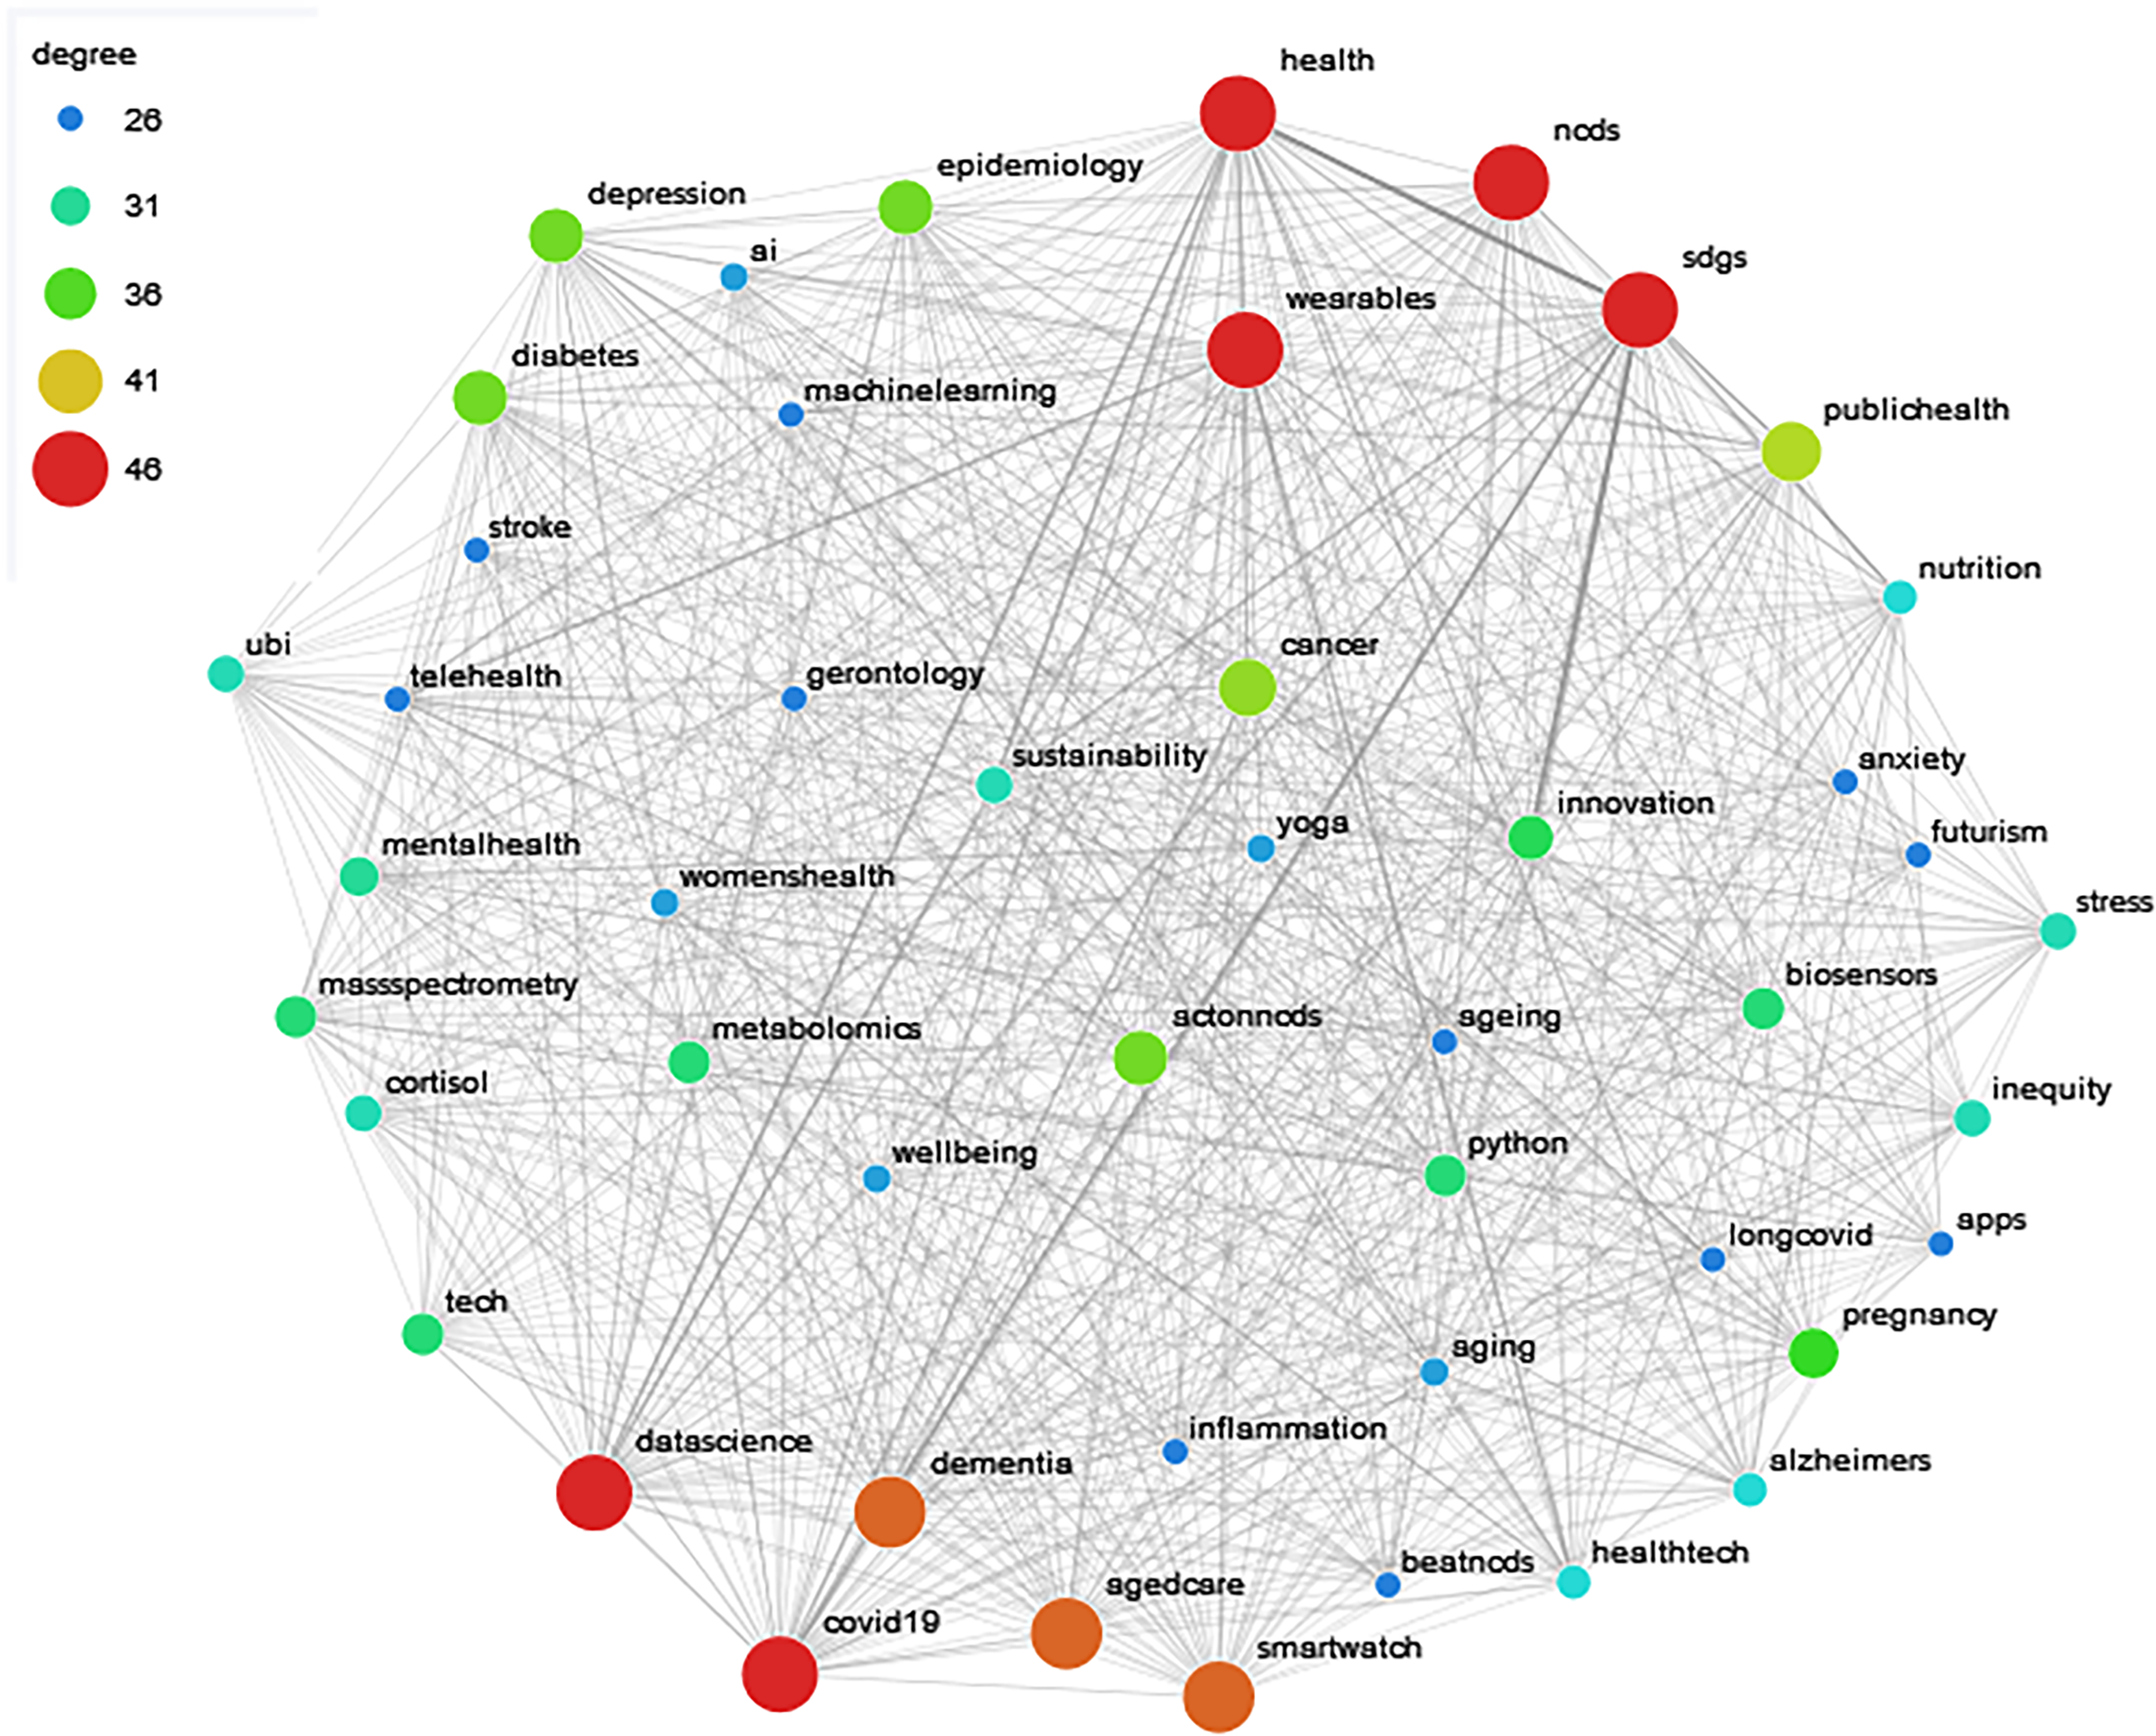
Main core of the connected hashtags graph.
The main nodes are the hashtags #SDGs, #health, #ncds (which stands for non-communicable diseases), #wearables, #datascience and #covid19. In the graph, we can see how hashtags related to health, healthcare, mental health, techonologies, IT, development goals, and medicine fields are highly connected between them.
To discover the topics of discussion and answer the RQ3 we applied Topic modeling.
For the analysis first we decided to check the intertopic distance to determine how different the topics were, what can be seen in Figure 9. According to the graphic there are three groups, each group presents a high similarity between the topics inside them but they differ between groups. Then we see a small group of two topics that are very similar.
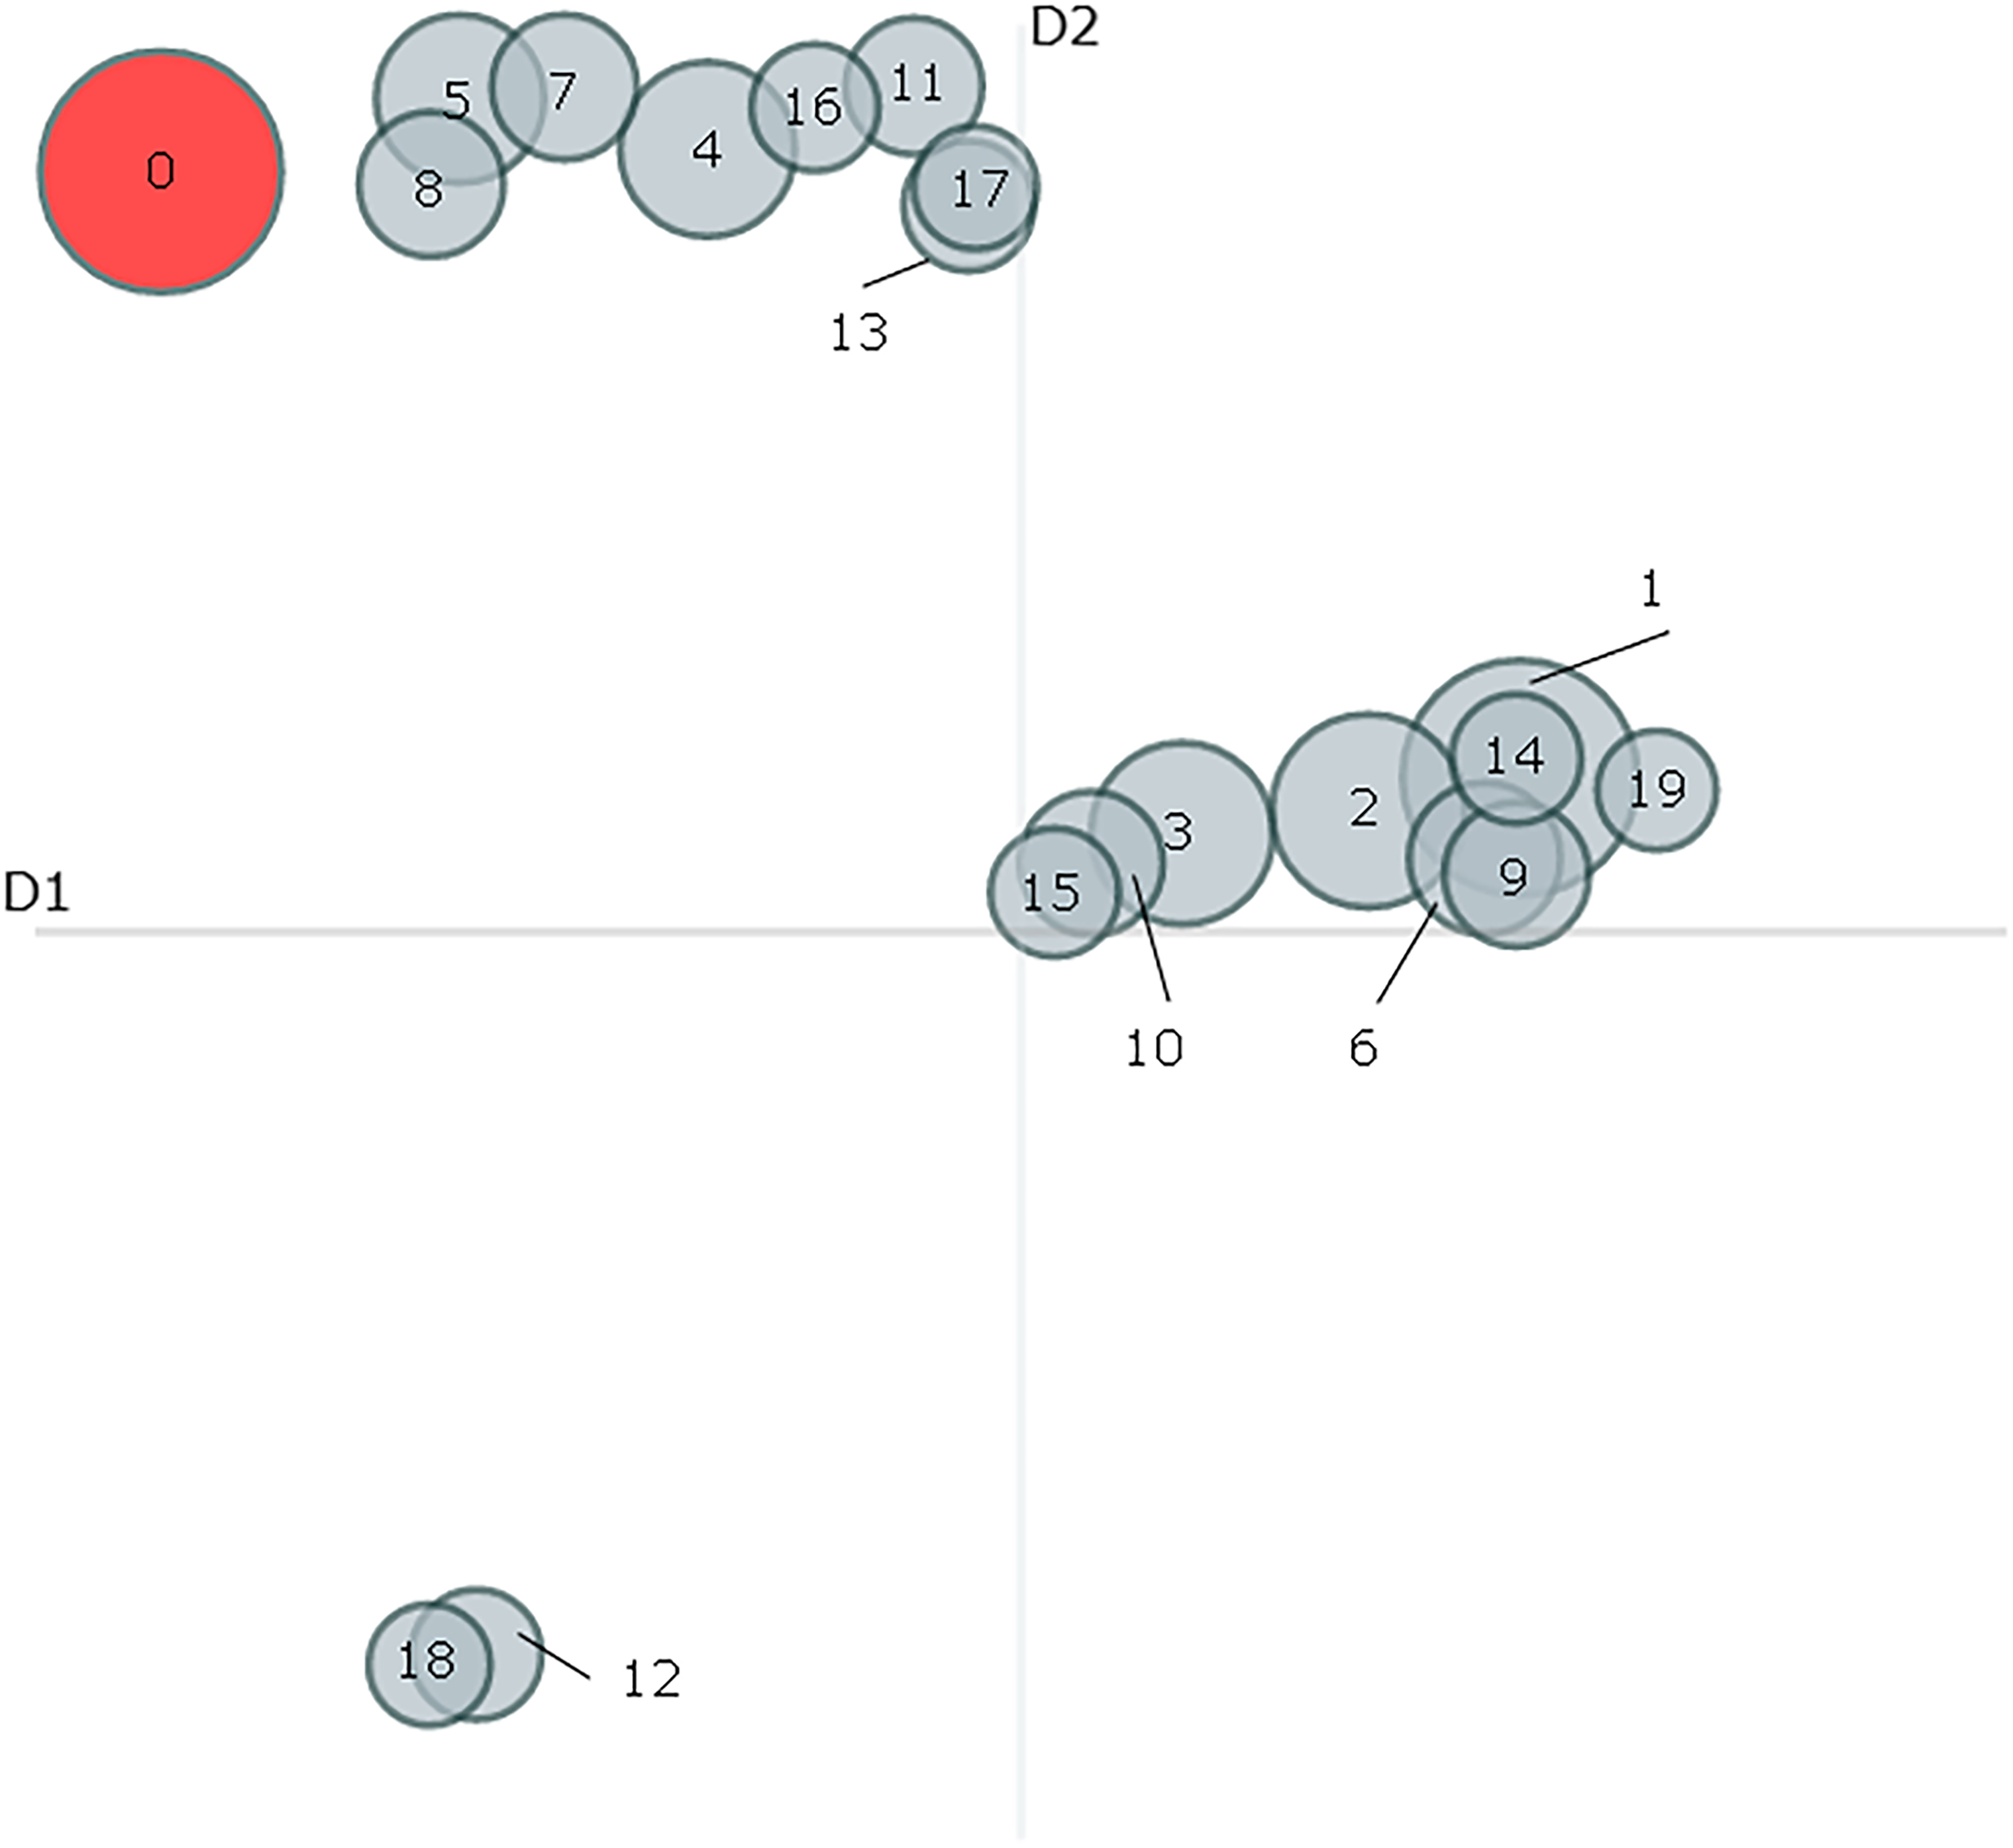
Intertopic distance map.
We present a complete list of the different topics alongside a name for the topic and a description.
Besides, we provide the complete lists of keywords, those that are the most important inside the topics, at the end of the document given in Table 3.
With this insight in the 20 different topics we have a better knowledge of what is each topic about. We find topics directly related to health like Mosquito Alert, Mental disorders, 100 days of code, Healthy diet, DHPSP, Mental disorders awareness, Pollution and Health, Pollution and sustainable cities, Covid-19, Gamer for genomics, and Alzheimer monitoring but in different areas of health and healthcare. DHPSP is the one most related to healthcare. Mental health has a great presence through the topics. The rest of the topics address health in a not so directed way through environmental problems, which are linked to CS. We found particularly surprising that, even though there is a whole topic about the COVID-19 pandemic its presence in the dataset is not as large as expected as it will be described in the next analysis.
Finally, we checked the amount of tweets that belong to each topic. The majority of tweets belong to Mosquito Alert and Mental disorders with around 1750 tweets each one. 100 days of code, Research of rare diseases, and Water sanitation had around 1000 tweets each one. Then, the rest of the topics were composed by 600 tweets each one.
It is also interesting to analyze how topics evolve over time. According to the general topics, depicted in Figure 10, we see how Mosquito Alert has the highest frequency in our dataset with Mental disorders which has the two highest peaks. Mosquito Alert reaches a peak in early March 2021 and suddenly falls to its lowest point in time. This peak could be due to the celebration of a conference about Mosquito Control in early March. Those high peaks of Mental disorders could answer to the happening of several webinars, mental health conferences in those dates such as Mental Health in light of COVID-19 Virtual Summit (December 2020) and Mental Health and Human Resilience (May 2021).

Temporal evolution of the topics.
Conferences and seminars increase the use of hashtags and the number of tweets in a topic, but we should not discard other factors, such as Government decisions, discoveries, etc. 100 days of code is the third one in frequency, it also surpasses Mosquito Alert in early May 2021 but only for a small time. The rest of the topics remain more or less the same during the dates showed.
As in every social networking site, we tend to think that on Twitter those that could be considered most important are the accounts with a high number of followers. By means of the Tweepy API we checked the number of followers of the accounts appearing in our dataset. In Figure 11, we can see the top 10 accounts with more followers on a logarithmic scale, this because @nature has a very high number of followers (more than 2 million followers), which affects the visualization.
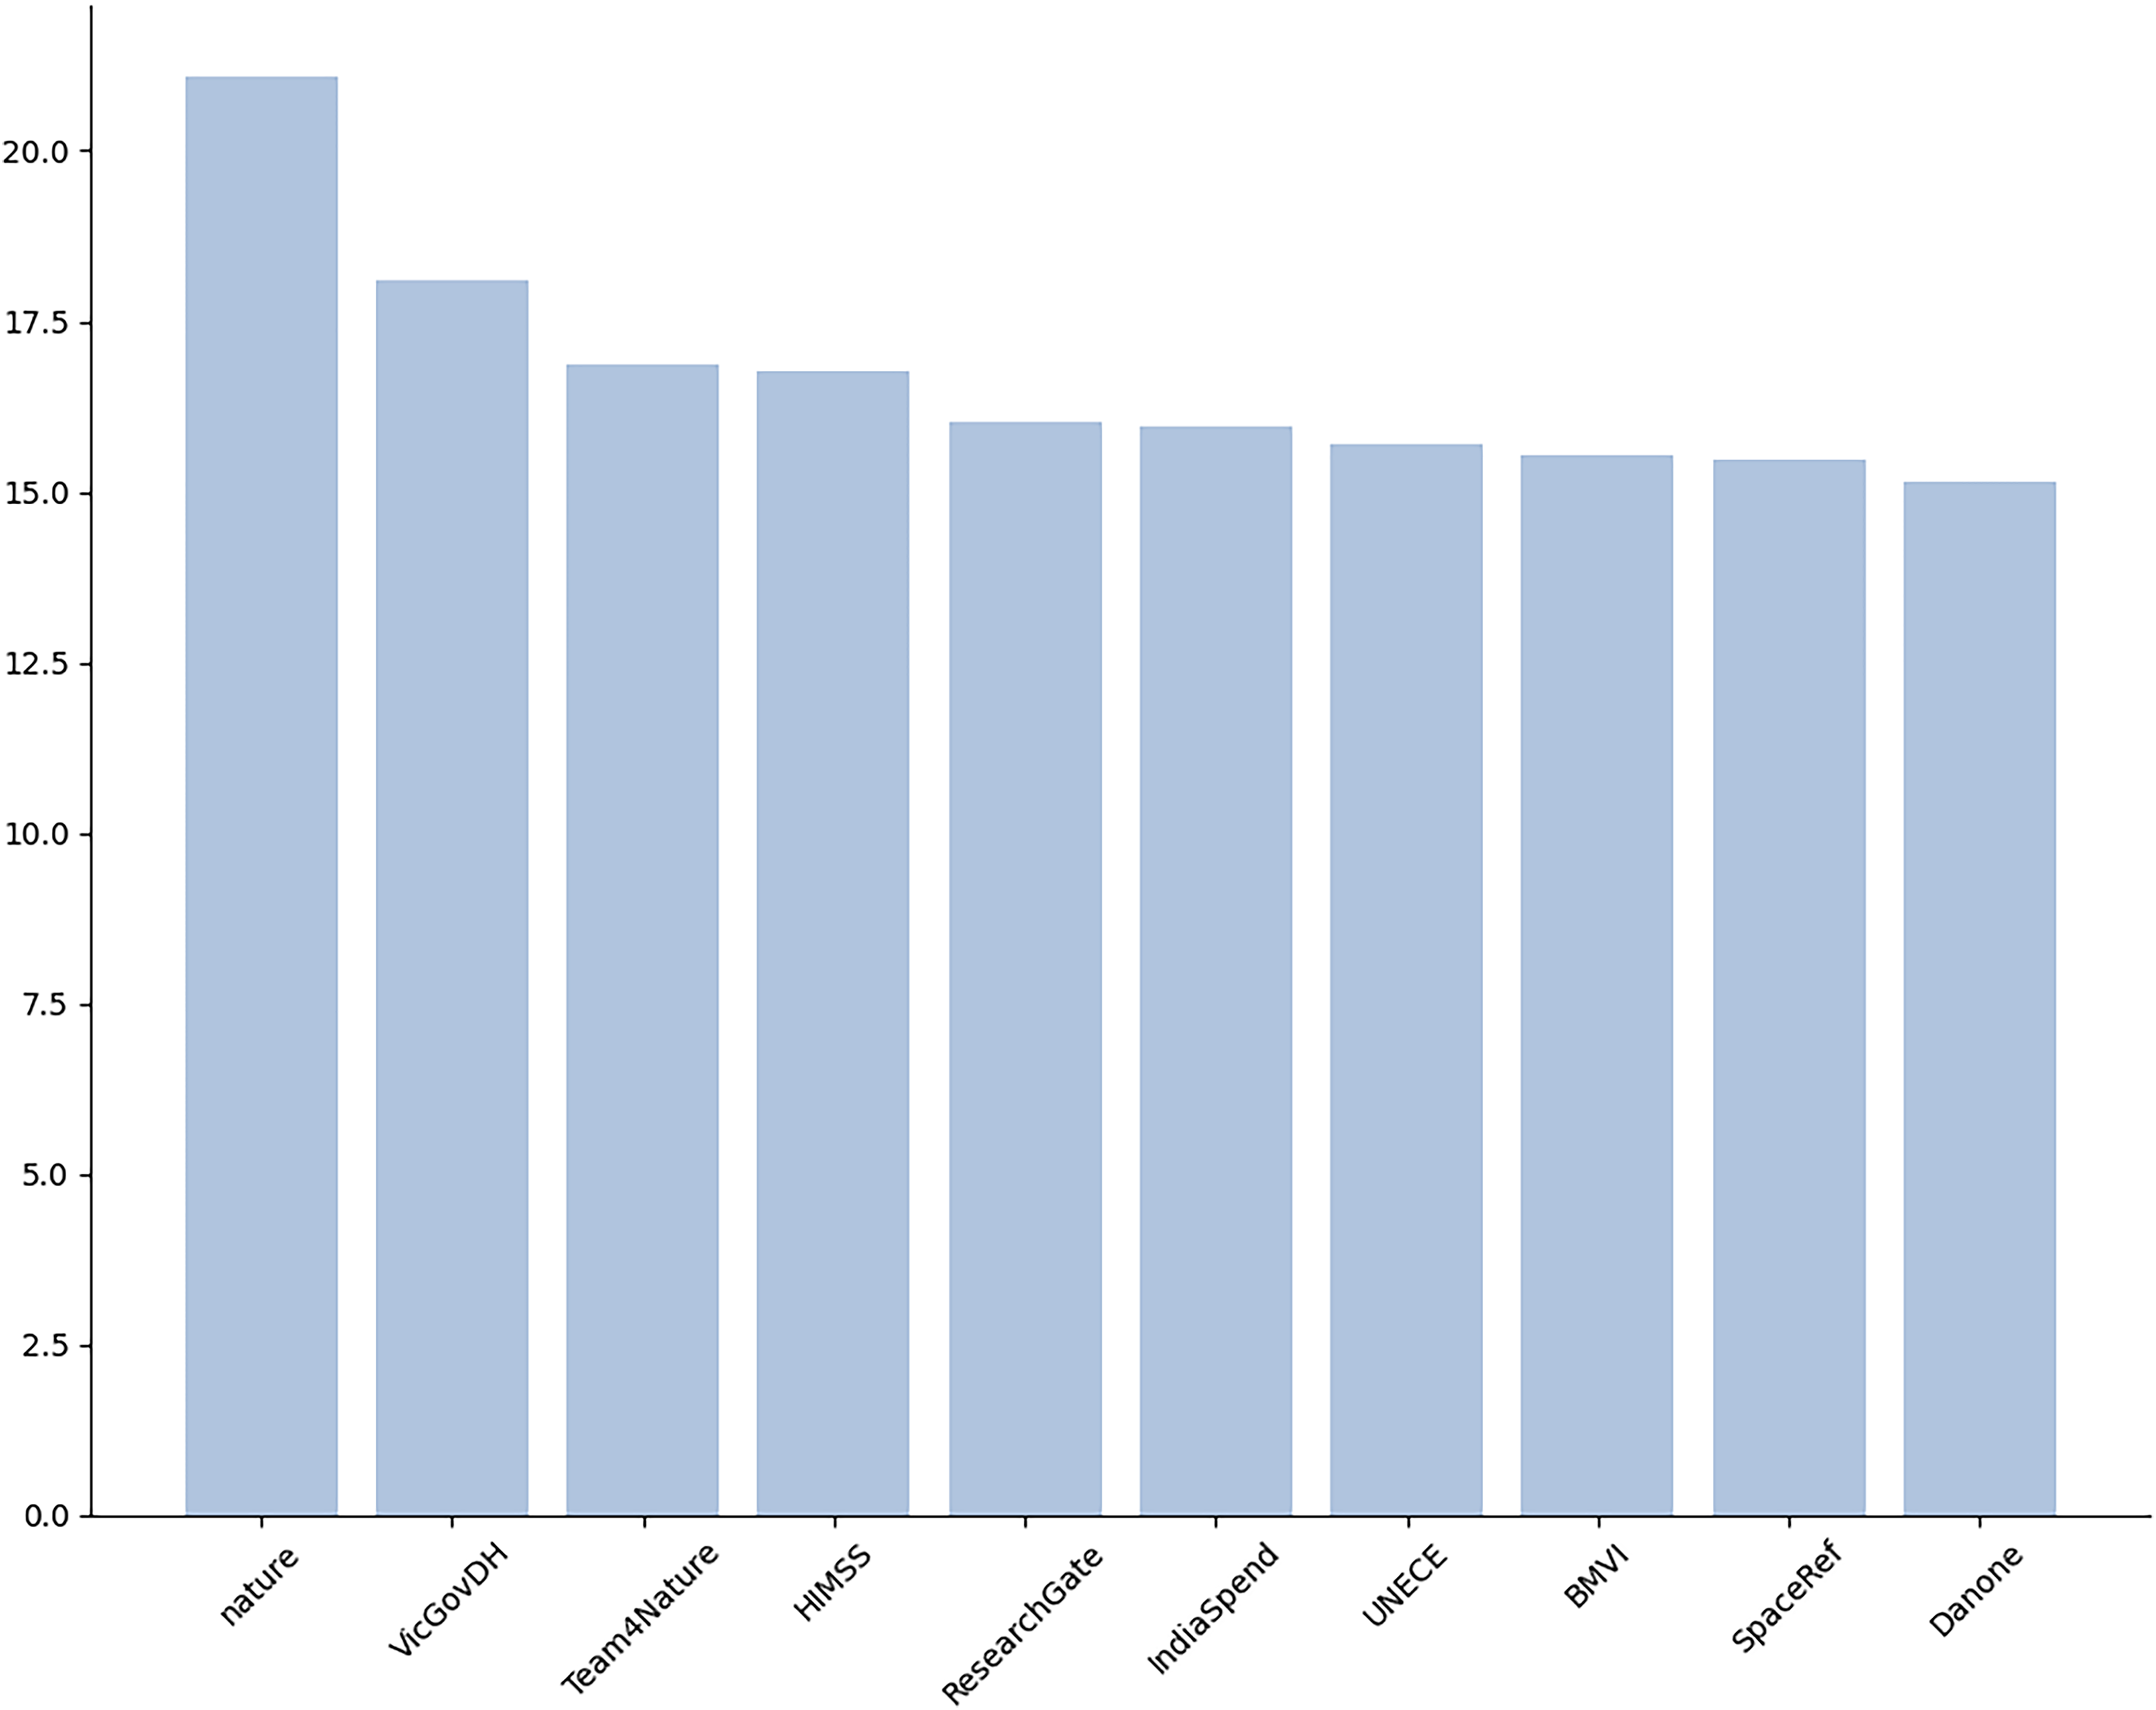
Top 10 users with more followers.
In relation with the number of followers, we analyzed the impact of the accounts in our dataset. This impact is an indicator between 0 and 100 calculated in proportion to the number of followers on a logarithmic scale. Thus, the value of impact determines how influential a Twitter account is. In Figure 12, we can see that the account of nature is the one with more impact, which was expected in accordance with the number of followers. Anyways, @NASAEarth and @CDCemergency have an impact similar to @nature. The rest of the accounts are over 70 in impact factor, so the similarity is high between these accounts.

Top 10 users with more impact.
Besides the number of followers, which could be misleading, and the impact, other indicators that could lead us to unveil the main actors in this conversation are the mentions and the retweets. 34 We found 1413 users that mentioned by others. There were a total of 3442 users that were mentioned. The full graph contained 4842 edges (mentions) and 4501 nodes (users that either mentioned or were mentioned), for esthetics purposes once more we made us of the k-core algorithm.
Figure 13 shows almost the top 50 more mentioned accounts. As we can see, the most important accounts belong to projects, while user accounts are in the lowest values and are less than the half of the accounts shown (only 11 users in 44 nodes). CitSciOz is the most mentioned and mentioning account followed by techinsider, GAINBioblitz, Ideas 4 Change, and SCOREwaterEU.
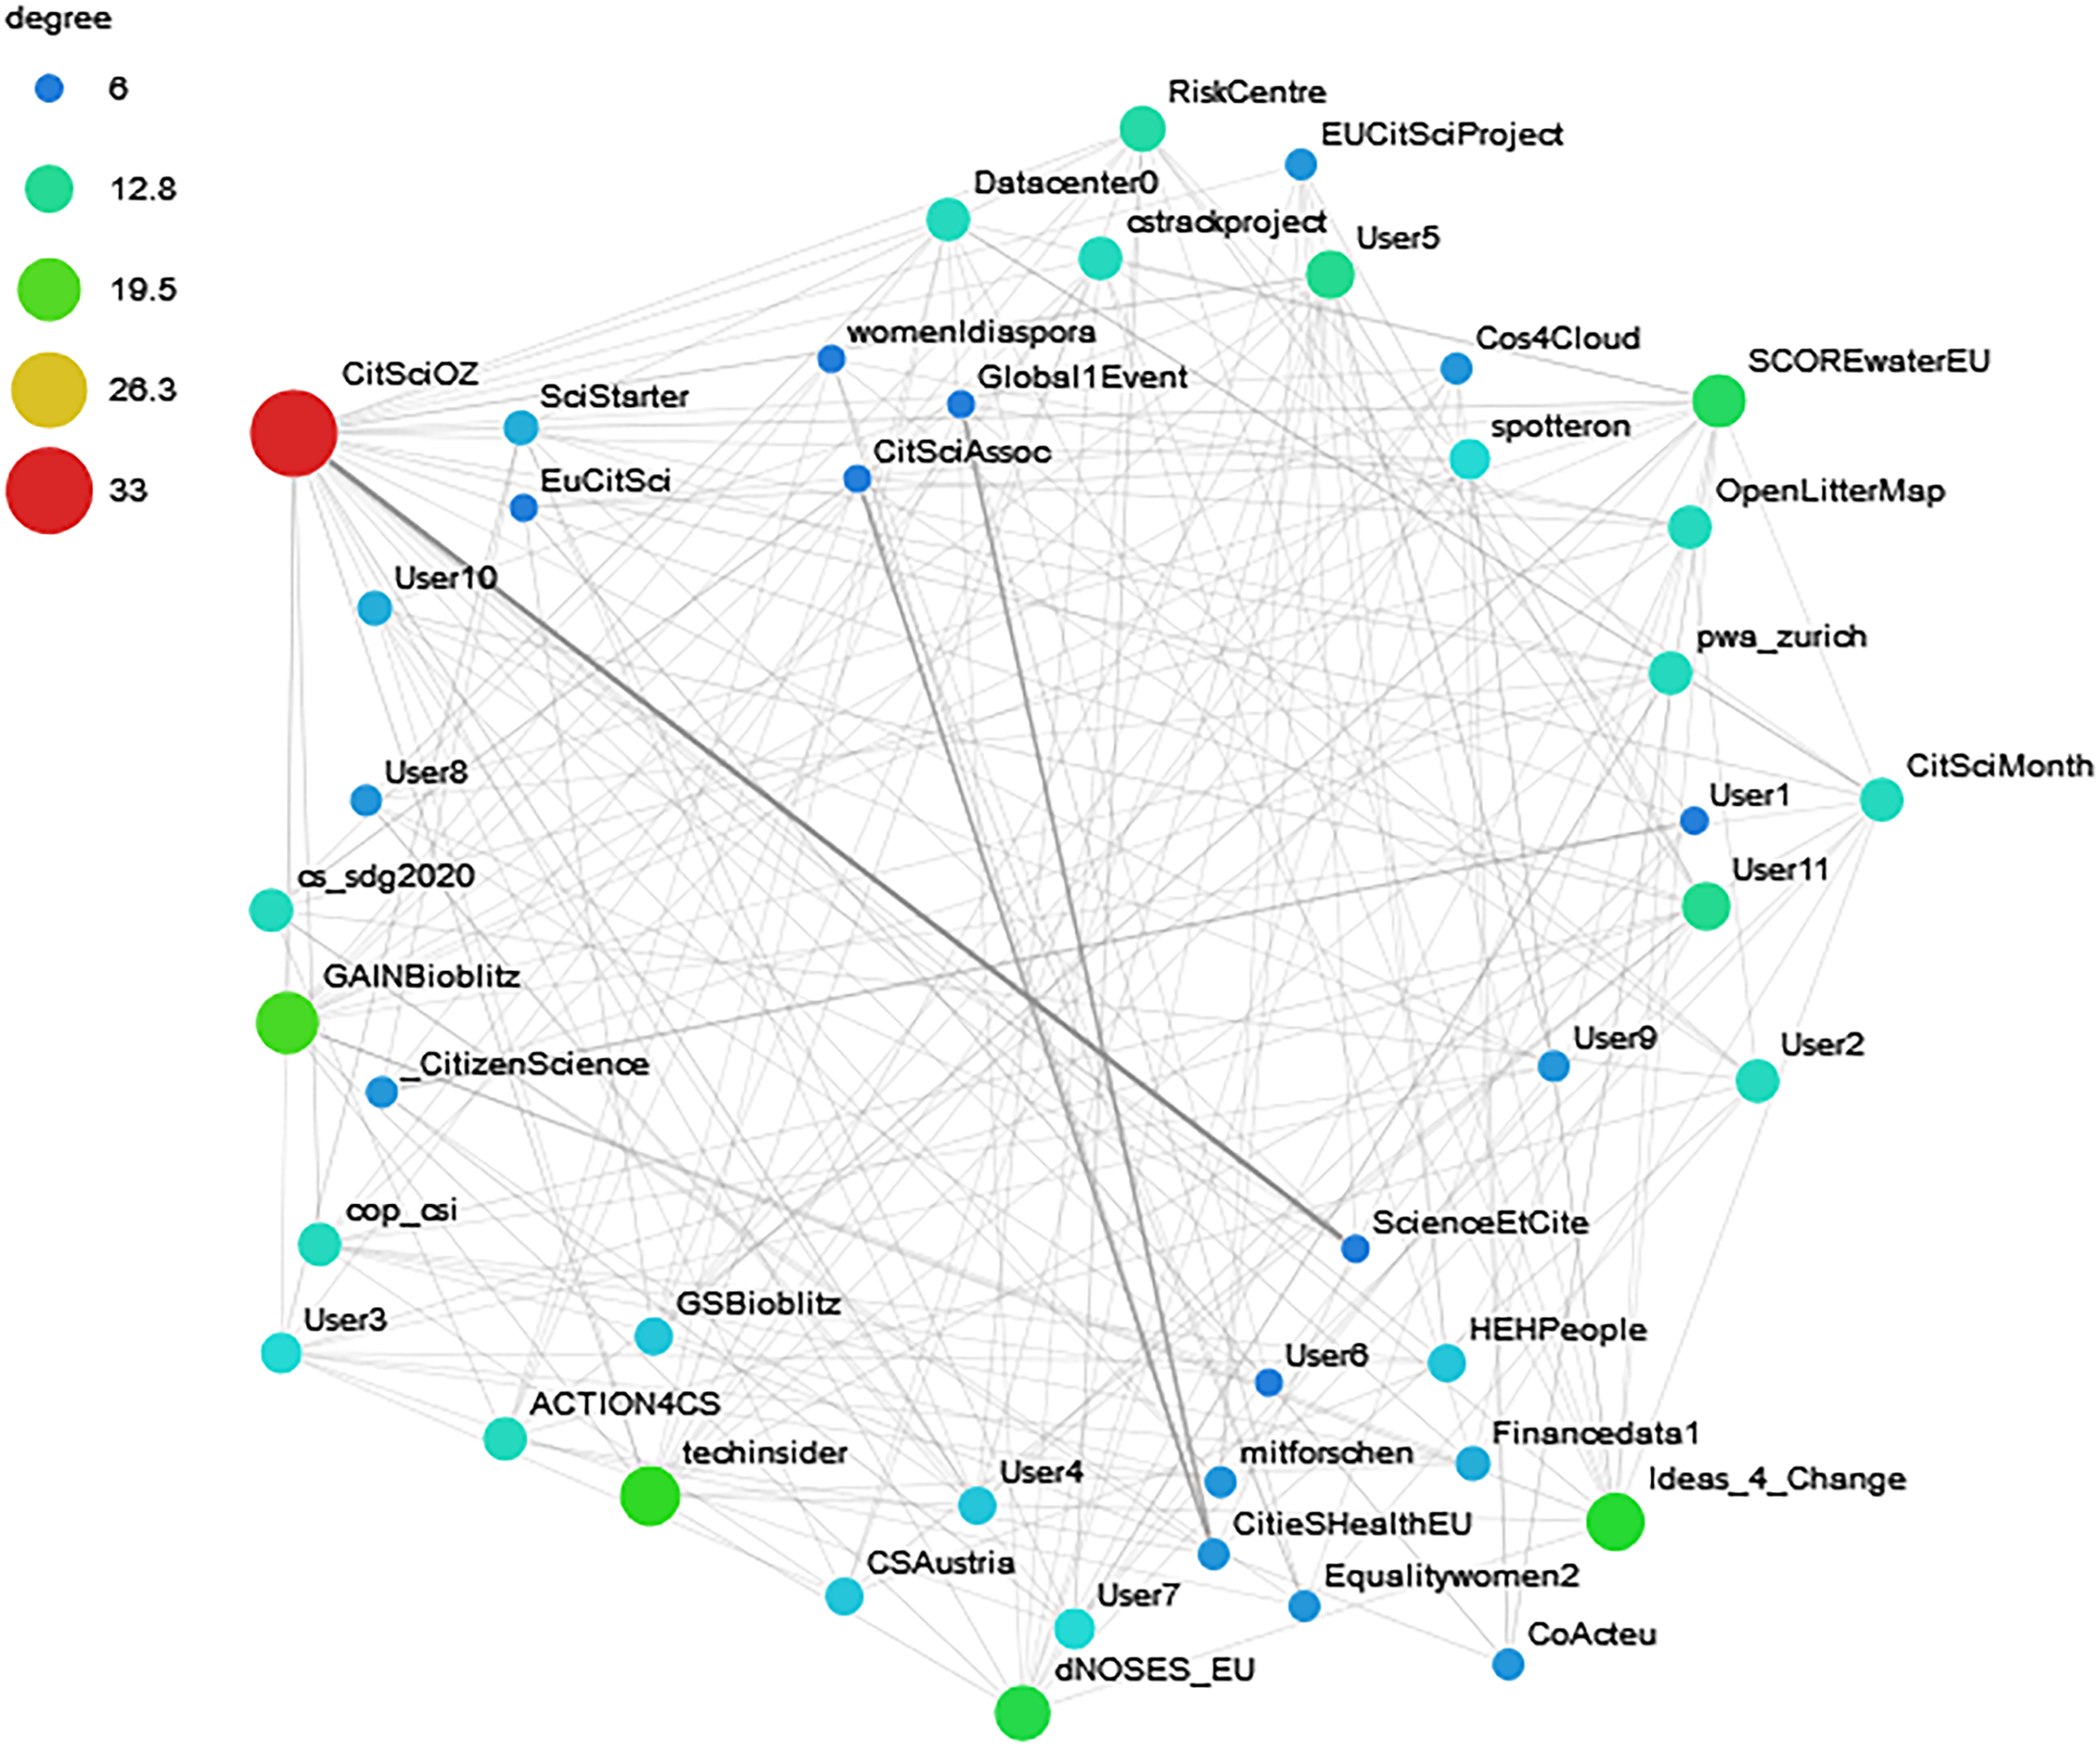
Main core of the mentions network.
When counting the retweets, the resulting graph contained 6088 users that retweet and 1293 users that were retweeted. Once we applied to the community detection, shown in Figure 14, it results in the detection of 35 communities around users that receive retweets.

Second core of the graph of most retweeted users graph. Highlighting of the communities with Louvain method.
The biggest community is displayed in a dark blue, with 116 users. The account of the project CitieSHealthEU, the bigger node, receives the most retweets. Different communities are formed around different themes. In order to find this information, we focused on the nodes with the highest number of retweets on every community and checked the essence of the information they create or provide. The biggest community, in which CitieSHealthEU and EUCitSciProject are enclosed, is found in a discussion around health problems and urban impact on health. Community 1 is formed by people and projects around a big project whose aim is to connect citizen scientist from MfNBerlin and other projects in Germany. We can also find a community of CS and health in Austria, a community around molecular medicine and patient safety or a community of people who follow a user who retweets general information on CS. Other groups, according to the users who receive the most number of retweets, are community 16 whose topic is about biomedicine and the funding of projects in this field, or community 7, in which the topic is about the surveillance of mosquitoes in Australia. So, according to the results, the communities seem to be diverse in the topic they address.
For future analysis another features of the members of these communities could be studied, such as country of origin, institution to which they are related, or even the projects they are involved in.
The community detection allowed us to see how certain users congregate around some accounts, but this visual representation does not provide the ultimate information we are searching for, the names of those who receive more retweets. In order to see this, we provide a centrality analysis of the network is shown in Figure 14.
In the next two following tables, we can see the values of the centrality measures to quantify influence. Describing the columns we see the first one, called Name, where we can see the screen names of the accounts. Every non-project, institution or official organization has been anonymized, which means that every name written as User is an individual. Right after that columns we see the columns for Indegree, Outdegree, and Betweenness. These columns are divided into another two columns: Val shows the value itself of the different parameters and the column R shows the position, the rank, when comparing the values to other nodes.
In order to give some more context for these parameters we describe the interaction of retweeting as follows: when user A retweets a tweet from user B, what happens is that a link A
In Table 1, we can observe the users from our filtered data-set ranked by Indegree, this means that we can see the most “prestigious” users since they are who receive more retweets from other users. In the results, we see that only one is an individual, the rest are projects.
Centrality measures of the users of the filtered dataset ranked by Indegree (top 20 most retweeted accounts).

The number one is CitieSHealthEU, an account whose role is the monitoring and research of the Impact on Urban environments and Health. Right after CitieSHealthEU we have mitforschen, an account whose purpose is to connect people from MfNBerlin and wissimdialog in the CS field. The next projects are all related to CS and institutions.
In Table 2, we find the accounts ranked by Outdegree, so it shows the accounts that actively retweet the most.
Centrality measures of the users of the filtered dataset ranked by Outdegree (top 20 most retweeting accounts).
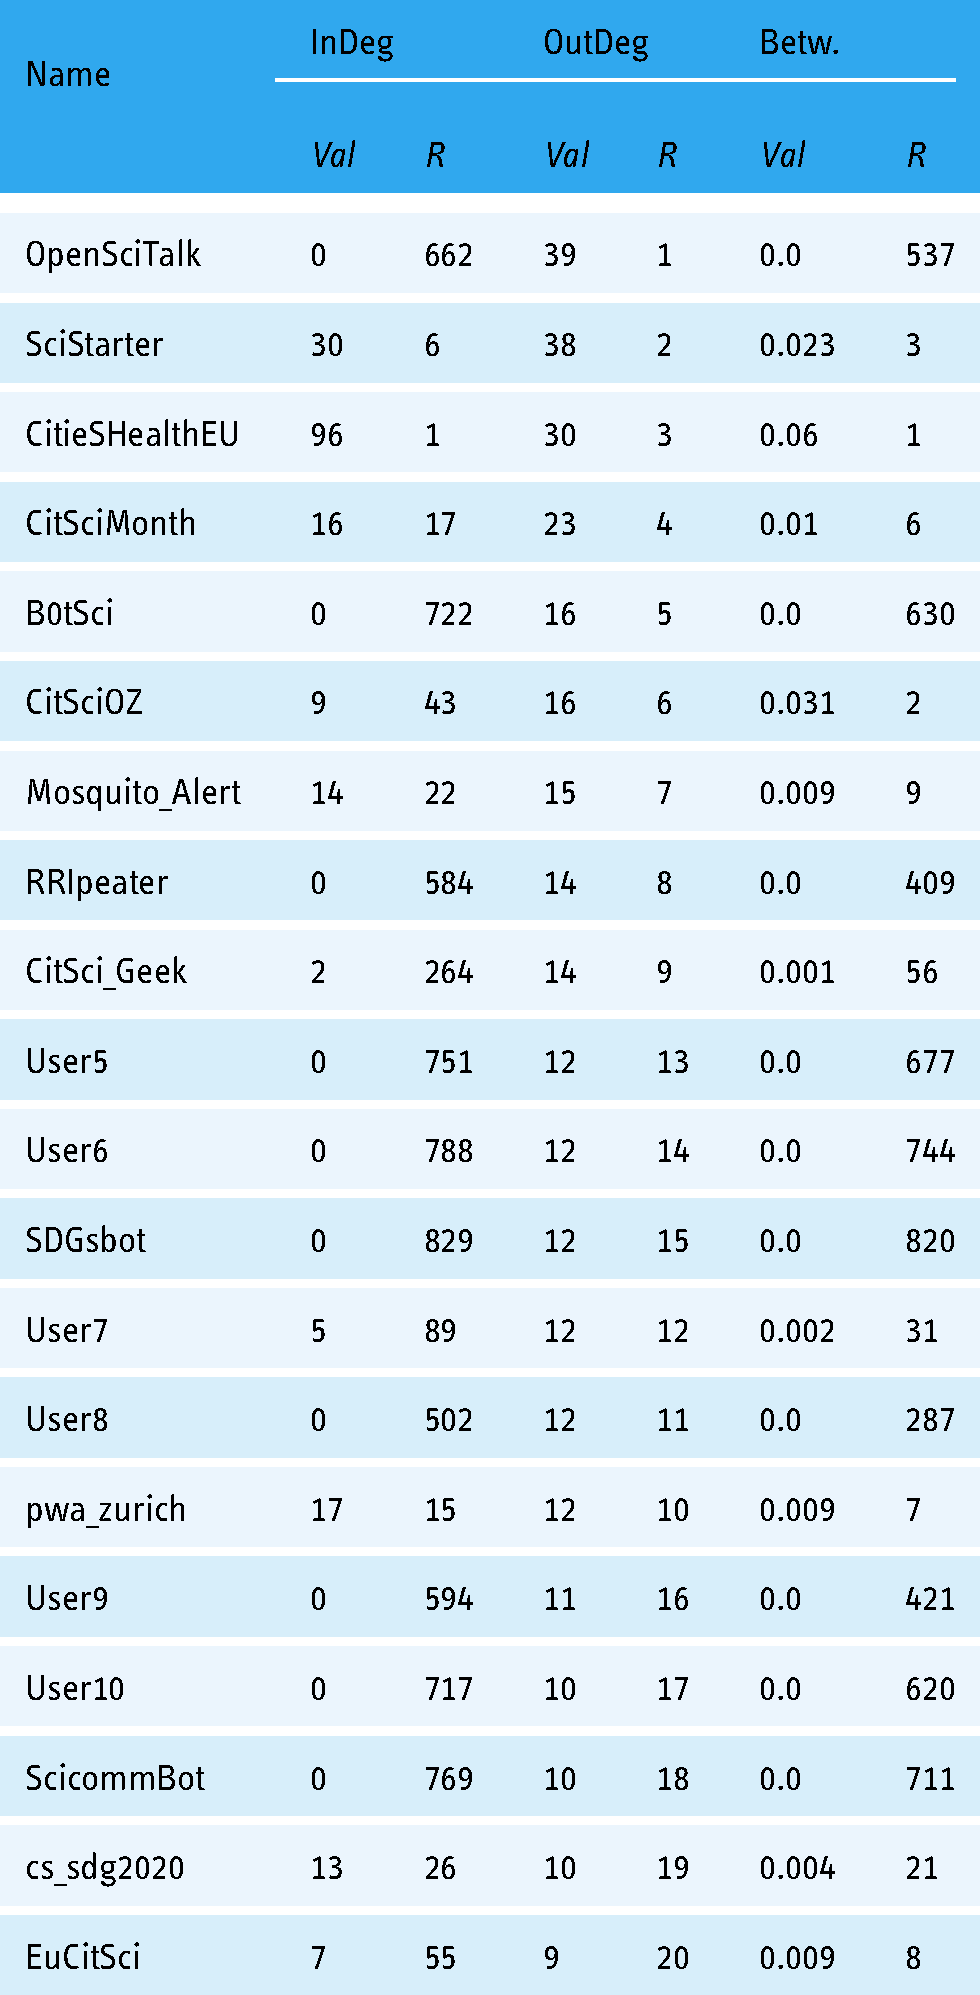
Topics and topic names alognside the keywords.

We encounter a similar situation, the top 10 accounts that retweet the most are project accounts, but we have three bots: B0tSci, RRIpeater, and OpenSciTalk that only retweet others, which makes them manifestly worthy of the highest positions.
Discussion and conclusions
Twitter has established itself as a platform with an increasing dissemination of scientific information 37 in many fields including health. 38 In our study, we found that 4.7% of the tweets we collected during one year were related to the discussion about health, healthcare, and eHealth. Although this number is small it could be enlarged with the addition of more words when filtering, we should also take into account that this amount will increase as time passes.
Another challenging topic is the presence of misinformation which also affects CS communities although one of the primary goals of CS is countering the spread of misinformation. 39
In relation to the misinformation we can say that there is discussion around CS on Twitter, but the quality of this information was not measured in this research. Some bots are present among the users in our datasets, mainly retweeting, they have a great power to spread the information with the counterpart of not checking the material.
From the extracted data it seems like the most important topic is SDGs. In the SDGs, we find objectives in different areas, from climate change to schooling or peace, but they address healthcare and health too.
Inside the SDGs the goals that can directly be linked to health are the Goal 3: Good health and well being and Goal 6: Clean water and sanitation, then some other goals with a close relation to health are Goal 2: No hunger and the goals 14 and 15 (Life under water and Life on land).
In the hashtags analysis, we find that #SDGs are always one of the most used hashtags in our filtered dataset. When compared to the count of hashtags in the initial dataset, where we find 19,789 unique hashtags, #SDGs are used 12,802 times when in the filtered dataset it appears 878 times. This means that almost a 7% of the appearances of the hashtag #SDGs are inside a health related discussion. Thus, it is easy to understand that inside the health-related discussion SDGs are a highly addressed topic since it is also the most used hashtag, but it would be interesting to analyze other topics in order to discover if there is a higher distribution of this hashtag.
What we also see is the high use of hashtags related to different aspects of health, such as techhealth, public health, or mental health, what suggest a variety of discussions. A surprising result is the absence of a hashtag named #healthcare.
From the connected hashtags analysis, it seems clear that SDGs, with COVID-19 and health are the main elements in our data accompanied by a diversity of hashtags about health, healthcare, or technology. In this network, we can also find several diseases, illnesses, or disorders written as hashtags such as dementia, cancer, depression, or diabetes.
Topic modeling results show that diseases caused by mosquitoes are the main topic, followed by Mental disorders about mental and brain disorders. 100 days of code, Research of rare diseases, and Water sanitation revealed themselves as the next more discussed topics, which are about digital health, agenda2030 and policymakers, and water sanitation in that order.
One of our initial beliefs in the early stages of the analysis was that topics like mental health would be more represented in the dataset according to the high importance it has worldwide in the present days. This turned out to be true after the analysis was conducted, appearing mental health in three topics.
Combining the previous analysis it seems that the discussion about health occurs in the framework of development goals, which is a hot topic on Twitter in the present days as several studies confirm 40 thanks to the implication of leaders, projects, organizations, etc. Itemising topic by topic we could link Mosquito Alert, Mental disorders, 100 days of code, Healthy diet, DHPSP, Mental disorders awareness, Pollution and health, Pollution and sustainable cities, COVID-19, Gamer for genomics, and Alzheimer monitoring directly to health. The topic called COVID-19 is clearly about the COVID-19, something that has been extensively discussed on Twitter for the past 2 years due to the COVID-19 pandemic, 41 what was not expected is the low amount of tweets concerning this topic.
If we take as reference what the World Health Organization (WHO) addresses for health and healthcare 42 we find hashtags and topics in relation to it. WHO monitors the following elements present in our dataset in relation to health: newborn and child health, infectious diseases, noncommunicable diseases injuries and violence, environmental risks and universal health coverage and health systems. Therefore, finding the conversation of health inside the development goals seems to be reasonable. Also, we must not ignore those topics with higher relation to wildlife and environment which also affect people’s health and of course health is inherent to other forms of life, so the appearance of tweets talking about other forms of life health is well-founded. Although the word SDGs is not defined within the keywords in the topic modeling we find this topic as the most important based on two reasons.
First, most of the appearances of SDGs is as a hashtag, which were eliminated or cleaned in the preproccess. Second, words like sustainability or global goals are repeated through the different analysis leading us once more to the idea that SDGs is the main topic.
In the analysis of the networks of retweets and mentions the main deduction we make is that it appears like project account are more active in mentioning and retweeting. When reviewing the mentions we only find 12 users in the 44 nodes drawn in Figure 12. This drives us to think that the projects tend to mention other projects which makes the connection and communication between projects fairly rich, a good behavior in order to cooperate and share information.
Finally, when checking the results of the most retweeted users, we clearly see those communities in Figure 14 around the main accounts that create and share content. This does not deviate from the trend in Twitter and other social media 8 and this behavior is directly linked to another common phenomenon, the small-world phenomenon. 43
When reviewing the tables we observe those accounts that receive a high number of retweets, which is considered “prestige,” and what typically occurs in Twitter is that big accounts do not answer retweeting others. The highest number of Indegree in Table 1 is near 100 while in Table 2 the highest number of retweets given is just almost 40. The number of retweets received almost doubles the Outdegree. Considering the degree as a prestige or influence indicator 44 we can determine that those users can be considered as influential in this network. But we must take into consideration the Outdegree, as a high a degree but a low value of Outdegree can describe a user as a isolated and non-communicative members. Also, a high value of Outdegree alongside low value of Indegree, results in simply “busy” members of the network with no influence at all (an exmaple would be those bots that we mentioned). Therefore, we can characterize some users (CitieSHealthEU, SciStarter, or CitSciMonth) as influential, communicative, and sharing members of the network. This is also supported with the results from the mentions analysis, where we can find these users as highly mentioned members. On the contrary, the absence of individuals in top positions of Outdegree makes us think that the spread of information is scarce in relation to the high presence of projects we have found. Besides, when analyzing the Betweenness, we also find that users such as CitieSHealthEU or SciStarter are ranked high which places them in central positions of our network and influential to the group by being in the middle of the spread of information (“withholding information (or) coloring or distorting it in transmission”). 45 In this research, we replicated the analysis presented in our previous study, 10 which was focused in the SDGs exclusively, besides improving some of the aspects. While the groundings of the hashtag analysis are the same, this time we present a more in depth comprehension of how hashtags are connected and used together as we can see in Figure 6. When it comes to topic modeling, we decided to make use of a more modern approach by means of the BERT algorithms instead of LDA and adding the analysis of evolution in time of topics, as shown in Figure 9.
Finally, alternatively to only measuring the importance of the actors in this discussion counting the retweets, we present an analysis of followers, impact, mentions, and retweets, but highlighting the communities formed around the users who are retweeted the most. Hence, we prove once more the high replicability of this analysis and the possibilities of constant improvement to which it is subject.
As a conclusion, our work is based on Twitter communication in the global CS community and explores the relationships with healthcare and health issues. Despite the fact that Twitter is perceived as a good platform for communication and information sharing in many fields, we found a rather low number of tweets in the intersection of interest (only almost 5%). Given the overall traffic on Twitter, this is still a substantial amount information for further analysis.
Our findings suggest that the discussions tend to evolve around more general health-related issues rather than healthcare exclusively, however the link between these two aspects is strong.
In any case, we found some interesting projects and accounts with a strong relation to healthcare such as the project developing smartphone apps for patients with Alzheimer.
Besides, the discussion seems to evolve around or to be enclosed in the SDGs conversation in Twitter. The fact that the hashtag #SDGs is the most used one, the most used alongside other hashtags and the one with more appearances in the initial collections support this believing.
Some diseases, disorders, processes, or illnesses are actively discussed in Twitter. Dementia, depression, cancer, Covid, diabetes, anxiety, or aging seem to be relevant inside the discussion related to health in the CS community. We tend to believe that this is a reflection of the growing social awareness and the high incidence of this diseases and processes in the population.
The most influential accounts discussing about health in the CS community are projects and organizations accounts, although the spread of information seems to be short according to the numbers of retweets that are given to the main accounts present in the data.
The study has some limitations. One aspect relates to other social media channels that could also be analyzed to complement the Twitter-based analyses. Besides, we are always constrained by the limitations of the software and hardware itself and the techniques.
It must be noted that in this study, we did not aim to evaluate the impact of certain tweets, yet we wanted to shed light into the general state of the discussion. However, a strong point of our work is the possibility to replicate it in other areas with different datasets and filters. It is also possible to add more keywords to enlarge the information and the implications for industry, researchers, citizen scientist, and stakeholders who may find this analysis interesting in order to discover initiatives and projects in their communication via Twitter. By adding more keywords, new trends, events, or discussion can be found. This allows long-term analyses which get richer as the dataset grows and the analysis techniques evolve.
A possible final outcomes of our analysis are policy recommendations. Our findings can be interesting and relevant for social media users and managers of online communities to better understand the internal dynamics of the CS community. At a higher level, actors in charge of creating policies can translate these insights in order to give an improved treatment to sectors that were underrepresented or, on the contrary strengthen, to improve the policies around some sectors of special interest to the general public.
Footnotes
Acknowledgements
This work has been funded by the European Community’s call H2020-SwafS-2019-1 (H2020-EU.5.c) under grant agreement no. 872522.
Contributorship
Fernando Martínez-Martínez, David Roldán-Álvarez, Estefanía Martín, and H. Ulrich Hoppe jointly developed the study. Fernando Martínez and David Roldań-Álvarez designed and carried the different analyses and together reviewed the results. Estefanía Martín helped in the development of the theoretical framework. H. Ulrich Hoppe supervised the network theory and analyses. Fernando Martínez-Martínez wrote the manuscript as first author. All authors read, reviewed, and approved the final manuscript.
Declaration of conflicting interests
The authors declared no potential conflicts of interest with respect to the research, authorship, and/or publication of this article.
Ethical approval
This study received the approval through the Ethics Committee of the Universidad Rey Juan Carlos, Spain with the reference CS-TRACK. Expanding our knowledge on citizen science through analytics and analysis: ENM61/201303202209622.
Funding
The authors disclosed receipt of the following financial support for the research, authorship, and/or publication of this article: This work has been funded by the European Communitys call H2020-SwafS-2019-1 (H2020-EU.5.c) under grant agreement no. 872522.
Guarantor
Fernando Martínez-Martínez.