
Abstract
In this paper, a novel approach for identifying normal and obscene videos is proposed. In order to classify different episodes of a video independently and discard the need to process all frames, first, key frames are extracted and skin regions are detected for groups of video frames starting with key frames. In the second step, three different features including 1- structural features based on single frame information, 2- features based on spatiotemporal volume and 3-motion-based features, are extracted for each episode of video. The PCA-LDA method is then applied to reduce the size of structural features and select more distinctive features. For the final step, we use fuzzy or a Weighted Support Vector Machine (WSVM) classifier to identify video episodes. We also employ a multilayer Kohonen network as an initial clustering algorithm to increase the ability to discriminate between the extracted features into two classes of videos. Features based on motion and periodicity characteristics increase the efficiency of the proposed algorithm in videos with bad illumination and skin colour variation. The proposed method is evaluated using 1100 videos in different environmental and illumination conditions. The experimental results show a correct recognition rate of 94.2% for the proposed algorithm.
Keywords
1. Introduction
Nowadays, the Internet has become an essential part of our life and children are not excluded. The Internet provides children many opportunities for learning, access to research, socializing, entertainment and can be an enhanced communication tool within families. However at the same time it can expose children to potentially negative content. Because of the fast rate of growth of Internet facilities, the amount of harmful content on the Internet is growing faster too. Therefore, uncontrolled access to the Internet gives rise to serious social problems. Harmful content on the Internet may include obscene text, images and videos; however, video content is more harmful. Therefore, harmful video content recognition plays a great role in ensuring safe access to the Internet.
Content filtering is a technique commonly used by organizations such as schools to prevent Internet users from viewing inappropriate web sites or content. In content filtering techniques, an item is blocked or allowed based on the analysis of its contents not its source.
Different algorithms have been proposed for the task of content-based web filtering; however, most of them focus on IP, image [1], text [2] or combined textual and visual features [3]. Most of the image-based web filtering algorithms focus on skin detection. In [4,5], in order to detect and model skin regions, normalized RGB colour space was used to eliminate illumination effects and overcome the problem of different skin colours resulting from different ethnicities. Employing YCbCr or similar orthogonal colour spaces also increases the reliability of the skin detection algorithm significantly because they separate colour and illumination parameters [6-8].
In [9], a three-step method for identifying obscene videos was utilized. In the first step, tensors and motion vectors were utilized to extract key frames. Then, a cube-based colour model was employed for skin detection. Finally suspected videos were recognized by the proposed algorithm.
In [10], a multi stage approach was proposed for obscene content detection in videos. In this method, visual motion information and periodicity in the audio stream were utilized to detect obscene videos.
In [11], an adaptive skin detection algorithm was suggested for content-based video classification. The algorithm first detected the face area and calculated the skin parameters using the detected face area. Then, using a statistical approach, skin regions were detected.
In [12], after extracting video frames, motion vectors were calculated and employed to segment video frames to frames with global or local motions. For local motion, skin regions were extracted and edge moments were utilized to classify each key frame as an objectionable or a benign frame. The method suffers from using the spatial information of only key frames. The method also needs a general database for moment matching.
In [13], key technologies for obscene video recognition in the compressed video domain were discussed. The algorithm extracted skin regions and detected key frames in the compressed domain. Key frames in this approach were extracted by applying a threshold to the number of skin pixels. Then a decision tree was utilized to classify key frames.
In [14], two models of features were used for objectionable video classification. The first model utilized features based on single frame information and the second feature model was based on the group of frames. The features of the two models were classified using two SVM classifiers. Then the final decision function was employed to combine the results of the two models by using the discriminant analysis. The authors extended their work [15] to a multilevel hierarchical system, which utilized very similar features for detecting objectionable videos. The method included three phases, which were executed sequentially. In the first phase, initial detection was performed based on hash signatures prior to a video being downloaded or played. In the second phase, single frame-based features were utilized for the detection followed by a third phase where the detection was completed by features based on the group of frames reflecting the overall characteristics of the video. Both algorithms sampled frames periodically to avoid the computational overhead for finding the key frames of a video. This method will not work for the classification of video episodes with different categories in the same video file.
In [16], motion vectors were extracted from MPEG video stream and smoothed using a median filtering. Then the periodicity of motion vectors was extracted and, based on the motion features, obscene videos were detected. The method uses only motion information for classification. Therefore, the algorithm cannot recognize objectionable videos with global motions or videos with no considerable motion.
Choi et al. [17] proposed the X Multimedia Analysis System (XMAS) for the recognition of obscene video frames. The system provided a method for the recognition of obscene videos based on multiple models and multiclass SVM. The system sampled video frames at a rate of 1 frame/second and used MPEG-7 visual descriptors for feature extraction. The method used only spatial features and its functionality was restricted to MPEG-7 files.
Most of the existing methods for obscene video recognition use only the information of key frames or spatial information for video classification. Additionally, they generally cannot differentiate between normal videos with a high volume of skin region and obscene videos.
In this paper, a new method is presented for the recognition of obscene video content. In the proposed algorithm, different episodes of a video file, starting with key frames, are classified independently as obscene or normal. We utilize different features for obscene video content recognition, including spatial, spatiotemporal and motion-based features. The method employs different shape-based features to differentiate between skin regions of obscene and non-obscene videos. We also use a novel classifier for obscene video recognition.
This paper is organized as follows. The next section describes the proposed algorithm for obscene video recognition. Experimental results appear in section 3 and finally; we conclude the paper in section 4.
2. Proposed algorithm
The proposed algorithm has three stages, 1- pre-processing, 2- feature extraction and 3- classification. In the pre-processing stage, after applying necessary noise removing filters, key frames are detected and a skin detection algorithm is applied to extract the skin regions. Since our method is based on spatiotemporal features, the skin detection algorithm is applied to several consecutive video frames, starting with key frames. In the proposed algorithm, different episodes of a video file, starting with key frames, can be classified independently as obscene or normal. Three sets of features are utilized in the proposed algorithm for obscene video recognition, which are: 1- structural features based on single frame information, 2- features based on 3D spatiotemporal volume and 3- features based on the periodicity of motion.
The PCA-LDA method is then applied to reduce the dimension of structural features and select more distinctive features. We use a fuzzy or Weighted Support Vector Machine (WSVM) classifier to identify video episodes in the final step. We also employ a multilayer Kohonen network as an initial clustering algorithm to increase the discrimination of the extracted features for two classes of videos.
2.1 Pre-processing
In first stage of the proposed algorithm, we first apply smoothing filter to the input video and extract key frames. Subsequently, a group of frames, starting with a key frame, and with the duration of 4 seconds are saved for feature extraction. We then extract skin regions in the frames.
2.1.1 Key frame extraction
The use of key frames has two advantages. Firstly, a video file is divided into a set of episodes, which can be classified independently. Secondly, computational complexity is reduced significantly. Different algorithms have been proposed for key frame extraction, most of which are based on a colour histogram [18]. Figure 1, shows various stages of the proposed algorithm for key frame extraction. The proposed algorithm for key frame extraction first employs the colour histogram of consecutive frames to extract frames with change in the colour histogram. For this purpose, the correlation between histograms of two consecutive frames is calculated. Then by detecting local minimums in the correlation signal and applying a threshold, initial key frames that show the change in the colour histogram are extracted.
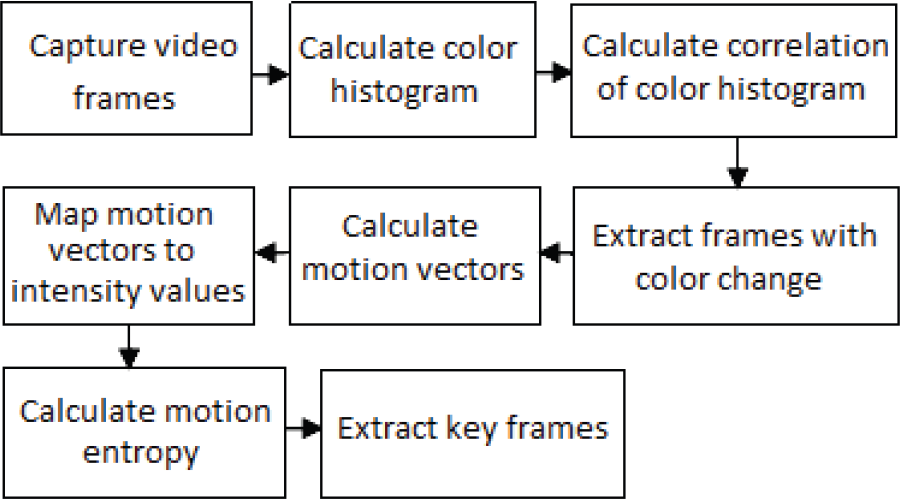
Block diagram of key frame extraction algorithm
In the case of videos with poor illumination, the method based on colour histogram may generate a myriad of key frames without any change in the scene or motion information. Therefore, motion vectors are employed to eliminate some key frames that reveal no change in motion information. We use the entropy of motion vectors to extract motion information in two consecutive frames. Motion vectors are calculated using the block matching algorithm for all blocks of video frames. Two dimensional motion vectors are then mapped to an intensity image where the intensity values are calculated using the following equation:

where (dx, dy) is the motion vector representing the displacement of pixels (x, y). It is assumed that a square area with the size of (2R + 1) × (2R + 1) is used as the search region in the block matching approach. We experimentally use the value of 10 for R.
We then calculate motion entropy and apply a threshold to extract key frames.
2.1.2 Skin region extraction
Skin regions are the main attribute of obscene videos. Different algorithms have been proposed for the task of skin detection [19, 20]. Here, the Gaussian mixture model is used for skin detection. The mixture density function is expressed as the sum of Gaussian kernels as follows [21]:

where
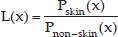
Here L(x) is the skin likelihood, Pskin and Pnon-skin are skin and non-skin probability models, respectively. To calculate parameters for skin and non-skin models, myriads of images with pre-labelled skin and non-skin pixels are utilized. We use the same parameters as reported in reference [21]. To remove erroneous skin pixels and to have uniform skin area, some morphological operators are applied to remove small regions and fill holes. Figure 2 shows the results of the skin detection algorithm. As shown in the figure, some areas whose colours are similar in colour to the skin are detected as skin regions.

Results of skin detection algorithm, (a) input image, (b) skin likelihood and (c) skin regions
2.2 Feature extraction
We use three sets of features for obscene video recognition. These features are: 1- features based on single frame information, 2- 3D spatiotemporal features and 3- features based on motion information and its periodicity.
We extract features for each episode of the video starting with a key frame. The first group of features is extracted from video frames independently. To reduce the computational overhead of the algorithm, we apply the PCA-LDA approach to reduce feature size. 3D spatiotemporal features are extracted from a group of frames. The spatiotemporal features aim at processing spatial and temporal information simultaneously. The third group of features utilizes the motion information of skin regions and their periodicity to extract proper features for obscene video recognition.
2.2.1 Structural features based on single frame information
The main characteristic of obscene videos is the high volume of skin regions in the frames. Therefore, the first group of the features aims at extracting features from skin regions in individual frames of video episodes. However, some normal videos may also include a high volume of skin regions; therefore, we use shape-based features to differentiate between skin regions in normal and obscene videos. To extract features based on single frame information, we first extract skin regions by applying a connected component extraction algorithm [22] to the skin image. We remove small connected components or skin regions. We then calculate the following shape-based features for each video frame.
The area of the largest skin region in the frame.
Hydraulic factor which is defined as the area to perimeter ratio of the largest skin region.
Solidity which is defined as the area of the largest skin region to the area of its bounding convex hull.
Compactness factor which is defined as the area of the largest skin region to the area of bounding box for all skin regions in the frame.
Minor to major axis ratio of the ellipse that has the same normalized second central moments as the largest skin region in the frame.
Equivalent diameters of the circle with the same area of skin regions in the frame.
Since these features are calculated for all frames in the video episode, the size of the features is large. To reduce the computational overhead of the algorithm, we apply a PCA-LDA algorithm to reduce the size of the features. In the PCA-LDA approach, we first apply a Principle Component Analysis (PCA) algorithm to reduce feature size to an intermediate size M which is smaller than the original feature size. Then the Linear Discriminant Analysis (LDA) approach is employed to reduce feature size to Mf.
In the PCA approach the mean vector and covariance matrix are calculated for all existing data in the database.


where X̄ and C are the mean vector and covariance matrix. Then the PCA is applied to the covariance matrix C, and Mi largest principal components are used for the feature extraction as follows:
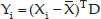
where Yi are the calculated features and D is the matrix of Mi principle vectors.
To apply the LDA approach to the output of the PCA algorithm, mean feature vectors for each class of input videos are calculated as follows:
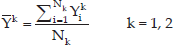
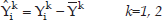
where Nk is the number of feature vectors for each video class, Yki are the outputs of the PCA algorithm for the video class k and Y̅k is the mean vector for video class k. The scattering matrix for each video class is calculatedusing the following equations:

where Sk is the scattering matrix for class k. Then the intra class scattering matrix SB and matrix A are calculated:


Similar to the PCA approach, eigen value and eigen vectors for matrix A are calculated and Mf largest eigen values are used to map Y vectors to obtain the final feature vectors. We experimentally use the value of 50 and 20 for Mi and Mf.
2.2.2 3D spatiotemporal features
The proposed 3D spatiotemporal features unify the spatial and temporal properties of skin regions in the group of frames. To extract spatiotemporal features, a 3D volume from skin regions in the subsequent frames of a video episode is constituted. The volume includes at most one skin region or the connected component of a frame. To select the skin region of a frame in the video episode, a relation tree is constructed for skin regions in subsequent frames of the video episode. Figure 3 shows a typical relation tree for four subsequent frames. Each node in the relation tree represents a skin region and the link between the nodes shows the overlap between two skin regions in subsequent frames. We select the three largest skin regions of a frame to form the relation tree. The algorithm to form the relation tree has the following stages:
Select three largest skin regions for each frame and consider them as the node of the relation three. The node SRij in figure 3 defines the ith skin region in frame j of the video episode. Three kinds of nodes are defined in the relation tree, 1- parent node, 2- end node and 3- intermediated node. The parent node is a node that doesn't have any predecessor. Nodes SR11, SR22, SR12 are parent nodes in figure 3. The end node is a node that doesn't have any successor. Nodes SR33, SR14, SR42, SR43 are end nodes in figure 3. Intermediate nodes relate parent nodes to end nodes.
If two skin regions SRij and SRkj+1 in two subsequent frames overlap, the link li,kj is added with the cost of Cji,k to the tree, where Cji,k is the number of overlapped pixels between two skin regions.
Find all paths in the relation tree. A path is defined as a sequence of nodes SR1, SR2, …, SRk and their related links and costs, where CC1 is a parent node, CCk is an end node, and each intermediate node CCi is the successor of CCi-1.

Four steps of a typical relation tree
When the relation tree is constituted, the optimal path, which is defined as a path with the maximum number of nodes, is selected. If a few paths have the maximum number of nodes simultaneously, the path with the maximum cost is selected as the optimal path. The optimal path is used for the construction of 3D spatiotemporal volume and feature extraction.
After the extraction of the optimal path, the connected components in the optimal path are extracted. Then the extracted connected components are stacked over each other to construct a 3D Spatiotemporal Volume (STV). The volume shows the spatial characteristics of connected components in the optimal path and their temporal variation. Two groups of shape-based features are extracted from the volume. The first group includes six features as follows:
The volume of the STV which is defined as the number of skin pixels in all connected components in the volume.
Volume Solidity (VS) which is defined as the ratio of pixels in the convex hull of the volume to skin pixels that appear in the STV. To obtain the convex hull of the volume, we extract the convex hull for all the connected components in the path. VS is calculated using the following equation:

where Ai and Si are the areas of the ith connected component in the optimal path and its convex hull respectively and N is the number of connected components in the optimal path.
Volume Hydraulic Factor (VHF) which is defined as the volume to surface ratio of the STV as follows:

where Ai and Pi are the area and perimeter of the ith connected component in the STV respectively and N is the number of connected components in the optimal path.
The Equivalent Sphere Diameter (ESD) which is defined as the diameter of a sphere with the same volume as the STV volume.
Volume Compactness (VC) which is defined as the ratio of the STV volume to the volume of rectangular parallelepiped bounding the STV.
The average diameters for circles with the same areas of connected components in the optimal path.
To extract the second group of features, we first map all the connected components in the spatiotemporal volume to a single image called the Optimal Path Map Image (OPMI). The OPMI is calculated using the following equation:

where N is the number of connected components in the STV, i and j are spatial indices and k represents the temporal index. After calculating the OPMI, the connected component in the OPMI is extracted and the second group of volume features is calculated as follows:
OPMI Solidity (OPMIS) which is defined as the ratio of the connected component area in OPMI to the area of its bounding convex hull.
OPMI Hydraulic Factor (OPMIHF) which is defined as the area to perimeter ratio of the connected component in the OPMI.
OPMI Compactness Factor (OPMICF) which is defined as the ratio of the connected component area to the area of its bounding box.
Minor to major axis ratio of the ellipse that has the same normalized second central moments as the connected component in the OPMI.
Diameter of the circle with the same area of the connected components in the OPMI.
2.2.3 Feature extraction using motion information and the periodicity characteristic
Periodicity is the main characteristic of obscene videos. Therefore, we employ the periodicity of motion as the feature with which to enhance the recognition rate, especially in videos with poor illumination. Different algorithms may be used to measure the periodicity of motion in a video. Some algorithms used motion vectors to measure periodicity [23]; however, these methods fail in videos with complex and non-translational motions. Some other algorithms employed the correlation of intensity values to measure periodicity. These methods are sensitive to change in illumination. Additionally, most of the existing algorithms for periodicity measurement are sensitive to camera motion. To deal with the above mentioned problems, we use an algorithm which measures the periodicity of the skin regions and considers the motion of the camera to extract the proper periodicity-based features. The algorithm has the following stages:
Extract moving regions in the video frames by calculating motion vectors or differencing subsequent video frames.
If the moving regions outside the skin regions in a frame are larger than 50% of the skin regions, the frame is considered as a frame with camera motion.
If the number of video frames with camera motion is less than a predefined threshold, the motion validity flag is set to calculate the periodicity-based features otherwise all the periodicity-based features are set to zero.
To calculate features based on periodicity, we first extract the bounding box for skin regions. For this purpose, first, small connected components are omitted and small holes in skin regions are filled using morphological operators and adjacent connected components are merged. Then, the largest connected component in each frame is extracted. Finally, the bounding box of the largest connected component is calculated.
We use the self-similarity curve to detect periodicity of skin regions in the proposed method. The self-similarity curve is defined as:
where St1 (k) is the self-similarity curve, k is the temporal index, BB(k) is the image of the skin bounding box in frame k and the Sim function is an image similarity metrics. When the motion of skin regions is periodic, the self-similarity curve is also periodic with the same period. Different image similarity metrics may be used for the similarity curve extraction. We use normalized cross correlation for self-similarity curve extraction.
In videos with a small skin area, skin regions may not be detected in some frames. In this case, the self-similarity curve would be short or oscillatory, which results in non-reliable periodicity features. For this purpose, we have defined the Reliability Factor (RF) for the self-similarity curve as:

where Nt is the total number of frames in the video episode, Ns is the number frames with a skin region and Kf is the temporal index of the first frame with a skin region. When all the frames in the video episode contain skin area, the value of RF is 1.
The self-similarity curves may be noisy; therefore, a smoothing filter is applied to remove noise. Then the Fourier transform of the smoothed self-similarity curve is employed to extract features. We use six features for measuring periodicity as follows:
Frequency of the largest peak in the amplitude spectrum.
Amplitude of the largest peak in the amplitude spectrum.
Frequency of the second largest peak in the amplitude spectrum.
Amplitude of the second largest peak in the amplitude spectrum.
Motion validity flag
Reliability factor of the self-similarity curve
2.3 Classification
In this work, a new classifier based on SVM [24] is used for the classification of video episodes. The proposed feature vector is a 37 dimensional vector with the following elements:
Structural features based on single frame information: 20 elements
Features based on 3D spatiotemporal volume: 11 elements
Features based on motion and periodicity characteristics: 6 elements
The binary SVM classifier is a classifier with two classes. The SVM classifier in this case creates a hyperplane to separate the features of two classes. The SVM classifier has several advantages in comparison with other binary and non-binary classifiers [25]. It avoids overfitting by choosing a specific hyperplane from among the many that can separate the data in the feature space. However, diversity of both obscene and normal videos causes overlap in the feature space, which cannot be discriminated using a hyperplane. To handle this problem, we utilize a weighted or fuzzy SVM algorithm based on a multilayer Kohonen clustering. In this algorithm, we first apply a Kohonen clustering algorithm to assign input features to different clusters. Then a fuzzy or weighted SVM is applied to classify input data based on the assigned cluster. The advantage of this algorithm over the SVM classifier is that in the fuzzy mode, the input data is not exclusively assigned to a specified class and its membership function defines its dependency to different classes. Additionally, the clustering process increases the discrimination in the feature space.
A Kohonen network is an unsupervised clustering algorithm in which neurons are arranged as a 2D lattice as shown in figure 4. Each node and its weight vector define a cluster. Input patterns are compared to each cluster, and the best match shows the corresponding cluster. Mnimum Euclidean distance is usually used for comparison. Training a Kohonen network includes several steps as follows:
Each node's weights are initialized.
For each training data the best match or winning node is calculated.
The neighbourhood of the winning node is calculated. The amount of neighbours decreases over time.
The weights for the winning node and nodes in its neighbourhood are updated to be more similar to the input vector.

Structure of a single layer Kohonen network
We use a multilayer Kohonen network for the clustering of the proposed feature vector. A multilayer Kohonen network enhances the discrimination property of the clustering algorithm. In a multilayer Kohonen network, nodes of the current layer are fed into the next layer as an input vector. The node value in this network is determined by the sum of the products of input and weights. We use a three layer Kohonen network for the clustering of feature vectors. Figure 5 shows the structure and the nodes' values for a typical feature vector.
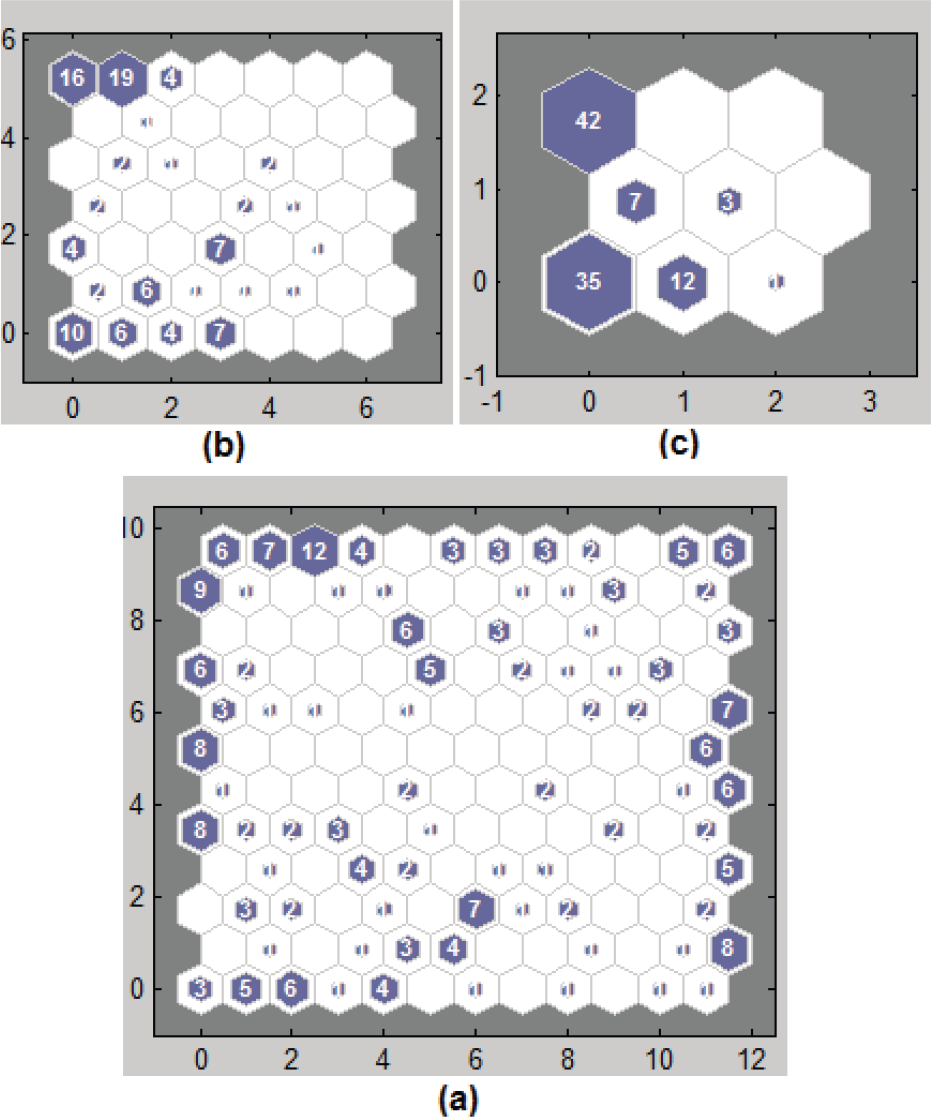
Structure and the nodes' values of the three layer Kohonen network for a typical feature vector, (a) first layer, (b) second layer and (c) third layer
2.3.1 Training process
Figure 6 shows the block diagram of the training process for the proposed algorithm. In this process, after clustering training data into N clusters using a multilayer Kohonen network, statistical features including the mean vector and the covariance matrix for the data of each cluster are calculated. Then SVM classifiers are also trained for each cluster independently. We use the SVM algorithm with different kernel functions such as linear, RBF, quadratic and polynomial. Average distances between training data and the corresponding hyperplane in each cluster are calculated and stored as well.
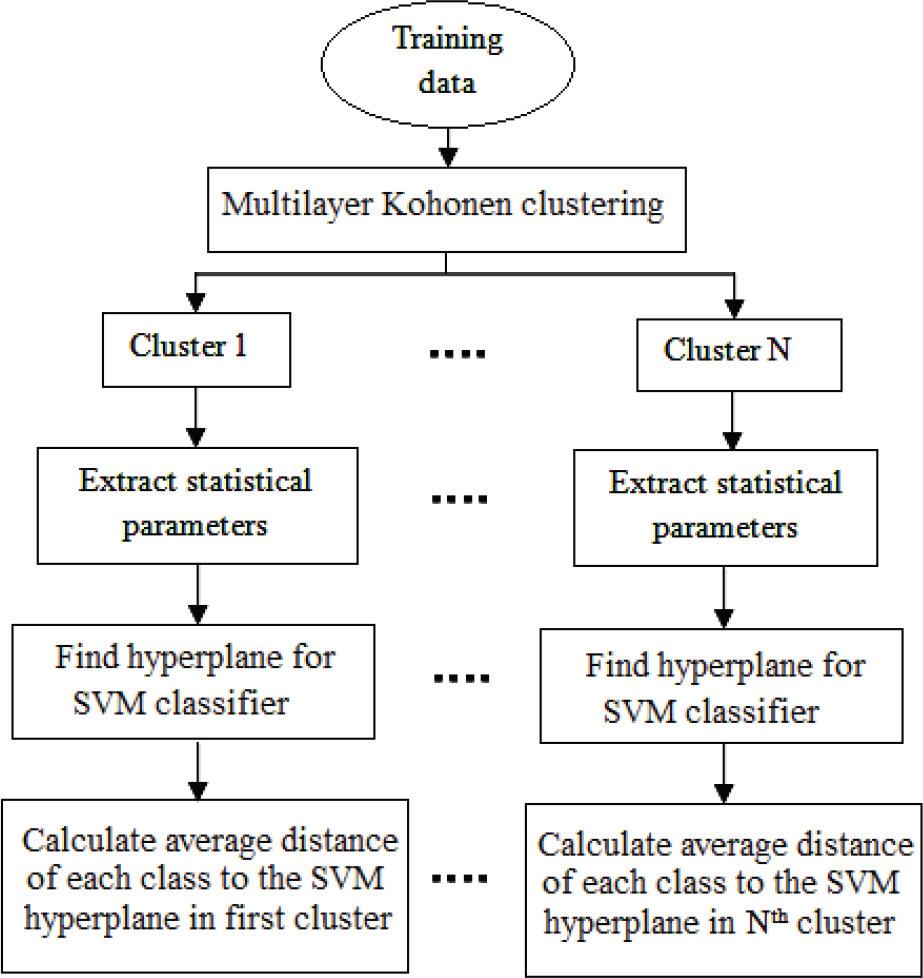
Block diagram of training process for the proposed fuzzy SVM classifier
The output of the training process includes parameters such as the mean vector and covariance matrix for training data in each cluster, the average distance of different classes in the clusters to SVM hyperplanes and the weights of hyperplanes. These parameters are employed in the test process.
2.3.2 Test process
Figure 7 shows the block scheme for the classification or the test process. For classification, the cluster weights for the input data are calculated in the first stage. Cluster weights are Mahalanobis distances between input data and N different clusters, which are calculated using the following equation:
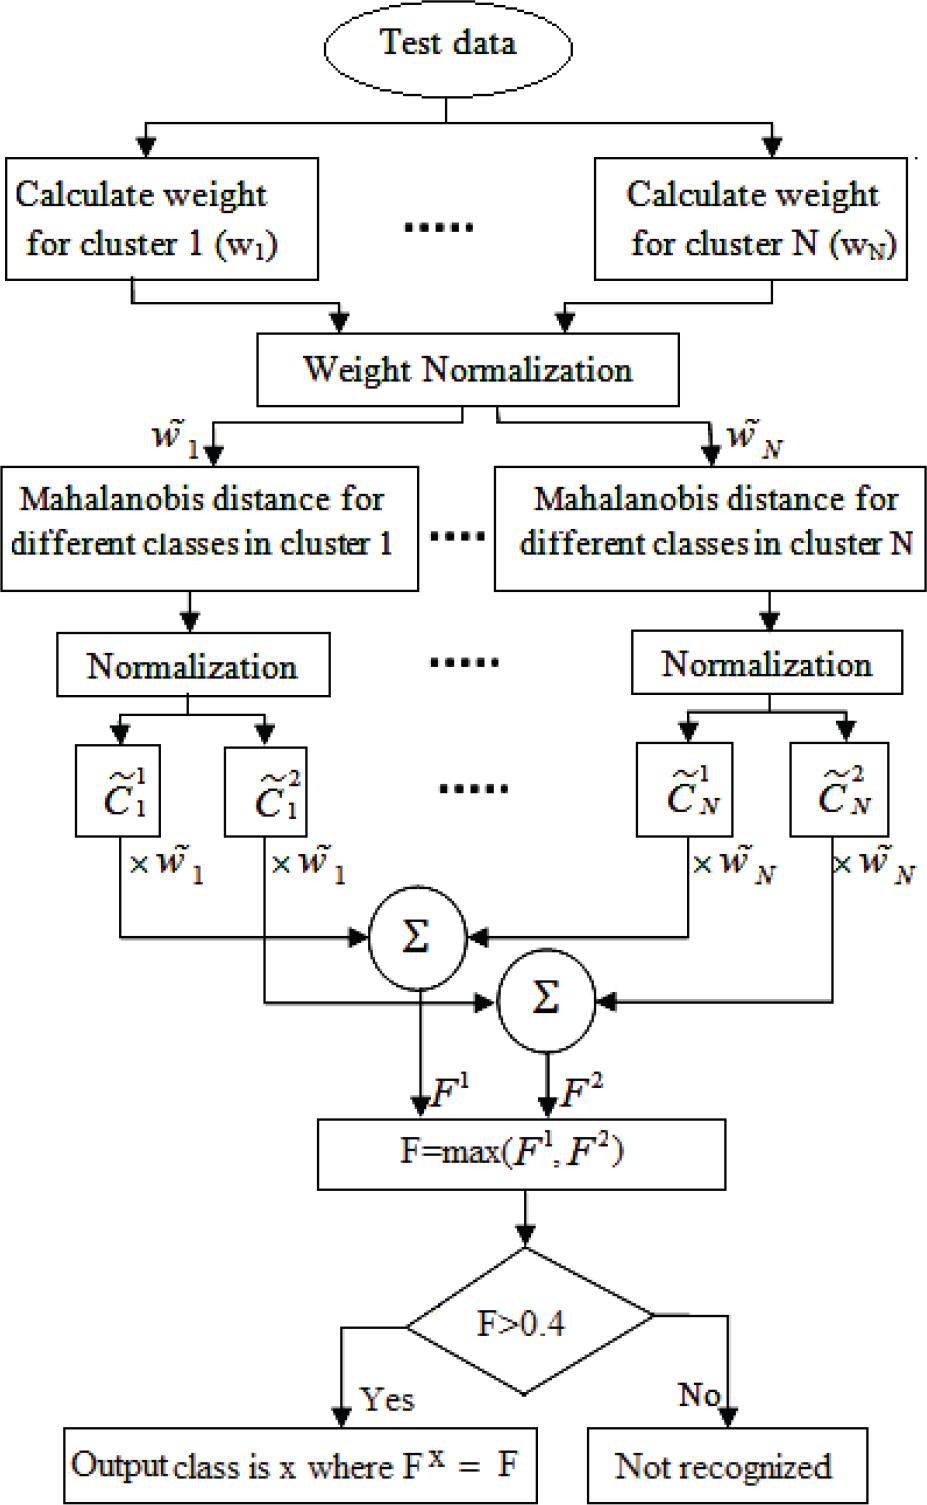
Block diagram for the test process

where ∊n and are the covariance matrix and mean vector for the nth cluster respectively and wn is the weight for cluster n.
We then normalize wn weights to values between 0 and 1 as follows:

where w˜n is the normalized cluster weight for the cluster n. We then calculate the Mahalanobis distances between the input data and the two different classes (obscene and normal) in each cluster. The calculated Mahalanobis distances between the input feature vector and the two different classes in a cluster is further normalized to a value between 0 and 1 and is represented by C˜mn where n and m are the cluster and class indexes respectively.
We then calculate the membership function of the input feature vector for each class using the following equation:

where Fm is the membership function of the input data for class m. Among the two resultant membership functions, the maximum value is selected and compared to a threshold value obtained experimentally. If it is less than the threshold value, it is known as a non-recognizable feature vector. Otherwise the related class is known as the winner class.
3. Experimental results
We implemented the proposed algorithm using a Matlab program and tested it with several video files. Our database includes 664 normal and 436 obscene videos in different sizes, formats and illumination conditions. Most of the database videos were collected from the Internet. Table 1 shows the different categories in the database and their temporal duration. Video files include different subjects like nature, sports, TV series, animations and videos containing close up face frames. They have different formats such as AVI, 3GP, MP4, RM, WMV, MOV, FLV, SWF, DAT and ASF. Figure 8 shows some examples of normal videos in the database. Time duration of the database for normal and obscene videos is 11899 and 3935 minutes respectively.
Different categories in the collected database and their duration


Sample frames of normal videos in the database
In order to test the capability of the proposed algorithm, random sets of videos are chosen as training and test data and the average results of all the tests are considered as the final result. We use 50% of the videos as training data and the remaining 50% as test data. To calculate the algorithm's parameters, such as the PCA and LDA parameters, skin regions and key frames are extracted for all frames of the database using the proposed methods. Then, after applying the feature extraction algorithms to the video episodes, the required parameters such as the mean vector and the covariance matrix for the PCA algorithm are calculated.
Table 2 shows the average recognition rate and the standard deviation of the proposed algorithm for 10 different tests. The table shows the results of the proposed algorithm for various SVM kernels. We tested the proposed algorithm with various SVM kernels such as linear, RBF, quadratic and RBF kernels. For each test, 6000 different video episodes are used to train and test the proposed algorithm.
Average recognition rate and standard deviation of the proposed algorithm for 10 different tests.
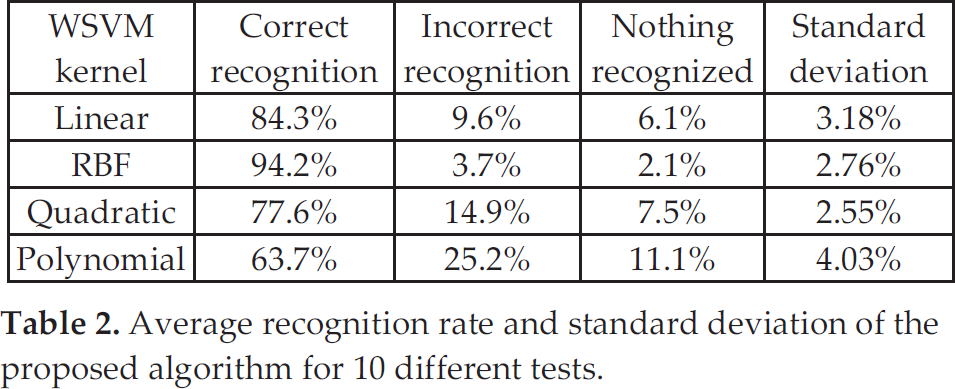
As the table shows, the proposed algorithm has a correct recognition rate of 94.2% with an incorrect recognition rate of 3.7%. The average processing rate, including frame capturing, feature extraction and classification of a video with a resolution of 337×452 pixels is about 18 frames/second.
We also tested the proposed algorithm with video files of various categories. Table 3 shows the average recognition rate of the proposed algorithm for video episodes with poor illumination.
Average recognition rate and standard deviation of the proposed algorithm for video episodes with poor illumination.

Table 4 shows the results of the proposed algorithm in recognizing obscene and normal animation videos. The table shows an average recognition rate of 90.3% with RBF and 91.2% with linear kernels. It means that the feature vectors for normal and obscene animation videos are linearly separable.
Average recognition rate and standard deviation of the proposed algorithm for normal and obscene animation videos.
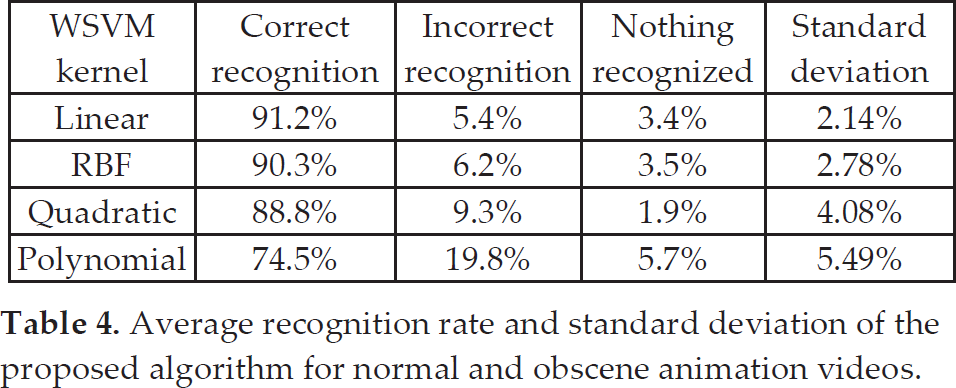
Table 5 shows the results of the proposed algorithm in recognizing obscene and normal animal videos. The table shows an average recognition rate of 96.3% with RBF kernel.
Average recognition rate and standard deviation of the proposed algorithm for normal and obscene animal videos.

To compare the results of the proposed algorithm with those of other methods, we also implemented the following algorithms:
Table 6 illustrates the average recognition rate for four implemented algorithms. To test different algorithms, we used the same data as described above for the results of table 2. As the table shows the proposed algorithm has enhanced the recognition rate by 8% in comparison with the existing methods.
Average recognition rate of the implemented methods

4. Conclusions
In this paper, a new method was presented for content-based obscene video recognition. The method employs three sets of features, 1- structural features based on singe frame information, 2- 3D spatiotemporal features and 3-features based on motion periodicity. To classify the proposed feature vector a new classifier called a fuzzy or weighted SVM was proposed. The proposed classifier employs a multilayer Kohonen network as an initial clustering algorithm to increase the discrimination of the extracted feature vectors. Experimental results showed a correct recognition rate of 94.2% with an incorrect recognition rate of 3.7%. The proposed algorithm is robust to changes in illumination and can be employed in recognizing videos in various categories.
Footnotes
5. Acknowledgments
This work was supported by the Iranian Research Institute for ICT (ITRC).