
Abstract
Eight human test subjects attempted to track a desired position trajectory with an instrumented manipulandum (MN). The test subjects used the MN with three different levels of stiffness. A transfer function was developed to represent the human application of a precision grip from the data when the test subjects initially displaced the MN so as to learn the position mapping from the MN onto the display. Another transfer function was formed from the data of the remainder of the experiments, after significant displacement of the MN occurred. Both of these transfer functions accurately modelled the system dynamics for a portion of the experiments, but neither was accurate for the duration of the experiments because the human grip dynamics changed while learning the position mapping. Thus, an adaptive system model was developed to describe the learning process of the human test subjects as they displaced the MN in order to gain knowledge of the position mapping. The adaptive system model was subsequently validated following comparison with the human test subject data. An examination of the average absolute error between the position predicted by the adaptive model and the actual experimental data yielded an overall average error of 0.34mm for all three levels of stiffness.
1. Introduction
Dexterous manipulation is a challenging task for autonomous robots [1]. Some artificial hands, like the Shadow Hand, the Gifu Hand and the Anatomically Correct Testbed Hand, appear anthropomorphic and have similar functionality to the human hand [2-5]. However, these manipulators lack the intellect that humans possess for learning from and adapting to variable parameters in an unstructured environment. Human hand control strategies, however, are complex [6] and clearly become more refined over time [7]. That humans require many years to develop sophisticated control of their hands is due to the many factors that affect precision grip, such as environmental stiffness [8]. A better understanding of people's learning processes during different manipulation tasks could be beneficial in imparting higher levels of autonomy to artificial hands. This is important not only for autonomous artificial hands but also for teleoperated manipulators, because there will always be some level of position mapping discrepancy between the desired and actual positions of teleoperated manipulators. It is thus important to understand and quantify how people adapt to these mapping errors [9-15], otherwise oscillations and position errors can occur when navigating a manipulator through a complex environment. This is especially important in the area of robot-assisted surgery, where precise position control is crucial [16, 17]. Accurate position mapping and control is also important during teleoperated needle insertion, as is the detection of tissue stiffness [18].
Stiffness detection is also important in the medical field in identifying differences between various kinds of tissue [19, 20]. One paper has shown that veterinarians have a greater ability to detect the stiffness of objects than do students who have less training [21], which implies that stiffness identification is a skill that can be developed. This is one reason why haptic feedback is useful in medical training simulators and during laparoscopic and robot-assisted surgery [22-24].
Another area of teleoperated robotics that could benefit from a better understanding of position mapping and the detection of environmental stiffness is upper limb prosthetics [25-27]. Since amputees have no tactile feedback about the grip force applied by the prosthesis, grasped objects can be inadvertently crushed or dropped. Different feedback strategies have been explored to ameliorate these problems [28-30].
The main contribution of this paper is the development of an adaptive dynamic model of human precision grip while interacting with initially unknown environmental stiffness. The ability of human test subjects to adapt to a mismatched position mapping between a MN and a display is investigated in [31]. As such, this research has applications for teleoperated robotics, where the desired position specified by the operator is often scaled in a manner that is initially unknown. This occurs in robot-assisted surgery and with upper limb prostheses [16, 17, 32].
There have been many descriptions of the kinematics of the human hand [33-36]. Moreover, a musculoskeletal dynamic model for multi-fingered hand movement has been developed [37]. Of course, one simple model of the human hand cannot accurately describe all the physiological control systems. However, task-specific models can be explored and developed which are accurate in describing the dynamics of the human-environment system in particular circumstances [38].
Along these lines, it was demonstrated in [39] that a linear second-order transfer function can accurately approximate the motor dynamics of voluntary human grip force application. In a similar vein, two transfer functions will be developed in this paper to approximate the motor dynamics of human precision grip while grasping a MN in order to track a desired position signal. The first transfer function will be developed based on the data from the test subjects as they initially learn the position mapping of the MN onto the position signal. The second transfer function will be based on the system dynamics after the test subjects have learned the position mapping through the displacement of the MN. However, neither of these system models is accurate over the whole course of the experiment because the human grip dynamics change as the position mapping is learned. Thus, an adaptive system model will be proposed that describes the learning process of the test subjects as they displace the MN. The adaptive model will be compared with the experimental results from the eight test subjects with three different levels of environmental stiffness and three different desired position trajectories.
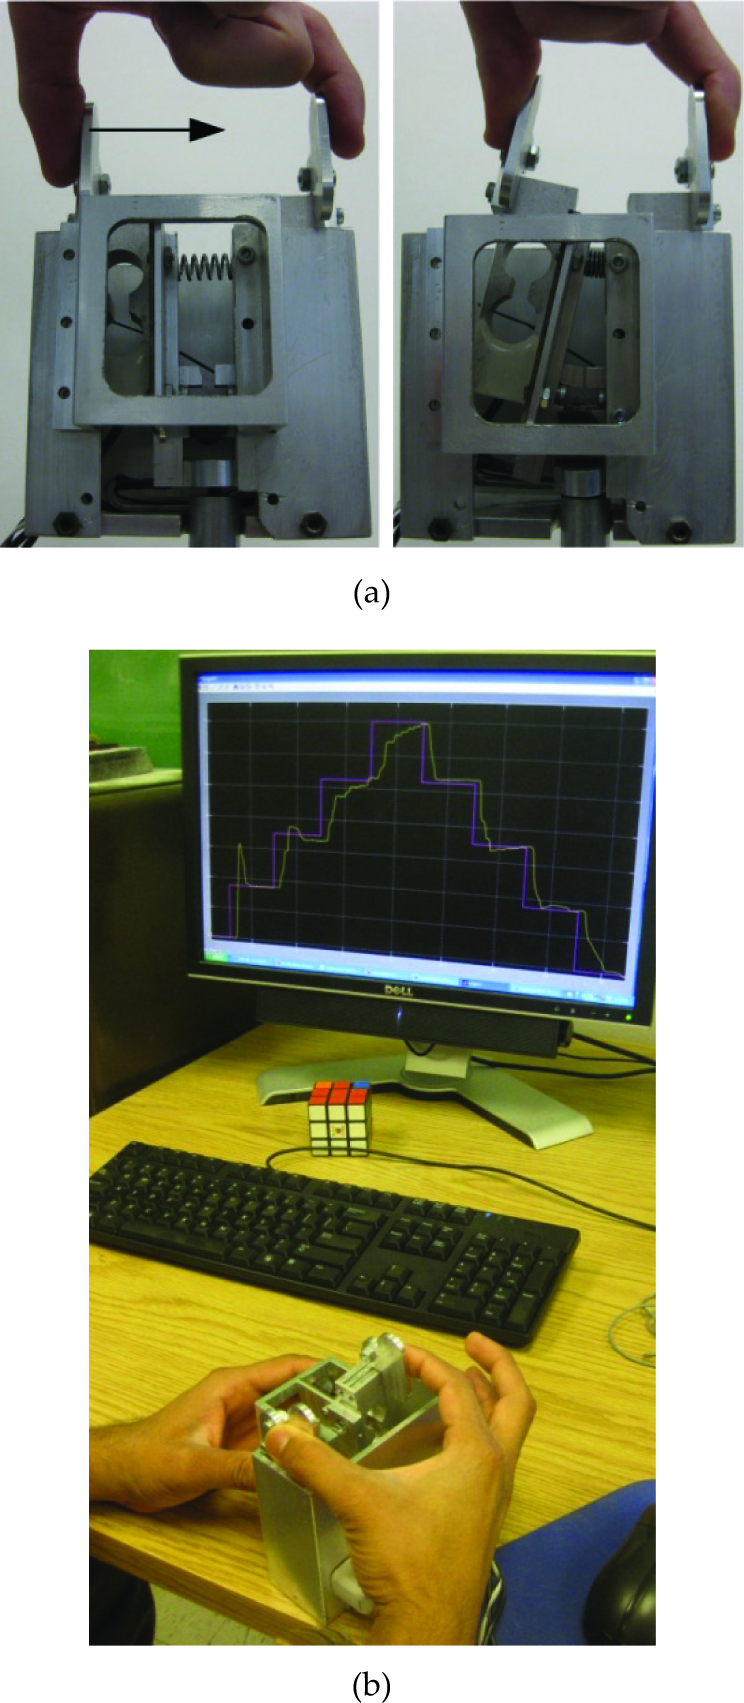
a. The manipulandum is instrumented with a Hall effect position sensor calibrated to indicate the displacement. One side of the manipulandum is fixed while the other side is free to rotate about the pin joint. Different springs can be placed within the manipulandum to alter the stiffness. b. A test subject attempting to make the position of the manipulandum match the desired position trajectory.
2. Manipulandum
The MN used in this paper has a slot inside which springs of different stiffness can be placed to alter the mechanical properties of the object (Figure 1a). Two flat plates are mounted to the MN to accommodate the thumb and the index finger. One of these plates is fixed while the other plate is free to pivot about a pin joint at the base. The maximum displacement of the MN is 25mm. There is an A1321 Hall effect sensor (Allegro Micro Systems Inc., Worcester, USA) mounted at the base of the MN to measure the displacement. This position sensor is calibrated to indicate the displacement of the free side of the MN. The displacement of the MN completely depends upon the human test subject, since the MN has no intrinsic actuator.
3. Experimental Methods
Eight human test subjects (seven males and one female) participated in this study after giving informed consent in accordance with the IRB protocol. Each test subject was given the instrumented MN to hold in an orientation that was comfortable with their left hands while grasping the MN with their right thumb and index finger (Figure 1b). The test subjects placed their thumbs on the fixed side of the MN and used their index fingers to displace the free side of the MN.
Next, a visual stimulus was displayed on a computer monitor using MATLAB/Simulink. The position from the MN was also simultaneously displayed on the screen (Figure 1b). The Hall effect position sensor data was sampled with a 1kHz frequency using the real-time Windows target kernel. The position mapping was implemented such that 1mm of displacement at the fingertips produced 3.54mm of displacement on the display.
Three desired position trajectories were displayed for the test subjects to track. The first visual stimulus was comprised of a pyramidal trajectory of step inputs (Figure 1b). The second trajectory consisted of a sequence of step inputs followed by ramps and then two sinusoids. Immediately after the second trajectory, the third trajectory was displayed to track. However, the third trajectory was simply a repeat of the same step inputs from the beginning of the second trajectory.
The task given to the eight test subjects was to minimize the difference between the desired position trajectories and the position signal from the MN through a change in the applied grip force. Each test subject performed this procedure with three different linear springs with stiffnesses of K1 = 0.876N/mm, K2 = 3.33N/mm and K3 = 6.48N/mm. The order of the spring stiffness on the first and second inputs was randomized for each test subject.
The test subjects were not told which spring would be used on any trial ahead of time. The chronological order of the first and second inputs was also randomized among test subjects. However, the same spring from the second input was used on the third input, which occurred shortly after the second input. This was done to ascertain the extent that the subjects learned from their prior experiences with the same trajectory and stiffness.
The percentage overshoot (OS) and peak time (tP) of each individual for each of the first seven step inputs of the pyramidal input was calculated in MATLAB. OS and tP data from the eighth and final step of the pyramidal input was neglected because this occurs at a boundary condition where the test subjects would have to remove their hands from the MN if significant OS occurred. The OS and tP data was also calculated from the steps of the second and third trajectories. The OS and tP data was then used to calculate the pole locations of second-order systems [40] which have been used in the past to model the dynamics of human grip [39].
The OS is used to determine the pole locations of a second-order transfer function because the OS is calculated relative to the response data itself and is not reliant on the magnitude of the input. Likewise, tP was chosen because of its correlation with the maximum peak used in the calculation of the OS [40]. The tP was calculated to be the time from when the humans reacted to the change in the desired position until the time when they reached their maximum position value for each step. The steady state value of the human response data corresponding to each step input was taken to be the average of the last ¼ second of data before the next change in the desired position amplitude.
This data from the step responses was used to develop two linear second-order transfer functions of the human-MN system. The first transfer function is based on the dynamic response of the test subjects during the first step of the input as they initially displaced the MN to learn the position mapping and stiffness of the system. The second transfer function is based on data from the subsequent steps of the trajectories, after displacing the MN and gaining knowledge of the position mapping and stiffness setting. For the purposes of this paper, the transfer function based on the data from the first step is referred to as the uninformed system model, before significant displacement of the MN occurs. The system model created from the data of the subsequent steps is referred to as the informed system model, because the test subjects had already displaced the MN at this time to obtain knowledge of the position mapping and stiffness.
The two linear transfer functions for the informed and uninformed system models are then convolved with a time delay. The delay time is calculated from the average amount of time between a change of the desired position trajectory displayed on the monitor and the reactions of the human test subjects.
As will be described, neither of the two linear transfer functions accurately captures the dynamics of the human data over the entire course of the experiments. Thus, an adaptive system model will be developed to quantify the dynamic way in which the test subjects altered their hand control strategies as they displaced the MN.
A simulation of the two transfer functions and the adaptive system model in response to the same three inputs is compared to the experimental data in Simulink.
A two-way analysis of variance (ANOVA) is performed on the OS and tP data from the test subject responses and system models with the anova2 function in MATLAB. The average absolute relative error between the three different system models and the experimental data is also calculated in MATLAB. Another two-way ANOVA test is performed on the error data to determine if the models are statistically different from each other.
4. Experimental Results from the Test Subjects
There was a marked similarity among the grip responses of all eight test subjects at each level of stiffness with the first input (Figure 2, Figure 3).
The OS and tP for all eight test subjects were averaged together at each of the seven steps. The average tP and OS were calculated from 168 cases produced from the eight test subjects interacting with the three different springs at each of the first seven steps of the pyramidal input (Table 1).
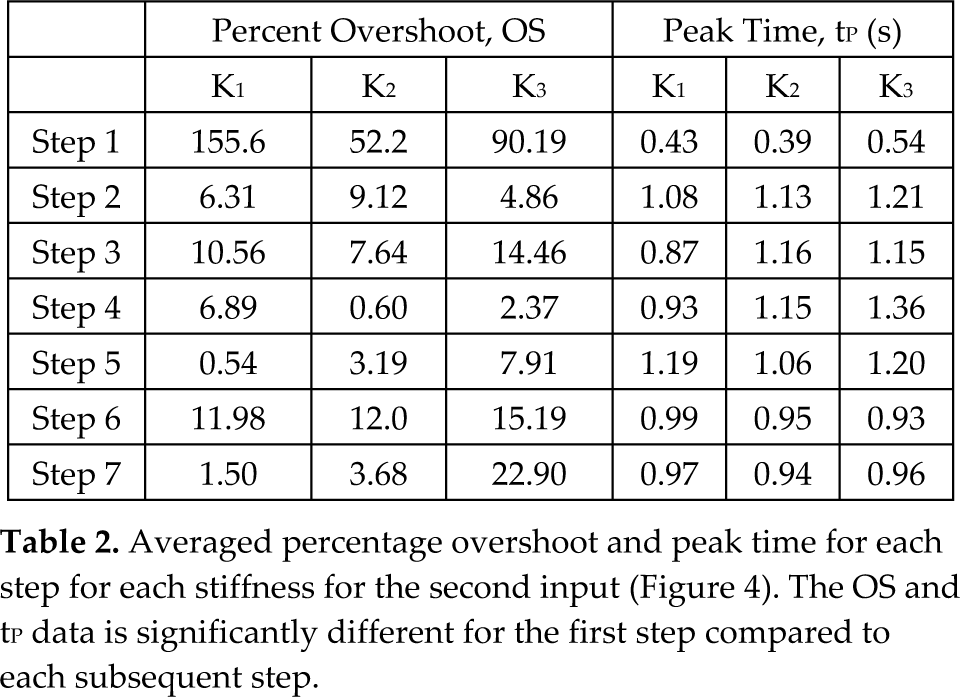
Note that there was a consistent trend of a large OS and a quick tP on the first step of the input compared to all the subsequent steps. The results from the second and third trajectories also displayed a similar trait of a large OS and a quick tP on the first steps of the inputs. The average response of all eight test subjects from the second and third inputs for each stiffness level are shown in Figure 4 and Figure 5, respectively. The corresponding OS and tP data from the second and third inputs are shown in Table 2 and Table 3, respectively. This data was formed from 384 step responses from the eight test subjects. On average, there was much more OS and a quicker tP at the beginning of each experiment when compared with the end of the experiments.
The two-way ANOVA performed on the OS data from the first input from Table 1 shows a statistically significant difference between the OS that occurred on the seven steps (p < 0.01). However, there was no statistically significant difference between the OS and the stiffness of the MN (p = 0.44). The two-way ANOVA performed on the tP data from Table 1 also shows a statistically significant difference between the tP that occurred on the seven steps (p = 0.03). Once again, there was no statistically significant difference between the tP and the stiffness of the MN (p = 0.74).
Another two-way ANOVA was performed on the OS and tP data from steps 2-7 of the first input. When the data from the first step is not included in the test, there is no statistically significant difference in OS (p = 0.52) or tP (p = 0.17) and the step input. With respect to the stiffness of the system in this case, there was, again, no statistically significant difference in relation to the OS (p = 0.10) or to tP (p = 0.74).
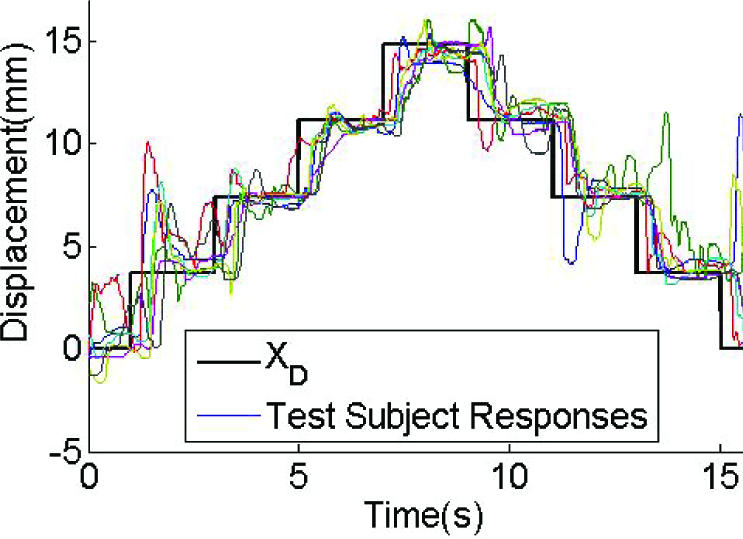
The position tracking response from the eight test subjects with a stiffness setting K2. See Table 1 for the average OS and tP data for this input and stiffness.
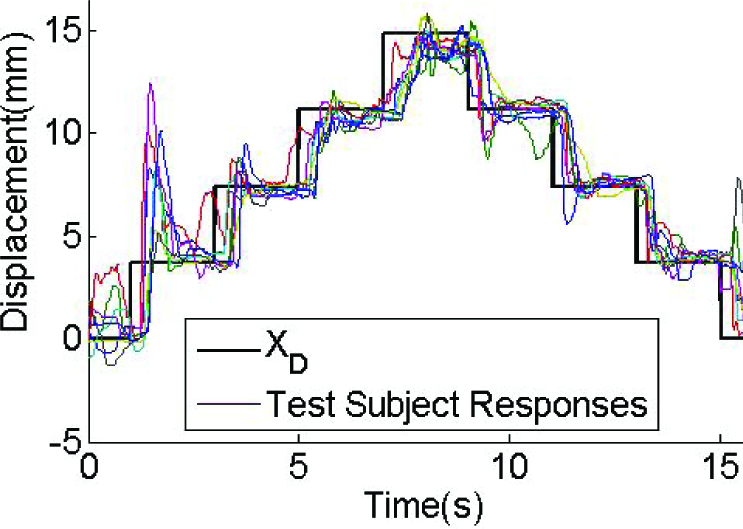
The position tracking response from the eight test subjects with a stiffness setting K3. See Table 1 for the average OS and tP data for this input and stiffness.


The average response of the eight test subjects for each of the three spring stiffness settings for the second input. Note the large percentage overshoot on the first step, as the test subjects initially displaced the manipulandum to learn the position mapping of the system. See Table 2 for the average OS and tP data for this input.
The averaged position tracking response from the eight test subjects with all three stiffness levels while tracking the third input. Once again, there is a large OS and quick tP on the first step. See Table 3 for the average OS and tP data for this input.
A two-way ANOVA was also performed on the OS and tP data from Table 2 and Table 3. There was, again, a statistically significant difference in the OS and tP data with respect to the step input when the data from all seven steps is included in the ANOVA (p < 0.01). As before, there was no significant difference with respect to the stiffness of the MN (p > 0.05). Once again, when the first step from the second and third inputs is not included in the two-way ANOVA tests, there is no significant difference in OS or tP with respect to the step input (p > 0.05). The stiffness of the MN did not have a significant impact on the OS or the tP in any of the experiments (p > 0.05).
What these results indicate is that the OS and tP data of the human test subjects for the three inputs is independent of stiffness (over the range of stiffness values tested). This is consistent with a prior study that reported that human cortical muscular coherence is related to digit displacement, not object compliance [41]. However, the OS data from Table 1, Table 2 and Table 3 is significantly different for the first step compared to the subsequent steps. This is also visually obvious from the experimental data in Figures 2-5, where there is substantially and consistently more OS and a quicker tP for the first steps relative to the subsequent steps. This indicates that the human grip dynamics changed with increasing MN displacement.
Because the test subjects exhibited statistically significant differences among their responses for the first step compared to the subsequent steps, the average data from the first step of the three inputs will be used to formulate a second-order transfer function so as to model the dynamics of the test subjects before learning the mapping of their fingertip positions with respect to the displayed position signal (the uninformed human model). The average of the tP and OS data from the subsequent steps will be used to create a different second-order transfer function to model the data from the eight test subjects after the first step, when more knowledge of the position mapping has been obtained (the informed human model). These two different system models are required to accurately describe the dynamics of the test subjects before and after learning the position mapping of the MN to the monitor.
Averaged percentage overshoot and peak time for each step for each stiffness for the second input (Figure 4). The OS and tP data is significantly different for the first step compared to each subsequent step.
Averaged percentage overshoot and peak time for each step for each stiffness for the third input (Figure 5). The OS and tP data is significantly different for the first step compared to each subsequent step.

Since there is no statistically significant difference in any of the human data pertaining to system stiffness, the OS and tP data are averaged together for the three stiffness levels on each step to form the two transfer functions. For the first step, the average tP and OS were 0.499s and 85.74%, respectively. For steps 2-7, the average tP and OS were 0.934s and 7.15%, respectively. These overall averages further illustrate that the test subjects consistently had significantly more OS and a quicker tP for the first steps of each input compared to the subsequent steps.
The average delay time between the change of the desired input and the responses of the human test subjects is 198ms. The tP calculations do not include the delay time, since that would inaccurately alter the pole locations of the linear second-order transfer functions.
5. Development and Simulation of Transfer Functions to Model Human Data
The use of the aforementioned values of OS allowed the calculation of the damping ratio (ζ of the second-order system transfer function's approximations of the data from the first step (for the uninformed human model) and another damping ratio from the average of the subsequent steps (for the informed human model) via:

This enabled the calculation of ζ for the uninformed and informed system models before and after the test subjects effected significant MN displacement, respectively. Knowledge of ζ and tP then permitted the natural frequency (ωn) of the uninformed and informed human models to be calculated through:

Equations (1) and (2) are found in [40].
5.1. Uniformed Human Model
The second-order system transfer function that best describes the step response of the uninformed human test subjects for the first step input (before they have gained appreciable knowledge of the position mapping) is:
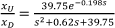
when convolved with the time delay of 198ms caused by the reaction time of the test subjects to the visual stimulus. xD is the desired position trajectory displayed on the monitor. xU is the position response of the uninformed system model. This transfer function is based on the calculated values of ζ = 0.049, ωn = 6.30rad/s from (1) and (2) with tP = 0.499s and OS = 85.74%.
5.2. Informed Human Model
In a similar fashion, the model of the human test subjects after they have learned the position mapping of the system can be expressed as:

where xi is the position response of the informed test subject, after displacing the MN and gaining knowledge of the position mapping. This transfer function is based on the calculated values of ζ = 0.643 and ωn = 4.40rad/s (using (1) and (2)) with tP = 0.934s and OS = 7.15%.

The uninformed system model (3) response (xd) to the desired pyramidical input (xd) matches the OS from test subject responses for the first step but is highly oscillatory for the remainder of the experiment. In contrast, the informed system model (4) response xi matches the test subject data during the remainder of the experiment but does not accurately capture the system dynamics as the test subjects initially learned the position mapping by displacing the manipulandum on the first step.
5.3. Simulation of the Uninformed and Informed Models
The response of each system model ((3) and (4)) xu and xi to the first input is shown in Figure 6. From this plot, the limitations and benefits of each model are clear. The uninformed model closely matches the OS of the human data for the first step but is highly oscillatory on each subsequent step. In contrast, the informed human model does not capture the large amount of OS seen on the first step well while the test subjects are adapting to the position mapping. However, the informed human model offers a good approximation of the human data during the remainder of the experiments, as will be subsequently demonstrated.
6. Adaptive Human Model Development
People use adaptive motor control gains when interacting with the environment [42]. Also, it has also been reported that human cortical muscular coherence is related to digit displacement, not the compliance of the grasped object [41]. Based on these observations and the previously presented step response data, an adaptive model is developed that merges the uninformed model (3) with the informed model (4). Adaptive system gains are described as a function of MN displacement (Δ) so that the uninformed model (3) approaches the informed human model (4) as the MN is displaced through the force fields. It is convenient to express the adaptive control system, excluding the time delay, in state space form:


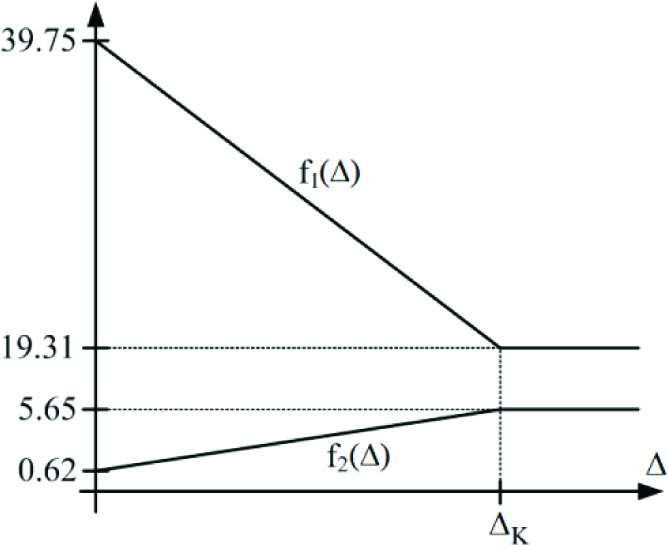
x1 is the position, x2 is the velocity and ẋ2 is the acceleration. Δ = x1 – x0, where x0 is the initial condition of the position state. The piecewise linear adaptive gains f1(Δ) and f2(Δ) are depicted in Figure 7. These adaptive gains cause the uninformed human system model (3) to approach the informed system model (4) as the MN is displaced. Δk is constant and scales the slope of the linear gains. The adaptive gain functions f1(Δ) and f2(Δ) are defined as zero when Δ < 0 because the test subjects would have to open their hands wider than the width of the MN, resulting in x1 = 0. The models are invalid in this scenario because the test subjects would no longer be in contact with the MN. The adaptive feedback model is depicted as a double integrator system with the 198ms time delay (Figure 8).
7. Simulation Results
The response of the adaptive model (Figure 8) to the pyramidal trajectory is shown in Figure 9 (top), as are the variable feedback gains f1(Δ) and f2(Δ). A brute force examination revealed that Δk = 1.87mm produces the least error in the adaptive model. This is also true because 1.87mm is slightly larger in amplitude than the first step input of the trajectory. After the first step, the dynamics of the test subjects showed no significant difference for the subsequent steps.
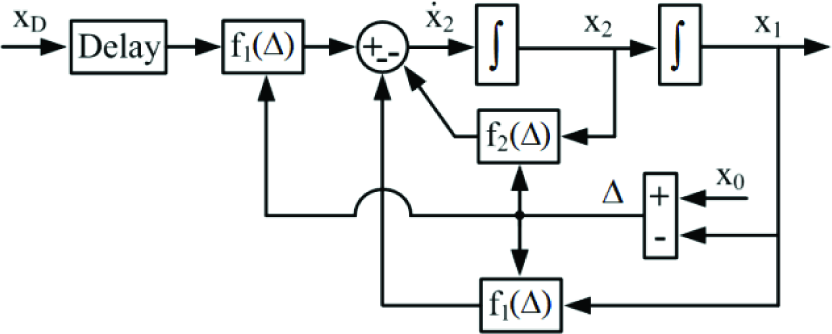
Adaptive system model. Gains f1(Δ) and f2(Δ) change as system displacement occurs, modeling the change in human system dynamics as the position mapping is learned by displacing the manipulandum.

The adaptive system model response to the pyramidical input. Note that the large percentage overshoot on the first step is created through the adaptive gain terms f1(Δ) and f2(Δ) which vary with system displacement.
The effect of the adaptive gains is apparent because of the large OS on the first step compared with the other steps. In Figure 10, the adaptive model is also plotted with the average of the eight test subject responses for each of the three stiffness settings for the first input.
The adaptive model matches the experimental data well, significantly better than either the informed or uninformed transfer functions. This is evident from the error plots between the three system models and the average of the test subject data on each of the three stiffness levels (Figure 11). The adaptive model has significantly less error with the first input (Figures 2, 3, and 10) than either the informed or uninformed models (p < 0.05) throughout the simulations (Table 4).
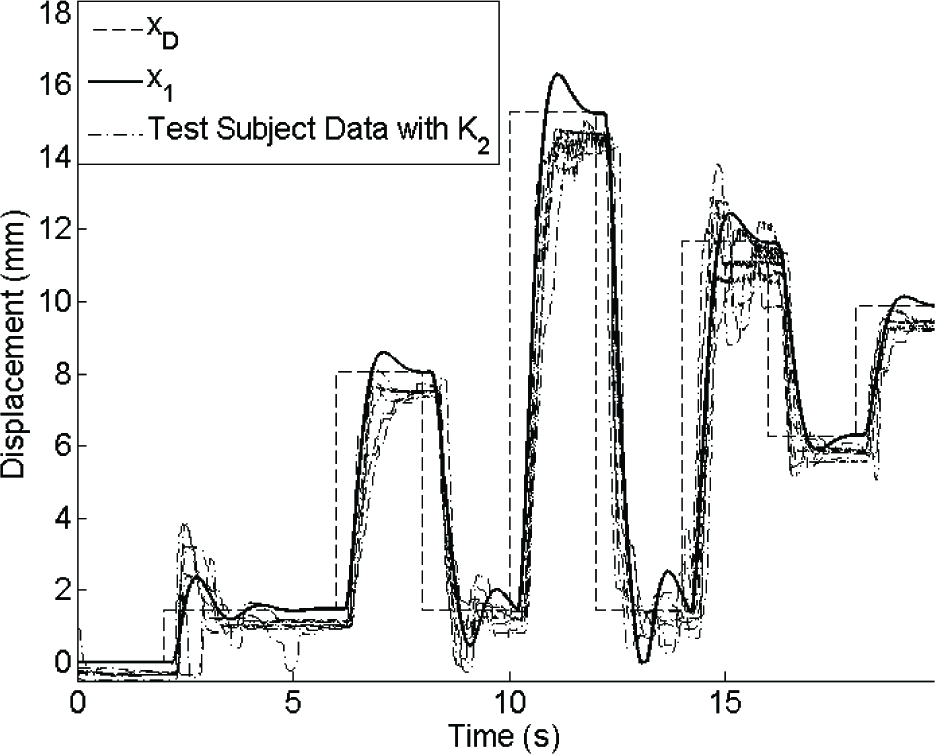
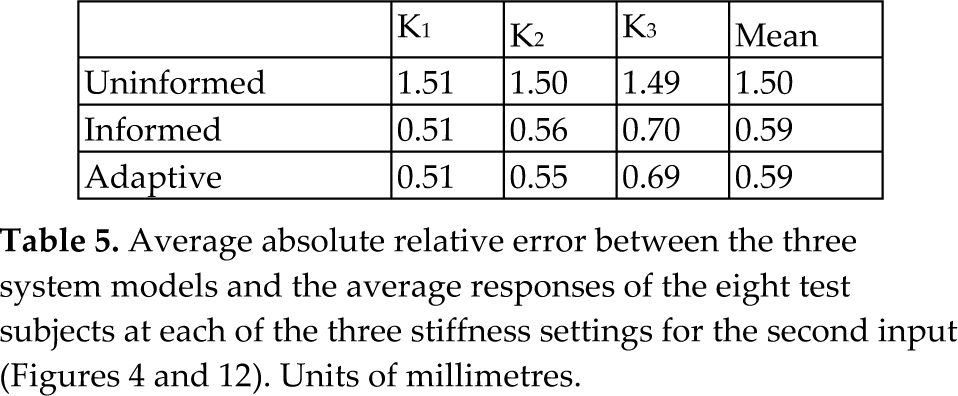
The response of the adaptive model is also shown with respect to the individual test subject response data from the second and third inputs with spring stiffness K2 (Figure 12, Figure 13). The adaptive model again captures the trait of a large OS and quick tP on the first step of these two trajectories well. The OS is substantially less for the subsequent steps in order to model how the test subjects learned the position mapping of the MN. The response of the adaptive model also tracks the human data well during the sinusoidal and ramp portions of the second trajectory. The average absolute relative error for each model with the three stiffness levels is shown in Table 5 for the second input (Figures 4 and 12) and Table 6 for the third input (Figures 5 and 13).

The position tracking response of the adaptive system model from (5) and (6) with the first input. The average of the test subject responses for each of the three stiffness settings are also plotted. The large overshoot from the adaptive model for the first step closely matches the experimental data. The adaptive model also closely predicts the system response for the remainder of the experiment.

(Top) The position tracking error of the uninformed system model to the pyramidical input for stiffness K1 (eu1), K2 (eu2) and K3 (eu3). (Middle) The position tracking error of the informed system model to the pyramidical input for stiffness K1 (ei1), K2 (ei2) and K3 (ei3). (Bottom) The position tracking error of the adaptive system model to the pyramidical input for stiffness K1 (ea2), K2 (ea2) and K3 (ea3) is significantly lower than the errors for the informed and uninformed system models.

The individual position tracking responses of the eight test subjects and the response of the adaptive system model for the second input and the K2 stiffness level.
The individual test subject responses while tracking the third input with the K2 stiffness setting.
The adaptive and informed system models have significantly less error than the uninformed system model for the second input (p < 0.01). However, the adaptive and informed system models are nearly identical in terms of average error for the second input. This is because the learning process of the test subjects occurs over a very short percentage of time for the second input, which lasted 49s in total.
However, the adaptive model has significantly less error with the first and third inputs because the learning process of the test subjects occupies a greater overall percentage of time of the experiment. Moreover, when the data from Table 4, Table 5 and Table 6 are averaged together, the adaptive controller predicts the human data better than the informed and uninformed models with high significance (p < 0.01). In addition, the overall average errors from Table 4–6 have no significant difference with respect to the MN stiffness (p > 0.05).


The overall average error from the three inputs of the uninformed and informed system models are 0.83mm and 0.41mm, respectively. The absolute error of the adaptive model is 0.34mm when the error data from the three inputs is averaged together. This is significantly less error than is produced by either the informed or the uninformed system models (p < 0.01).
The reason why the adaptive system model more accurately represents the dynamics of the human data can be demonstrated by a three-dimensional root locus (Figure 14) [40]. The real components of the adaptive system poles become larger in magnitude while the imaginary components become smaller as displacement increases, signifying that the informed system model is less oscillatory and slower in response. Furthermore, the real and imaginary components of the adaptive system poles do not change once Δ ≥ Δk. This is consistent with the experimental data from the test subjects, which showed no significant differences in the transient responses after significant displacement of the MN.
8. Discussion
One past study has indicated that there is a significant correlation between cortical muscular coherence and the compliance of a grasped object [43]. However, it has also been reported that cortical muscular coherence is directly related to digit movement rather than to object compliance [41]. The results presented in this paper clearly indicate that people's grip responses had no statistical significance with respect to MN stiffness over the range of 0.876N/mm to 6.48N/mm.
One possible way to reconcile the discrepancy between [43] and [41] is to note that the appropriate motor response may initially be carried out under tight cortical control. Once the object parameters are appropriately learned, subcortical mechanisms can dictate the remainder of the grasp task [44]. This can be achieved through a probing strategy similar to that mentioned in [8] so as to learn the environmental stiffness. This is consistent with the observation in [45] that humans cannot ascertain the stiffness of the environment while maintaining a static posture. After the MN stiffness is detected, motor control strategies are altered.
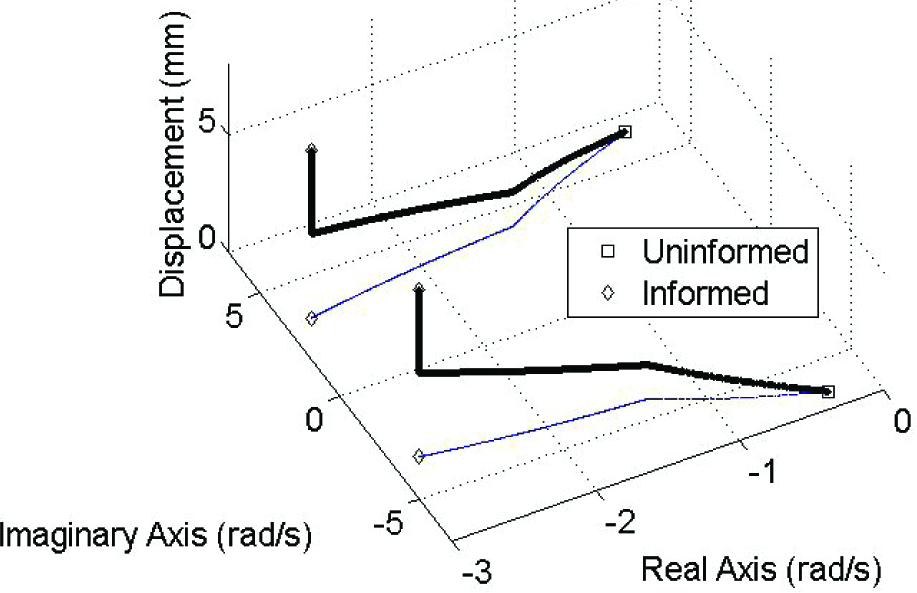
The root locus of the adaptive system model as displacement occurs during the first input. The thick line shows how the system pole locations and, thus, the dynamics of the system, do not change once Δ ≥ Δk. The thin line shows the projection of the root locus into the real-imaginary plane. The uninformed system poles move farther from the imaginary axis and closer to the real axis, approaching the informed system model as displacement occurs.
This is a feasible explanation having examined the step response data in this paper, which shows a large amount of OS for the first step input and much less OS for the subsequent steps. Note that the stiffness was varied among three substantially different levels (K3 = 7.40K1 = 1.95K2), yet the stiffness consistently had no significant impact upon the human response data. Thus, it is likely that stiffness variation has little effect on human system dynamics (over the range of stiffnesses used by the test subjects in this paper). The discrepancy between the position mapping from the MN to the displayed desired position is thus the most likely explanation for the adaptive variation in the dynamic response of the human test subjects. That there was a large OS for the first step is likely because 1mm of displacement at the fingertips produced 3.54mm of displacement on the monitor. Because the ratios of the position mappings of control interfaces to teleoperated manipulators are usually less than one [10, 13], this was a reasonable case to evaluate. For example, the “wrist” of the da Vinci robot [17] can pronate and supinate 1.5 revolutions, while the human wrist can only pronate/supinate roughly ½ a revolution [46], which is approximately the same position mapping ratio examined in this paper.
The stiffness of the MN was varied by as much as 740% without significantly impacting the human system dynamics. Thus, the experimental data also suggests the presence of an adaptive grip force control strategy that is based on the detected stiffness of the MN. This adaptive grip control strategy produces a comparable system dynamic response over a wide range of system stiffnesses. While it has been known for some time that people can discern the compliance of the environment [47] and that the mechanical impedance of humans can be controlled through a coactivation of antagonistic muscle groups [48]; the experimental results presented herein also suggest that these capabilities are incorporated into the closed loop feedback system in order to achieve position control.
Also of interest is the fact that the data from the third input exhibits very similar trends compared with the second and first inputs: the tP and OS data was significantly different for the first step compared with the subsequent steps. However, the third input (Figure 13) immediately followed the second input (Figure 12) without a change of the system stiffness and was a simple repetition of the first series of steps from the beginning of the second input. In other words, the position mapping information gained by the test subjects was forgotten for the next series of steps at the beginning of the third input. However, there was once again no significant difference in the human response with respect to the stiffness of the system.
9. Conclusion
Two transfer functions have been developed to model human precision grip while tracking a position trajectory for three different system stiffness settings. The uninformed transfer function was developed to capture the dynamics of the test subjects as they initially learned the position mapping from the MN to the display. The informed transfer function was developed to model the responses of the test subjects after significant MN displacement had been effected. Since neither transfer function adequately modelled the human data for the entire experiment, an adaptive model was developed that merged the uninformed human model with the informed human model. This adaptive system model accurately captured both the initial portion of the experiments while the test subjects initially displaced the MN to learn the position mapping, and also the remainder of the experiments after the test subjects had gained knowledge of the mapping. The adaptive system model predicted the human dynamic response of the test subjects with high accuracy while tracking step inputs, sinusoids and ramps.
The adaptive model presented in this paper has applications in the neurophysiology, robotics and control communities. The ability to adaptively vary the system gains of a prosthetic hand relative to the detected object stiffness has been shown to be useful for prosthetic hands [25]. These concepts can be extended to dexterous robotic hands for control strategies and object recognition applications as well. This research could also be used to simulate how amputees will use their prosthetic hands to interact with the environment as well as to provide a baseline of comparison for better-than-biology manipulators. Furthermore, the adaptive model could be useful for medical simulation trainers and laparoscopic instrument design. Robot-assisted surgery is another application that would benefit from this research, as the surgeon often only has visual feedback concerning the force applied to the grasped tissue. The hand motion of the surgeons is then mapped to the motion of the robotic manipulators in a manner that is not immediately intuitive, because the dexterity of the robotic arms exceeds that which is possible for the human arm. During laparoscopic surgery, the hand motions of surgeons also have a different position mapping relative to the opening and closing motions of the instruments. These kinds of position mapping discrepancies are analogous to the position mapping mismatch investigated in this paper.