
Abstract
Although there is broad agreement that ambidexterity somehow relates to the simultaneous pursuit of exploratory and exploitative activities, a lack of conceptual clarity exists regarding the extent to which ambidexterity concerns matching the magnitude (BD) of exploration and exploitation on a relative basis, or concerns the combined magnitude (CD) of both activities. This fragmentation has inspired different operationalization of the construct and limited its usefulness, both for scholars and practitioners, since interpretations, comparisons and analysis between cross studies or research have become more difficult. This article proposes and tests an alternative measure of ambidexterity, which attempts to simultaneously and explicitly include in an overall index both the combined (CD) and the balanced dimension (BD).
1. Introduction
The ET-ET problem is intrinsic to the continuous innovation concept, which is defined as the (dynamic) capability to combine operational effectiveness and strategic flexibility [1, 2], [3]. Born in the field of product development, CI has rapidly embraced a broader perspective that has spanned organizational boundaries to reach the topic of innovation management. In doing this, however, CI has maintained a focus on the ambidextrous combination of exploration and exploitation through a continuous cross-disciplinary, cross-functional and evolutionary process, which provides a paradoxical perspective to analyse the tensions characterizing the dichotomous nature of exploration and exploitation. In fact, CI is positioned at the intersection of the three aforementioned theoretical lenses, which are not only highly overlapped, but also have boundaries that tend to remain blurred (see [2] for a review). If further research is necessary to clarify these boundaries, the current interrelatedness is so intense that the isolation of the contributions provided by each stream to the CI literature is not a simple operation. This paper faces the problem of how to measure the ET-ET construct in survey from a methodological point of view. In doing so, it refers to the Organizational Ambidexterity (OA) literature for an in-depth review of the constructs and measures.
The theme of OA has been widely debated in literature and the construct has attracted the growing attention of different literature streams, especially in innovation management. Nevertheless, in the last decade researchers have diversely interpreted OA referring to the tensions in different issues – innovation [4,4], competences [6], adaptation [7], strategies [8], supply chain [9], alliances [10, 11], ICT [12, 13] – and at different levels of analysis – network, firm, business unit, multi-unit, process, practice and individual [14, 15]. This fragmentation has inspired different operationalization of the OA concept and limited its usefulness, both for scholars and practitioners, since interpretations, comparisons and analysis between cross studies or research become more difficult. In addition, although there is broad agreement that OA somehow relates to the simultaneous pursuit of exploratory and exploitative activities (i.e., ET-ET), a lack of conceptual clarity exists regarding the extent to which ambidexterity concerns matching the magnitude of exploration and exploitation [5] on a relative basis, or concerns the combined magnitude of both activities [16].
Specifically, authors have measured the OA construct mostly combining two main features: the balance dimension of ambidexterity (BD) and its combined dimension (CD). BD corresponds to a firm's orientation to maintain a close relative balance between exploratory and exploitative activities, whereas CD corresponds to their combined magnitude. The two dimensions are usually interpreted as conceptually distinct [16], and rely on different causal mechanisms to enhance firm performance. Many authors have investigated exploitation and exploration impact on firm performance at different levels of analysis, also interpreting their interaction effect according to the different conceptualization of OA. Despite there being a general agreement on the benefits of ambidexterity, quantitative evidence in empirical study is mixed and conditioned by two difficulties: collecting actual measures of firm financial performance (previous empirical studies rarely took into account both the short-term and long-term performance effects of innovation initiatives) and operationalizing and measuring ambidexterity [17].
All of these measures clearly show a number of strengths and threats, both from a conceptual and operational point of view. However, how to measure the ET-ET in survey is an open problem and an integrated (and “balanced”) measure of it does not exist.
The objective of this work is to review and analyse the measures which are currently adopted to operationalize OA dimensions – i.e., exploration and exploitation – in survey research. This paper also proposes and tests an alternative measure of OA which attempts to simultaneously and explicitly include in an overall index both the combined (CD) and the balanced dimension (BD) of OA.
2. Methodological notes
We interpret ambidexterity as the property of being equally skilful with each hand, so that an effective measure of it has to consider both the overall impact of exploration and exploitation effort of firms and the effectiveness in balancing the two dimensions. Following the work by [16], which consider both the overall impact of the exploration and exploitation capabilities, and the capability of balancing them (as the absolute value of their difference), we aim to support a synergistic view of ambidexterity. This is largely true since the global resources available to companies are usually limited/constrained, so the balancing dimensions assume an essential value.
With this purpose in mind, first an in-depth critical review of the related literature and conceptualization of OA is carried out.
We focused on articles published in different academic journals since 1996, when Tushman and O'Reilly [18] published their work that can be considered the first paper to deeply conceptualizeorganizational ambidexterity. We queried different online databases of peer-reviewed journals in the social sciences: the Business Source Premier database, the Wiley Inter-Science database, the Science Direct database and the ISI Web of Science database.
We made use of somewhat different search techniques for each of the three databases, though the underlying selection criteria remained the same, that is, we employed keywords such as “organizational ambidexterity” or “ambidextrous organization” in full text, abstracts, titles or topic. This research yielded more than 550 papers, but only a few are relevant. Criteria for inclusion and exclusion were set, and duplicated studies were eliminated, as well as papers that do not refer directly to managerial or organizational topics.
Furthermore, we decided to limit our sources to empirical works published in IF journals because these can be considered validated knowledge and are likely to have the highest impact in the field. Hence, the total number of articles under analysis was 95. Table A in the appendix reports the scales and measures of the survey-based articles.
The measures are then analysed and compared based on quantitative features such as the characteristic function and contour curve. This is done in order to characterize the growth of the OA score in relation to the exploration and exploitation scores, and to study the discriminating power of the indexes.
Finally, the paper proposes and evaluates a new comprehensive and integrated measure of OA. The new index is tested and compared with the previous ones on the empirical dataset of Italian DILab [17] in order to investigate their characteristics, and explore relations with firm financial performance. Descriptive statistics, linear and quadratic regression analysis are adopted for evaluating the fit of the different models. Data processing was supported by Matlab and SPSS tools.
3. Measures of OA in the literature
OA is an integrative construct of exploration and exploitation tensions, and its measure is therefore based on how these two tensions (each of them expressed by a specific measurement scale) are managed. In the literature, OA measures focus on the firm's effort to increase the combined magnitude of both exploratory and exploitative activities [7, 4], [21, 22], or to match the magnitude of the two types of activities [25]. These two dimensions of ambidexterity are respectively called “combined” (CD) and “balanced” (BD) OA. When facing the problem of how to operationalize the measure for the OA construct, most scholars have adopted one of the two previous approaches[21, 7], or eventually both of them (separately or studying the interactions) [5, 16].
Common BD measures (|exploration - exploitation|) currently take into account only the differences between the exploitation and exploration efforts in order to catch the balancing ability or effort. The choice implies that, assuming evaluating companies in a 5 point Likert scale, organizations getting a low score on both exploration and exploitation (e.g.,: 1; 1) gain the same evaluation of those with a high score in both the dimensions (e.g.,: 4; 4). Whether or not this procedure can be effective in some circumstances, it may cause a bias when the aim of the analysis is to investigate the relationship between OA and firm performance. On the other hand, CD measures (exploration + exploitation or exploration x exploitation) take into account exploitation and exploration separately, and consider their balancing effort only partially and indirectly. The “product” moreover accentuates the score of “best in class” by nonlinear relationships.
Other studies (i.e.,[16]) use both the “combined” view of ambidexterity (based on multiplying exploration and exploitation) with the “balanced” view in an effort to consider more comprehensively both the magnitude and the balance of exploration and exploitation. [16] find that over and above their independent effects, concurrent high levels of BD and CD yield synergistic benefits and that BD is more beneficial to resource-constrained firms, whereas CD is more beneficial to firms having greater access to internal and/or external resources. They suggest that when resources are scarce or insufficient, managing trade-offs between exploration and exploitation demands is essential, whereas in other cases the simultaneous pursuit of exploration and exploitation is both possible and desirable.
A different way is to use the cluster analysis method [23, 24], with the inevitable split of the data set.
All of these measures clearly show a number of strengths and threats, both from a conceptual and operational point of view. However, none of them provide a single index to measure OA. Table A in the appendixreports a detailed review for the OA construct operationalization in termsof tensions, measure and impact on firm performance. Figure 1 classifies the OA measures in Table A accordingly to two dimensions: how they interpret OA (balance or excellence) and what is the outcome of the measurement process (two measures or an OA index).
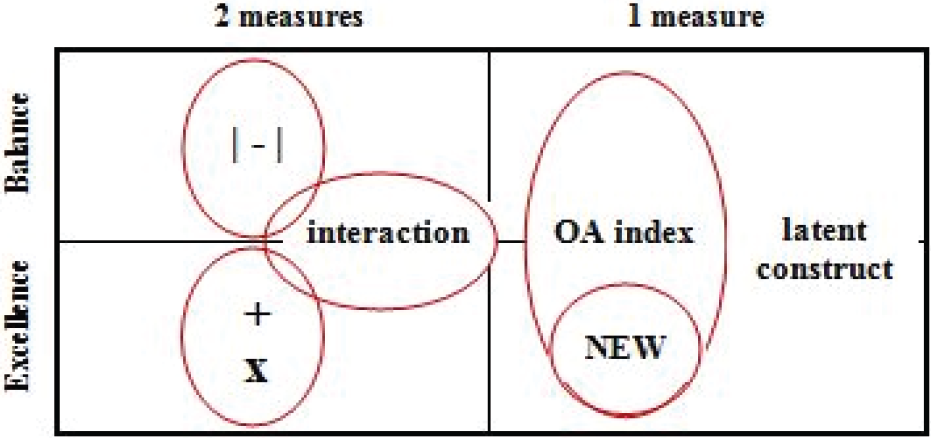
OA measure classification
Here expressions C1, C2 and C3 describe how OA and related dimensions are currently operationalized in literature (where a represents exploration activities; b represents exploitation).

4. An alternative measure for the OA construct
The measure we propose in order to operationalize the OA construct is an integrate measure which synthesizes both the combined and the balance view. In other words, it aims to explicitly combine the two OA dimensions, integrating them into an overall index, both a term which is representative of the combined magnitude of exploration and exploitation activities and another for the balancing effort. This is also in order to avoid undesirable amplification of either dimension.
In operationalizing OA, the proposed index considers the Euclidean distance as an estimator of the overall effort on the exploration and exploitation activities (combined dimension), and the angular distance with regard to the bisector as an estimator of the balance (balanced dimension). Following is the mathematical expression for the measure.

Example 1: Companies F0, F1 and F2 (Fig. 2) are placed on the same circle and have the same distance from the origin (✓(a2 + b2)) which means they show the same overall effort in exploration and exploitation activities. Nevertheless, they cannot gain the same OA score since their ability to balance these activities is different. Due to this, we have considered penalizing the distance from the origin (combined dimension) according to the angular distance from the bisector (respectively α for F2 and α′ for Fl). In expression c1, the angular distance is reported as the value of the tangent to the angle (90- α) i.e., the term

Design of the NEW measure(axis a: exploration; axis b: exploitation)
4.1 Comparative analysis of the measures
The following graphics show some features of the reviewed OA measures: the characteristic functions (Fig. 3) and their counter levels (Fig. 4).
Graphics of the OA measure(a: exploration; b: exploitation)

Contour curves of the measure(a: exploration; b: exploitation)
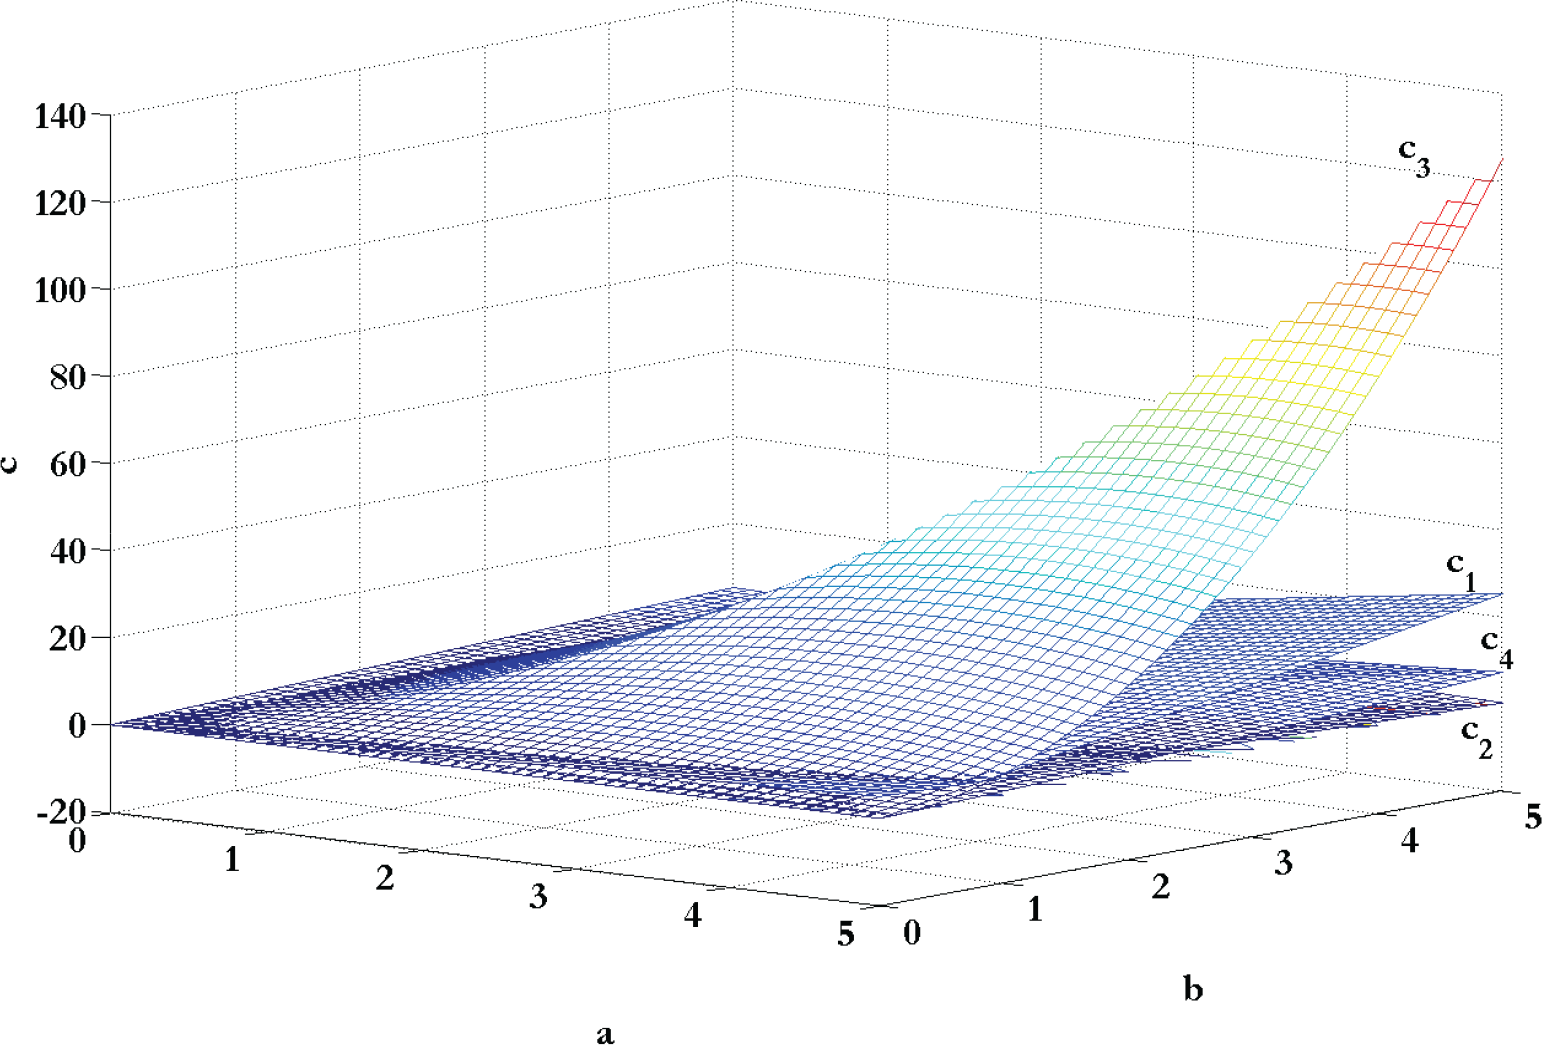
The characteristic functions of the OA measures in Figure 3 show the trend of the OA indexes depending on the exploration (a) and exploitation (b) scores.
The contour curves show where the index assumes the same value depending on the scores gained in exploration (a) and exploitation (b) activities. This is useful in order to understand how the different indexes evaluate the combining and balancing effort toward exploration and exploitation activities. This also gives an indication of how companies are clustered in relation to their scores.
For example, consider a company in Figure 4.c3 with the scores (4.5; 4.5), and suppose the Cao index (c3) assigns an overall score X. This value remains the same, even if one of the scores (a or b) increases (suppose up to 5). That means, in other words, the OA evaluation does not increase if the exploration and exploitation efforts are not balanced. A similar situation occurs for the NEW measure (c4) in Figure 4.c4. Moving to the high-right side of the graphic, the OA index even decreasesif the exploration (a) or the exploitation (b) capabilityscore risefrom 4.5 to 5. However, the two indexes consider the balance dimension in a different way: the first (c3) is neutral to unbalanced behaviours in the high-right zone, while the second penalizes firms in this condition. Differently from the previous cases, the CD index would be increased in both the cases.
5. Test on the empirical sample
In order to investigate the suitability of such measures to catch respectively the BD and CD dimensions of OA, and also to explore relations with firm financial performance, we tested the behaviour of the four indexes on the empirical dataset of Italian DILAB. Here some information about the sample, the data collection process and the operationalization of constructs are provided.
5.1 Sample and data collection
The target sample frame consisted of medium-sized and large Italian firms in the medium and high tech industries selected according to the international OECD science classification. The sample frame thus included companies with more than 50 employees and covering aerospace, computers, office machinery, electronics-communications, pharmaceuticals, scientific instruments, motor vehicles, electrical machinery, chemicals, other transport equipment andnon-electrical machinery sectors. Five-hundred firms were randomly extracted and contacted from the AIDA dataset. The Aida dataset is the main database of financial annual report information about companies and it covers the entire population of medium-sized and large enterprises in the country.
The data collection process spanned May 2009 to February 2010 and was supported by the use of Survey Monkey® web utilities. Respondents were vice presidents or directors of R&D departments, or CEOs. Of the 500 surveys mailed in Italy, 112 responses were received (response rate of 22.4%); 25 responses were discarded due to incomplete information, resulting in an effective response rate of 17.4%.
5.2 Construct operationalization
As for construct operationalization, we used multi-item scales (except for financial performance) which are well consolidated in the literature for all the variables (Tables 2a). Scores for the scale were mainly calculated as the mean value of the items (further details about the computation procedure will be given). We also assessed the reliability test of all the groups of items pertaining to our constructs through Confirmatory Factor Analysis (CFA) and Cronbach's alpha test. Factor analysis was conducted using principal component extraction with Varimaxrotation.
OA construct

While recognizing that firm performance is a multidimensional concept, we focused only on the logarithmic growth rate of sales revenues between 2006 and 2009 for several reasons. First, unlike profitability measures like ROA, etc., sales growth does not suffer from accounting measurement problems. Second, sustained sales growth has been found to be a reliable proxy indicator of other dimensions of superior firm performance, including long-term profitability and survival. Moreover, the time horizon that we observe considers sales growth over five years, thus considering performance trends over the medium-term. Due to these reasons, sales growth is the most common objective performance measure used in previous studies on ambidexterity. To control for industry effects, the logarithmic growth rate of firms' sales growth rate was compared to the same ratio for aggregate revenues calculated at the industry level (considering industry at the third digit of NACE codes). This adjusted measure of revenue growth exhibits a further advantage as it also controls indirectly for economic cycles and for other macroeconomic factors such as industry concentration. This advantage is particularly important considering that the economic recession that started in 2008 has affected the period where we estimate the impact of ambidexterity on performance.
Turbulence construct

5.3 Descriptive statistics
Herein we report the distribution of observations in the sample. Figure 5 shows firms' position in relation to their scores in exploration and exploitation.

Observations from the sample(standardized measures)
Moreover in Table2 we report correlations between CD, BD, interaction Cao [16], and the NEW measure. The findings highlight a very high correlation between CD, interaction Cao [16] and the NEW measure which is obviously explained by the overall dependence from the exploration and exploitation scores. In particular, the interaction Cao [16] terms and the NEW index proposed correlate at 0.967.
Correlations among the measures

significant at the 0.05 level
significant at the 0.01
significant at the 0.001 level
5.4 Linear Regression test
We tested the behaviour of the four measures when used as antecedents in linear regression models. Here follow the model summaries (Table3): the dependent variable is Sales Growth corrected for the trends in the sector while, as independent variables, we used the different measures of OA. We also controlled for other variables: Firm Age (log), Turnover (2005), Turbulence, R&D Spending (log) and Firm Size (log).
Test of measures
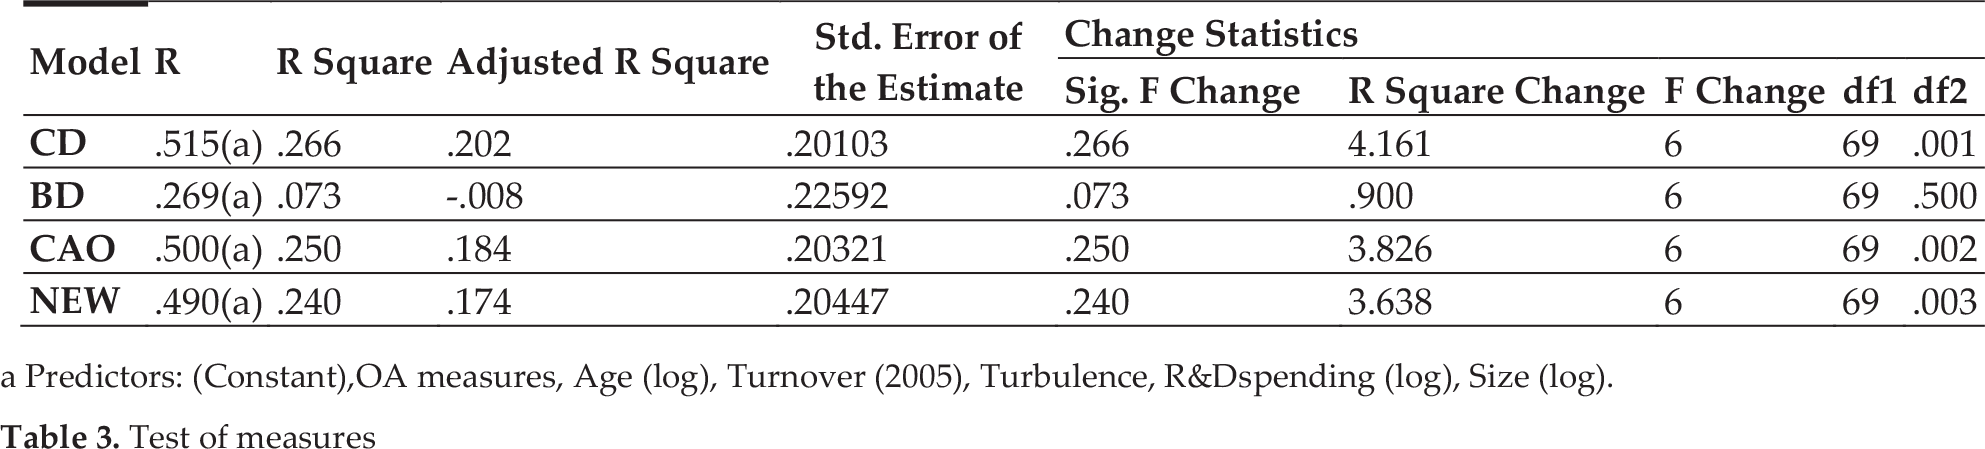
Predictors: (Constant), OA measures, Age (log), Turnover (2005), Turbulence, R&Dspending (log), Size (log).
Tables 3 and 4 show R square, standardized and unstandardized values, and the other statistics of the regression model. The findings report that the BD model is not significant, while the other measures present a good R square and very similar regression weights.
Linear regression models

significant at the 0.1 level
significant at the 0.05 level
significant at the 0.01
significant at the 0.001 level
5.5 Fit of the measures in linear and quadratic models
In order to understand the suitability of the four OA indexes when these are adopted, as usual, in linear or other kinds of regression models, we investigated their behaviour and related model fit indexes for the linear and quadratic case. The dependent variable is, as previously stated, Sales Growth corrected for the sector trends while, as independent variables, we used respectively: CD, BD, interaction Cao [16] and the NEW measure.
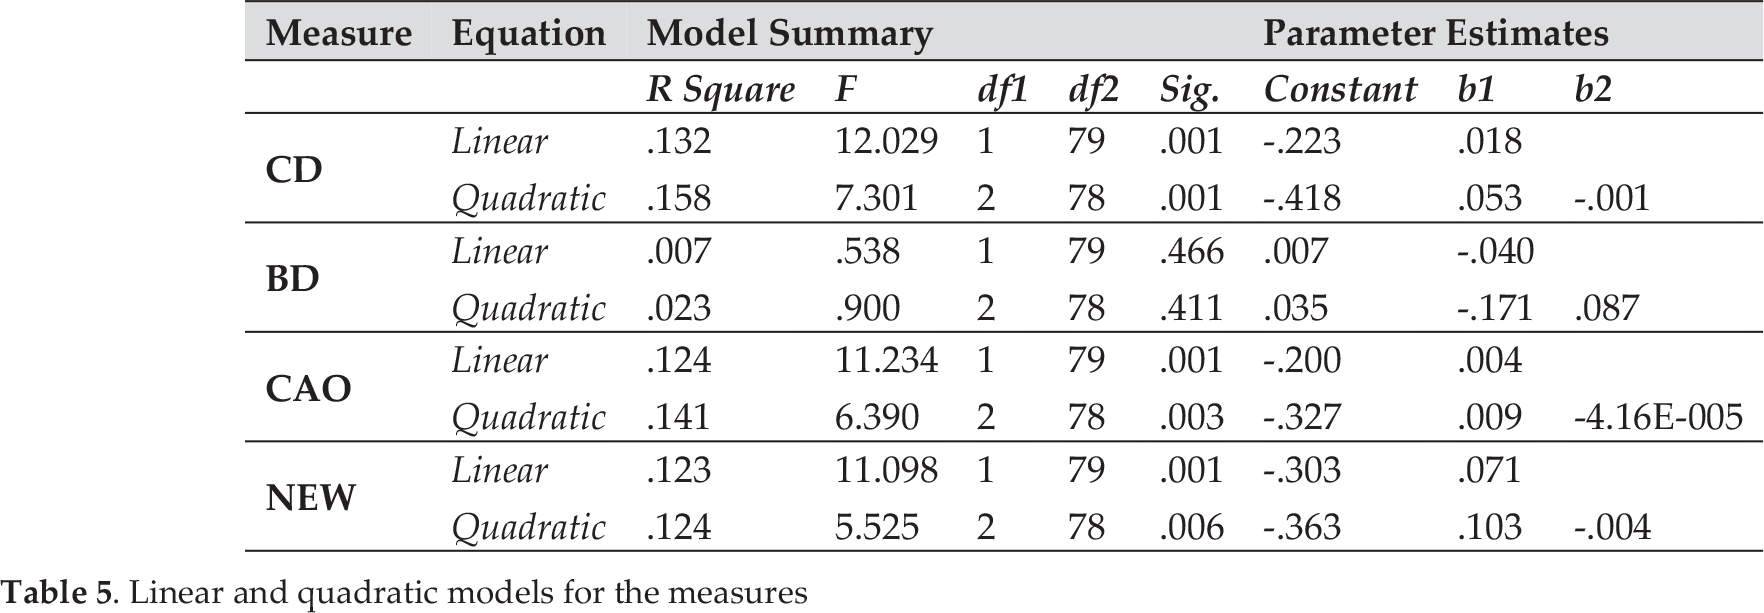
The results are reported in Table5 and Figure 6. Again, the BD model presents non-significant values, while all the other cases show similar estimates. Figure 6, moreover, shows the trend of the linear and quadratic fitted functions. In spite of the NEW measure, when the CD and Cao index are used, the reverse U-shaped is more evident (quadratic models also present a higher R square).
Linear and quadratic models for the measures
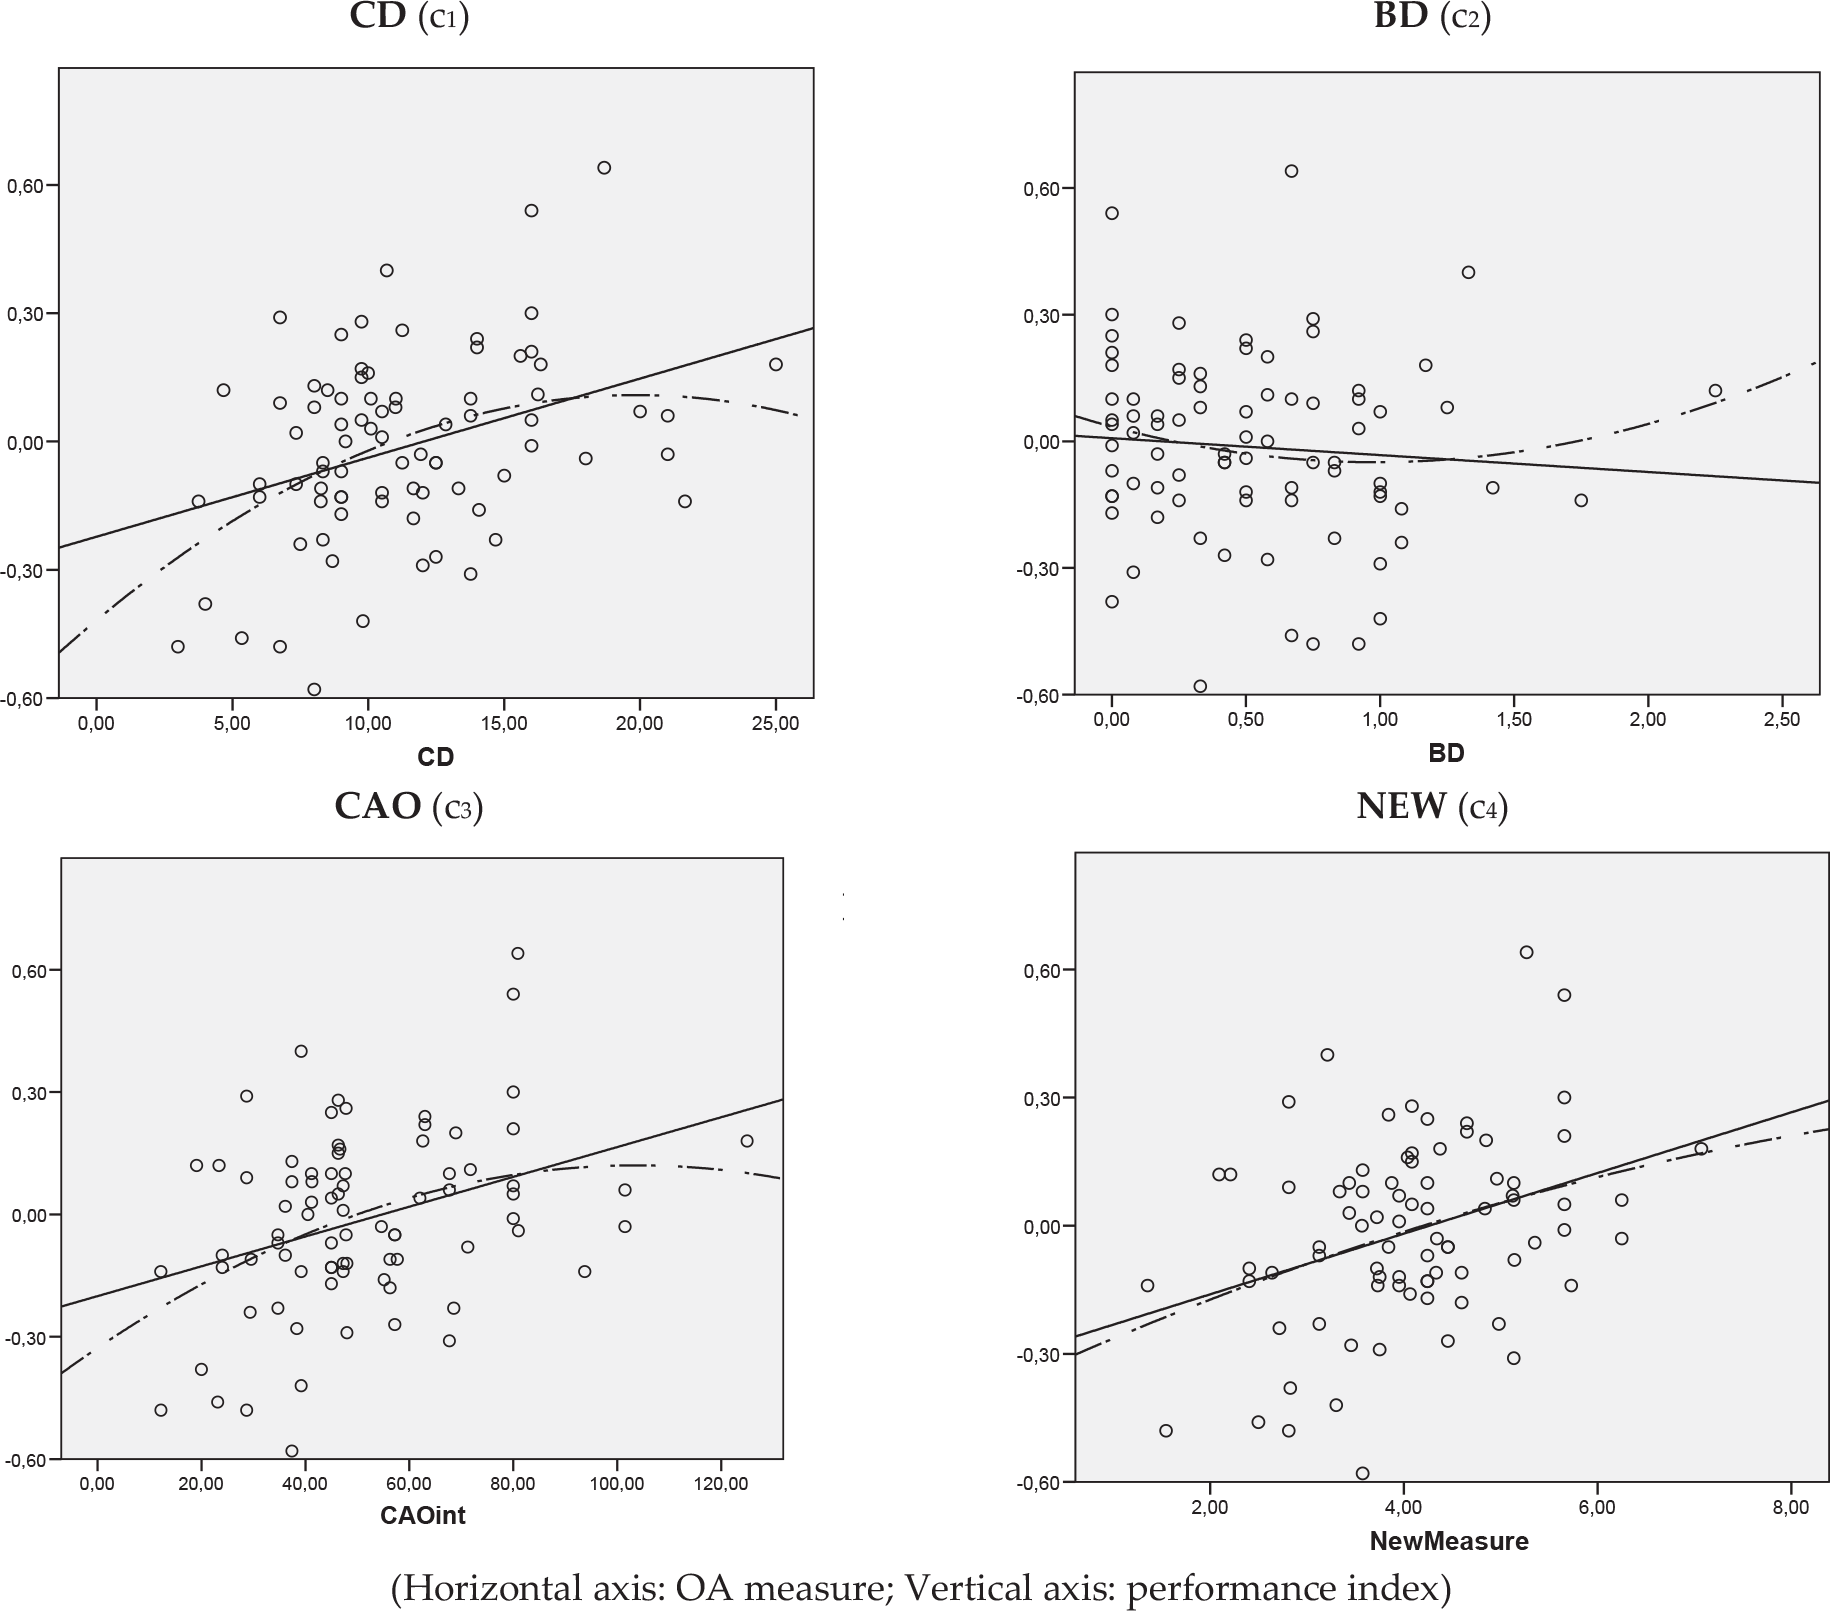
Plot of the linear and quadratic functions
6. Discussion
In the following paragraphs, moving from the evidence found in the literature review, the quali- quantitative analysis of the indexes and the tests on the empirical dataset, we report a critical analysis and some considerations about each of the measures we have evaluated.
6.1 BD measure
The balance dimension of OA is the older conceptualization of the OA construct in the literature. Whether the attempt to isolate the contribution of balancing exploration and exploitation is desirable and useful in order to investigate when and how the trade-off between these activities should/could be managed, some practical limitations occur.
Looking at the contour curves (Fig. 4), in fact, it is evident that the index assign scores according to the expression |a-b|, so that it clusters in the same group companies with a low score, e.g., (0;0) and top in class, e.g., (5;5). It is definite that this condition limits the use of such an index as antecedent to regression analysis where the output (dependent variable) is set to be rather a performance measurement. Past studies available in the literature, as do our tests on the empirical data, do not find a significant relationship between BD and firm performance [5]. Moreover, when this happens, as for example in [16], the relation becomes insignificant if other dimension (CD, interaction Cao) are added and considered into the model. Rather, the BD term seems to assume relevance as a moderator influencing CD. This is supported by evidence from [16] and also by the empirical analysis.
6.2 CD measure
The combined dimension is a very common operationalization of OA in the literature. It is usually adopted with the aim to catch the overall magnitude of the exploitation and exploration activities, and often interpreted as opposite to BD. However, we have to observe that CD also somewhat includes a dependence from the BD term.
This evidence is partially supported by the correlation between BD and CD (0.25) which shows that a common variance exists between the two measures. Moreover, the CD index is also correlated with the Cao interaction and the NEW measure (0.90). This is relevant since they explicitly include in their score the balance dimension. Other evidence is shown by the analysis of the contour curves (Fig. 4).
With regard to the empirical analysis on the DILAB data sample, CD appears as the most effective index in terms of data fit (R^2), both for the linear and quadratic model. This result, however, may be due to the specific distribution of firms in the data sample.
6.3 Cao [16] interaction measure
Concerning the Cao OA measure, a premise is needed: whereas it is interesting and valuable to be considered and analysed as a potential index which operationalizes OA, we also have to notice that [16] introduces the measure as an interaction term between the BD and CD dimensions of OA. They, in fact, recognize explicitly in BD and CD two principal and different dimensions of OA, and assign to their interaction a synergic effect on firm performance. As such, we consider the Cao interaction measure worth investigating in this work since, for the first time, the relevance of a synergic relation between the global effort on the exploration and exploitation activities, and their balance, is considered and emphasized. Notwithstanding, it does not conceptualize any innovative measure about OA, but further explores the relationship between the existent dimensions.
As a measure of interaction, the index adopted by [16] introduces a nonlinear pattern in the evaluation of the OA score which may affect the subsequent analysis (Fig. 4 and 6). Moreover, since the CD term already includes some indication about the balancing effect between the exploration and exploitation activities, the overall OA index may be biased by a latent amplification of the BD term.
Considering the contour curve (Fig. 4), we can observe that the higher the scores in exploitation and exploration activities, the higher the weight of the BD term in the final index. The contour curves are in fact sharper than for CD and penalize firms that are strongly far from the bisector.
Finally, with regard to the fit indexes observed in the empirical test for the linear and quadratic formulations, the Cao interaction measure shows the second higher R^2 in both the models. As also for CD index, the quadratic model seems to provide a better fit with the data.
6.4 NEW measure
Finally, the NEW measure we proposed is an attempt to explicitly integrate the BD and CD dimensions in an overall measure of OA which can maintain a linear fashion and does not cause any further amplification of any term. This is the first time a similar measure has been developed and applied to the OA construct.
With regard to the analysis of the characteristic and contour curves, the index does not introduce any second order factor. Moreover, it assigns a higher premium prize to the balanced firms in the “high exploration-high exploitation” zone.
In order to summarize the pros and cons of the measure we notice, first of all, that it has a very high correlation with the Cao interaction index, meaning they are very similar in their ability to explain the variance of measures. At the same time we also observe that this phenomenonmay be emphasized by the specific distribution of companies in the sample (most of the firms present a high balance between exploitation and exploration). This can limit our ability to catch the variance of the BD dimension with respect to the performance index and to consider the impact of this component on the measure.
On the other hand (pros), the NEW measure gains a linear fashion and the explicit integration of BD and CD terms in the OA index. It is also valuable to consider that the test of the linear and quadratic models show very similar R^2 values in both cases. In particular, the difference between the two models is under .01. This may represent an advantage in respect to the other measures when it is used as an antecedent in linear regression models.
7. Conclusion
The contributions of this paper are twofold. From a theoretical/conceptual perspective, this work encourages the debate on the suitability of current measures of ambidexterity: how well the operationalization fits with the concept of OA and the related CD and BD sub-dimensions; how well current measures respond to the need for discriminating ambidextrous from not ambidextrous companies in order to investigate the relationship with firm performance. From this perspective, the work presents a critical review of the most common measure of OA, as operationalized in literature. It reports the conceptualization according to the different approaches and reviews the related measures adopted by the authors. Finally, it analyses and compares these measures.
Moreover, the paper suggests a new operationalization of the OA measure which aims to explicitly integrate the BD and CD terms into an overall OA index. The index seems to have a higher discriminating power for linear models, allowing a more accurate placement of firms according to their ambidextrous capabilities.
In addition, this work tests the reviewed indexes and the new measure on data by a survey on Italian firms. Briefly, the CD measure gets the higher R^2, both in linear and quadratic models, the second measure in terms of R^2 is the Cao interaction. The NEW measure has a very similar R^2 to the Cao index, but differently it shows very similar R^2 value between the linear and quadratic model. This may be an advantageous condition when linear models are adopted and tested.
Nevertheless, the work suffers from limitations that may simultaneously raise some concerns and suggestions for future refinement and deployment. Firstly, the paper does not deal with any issuesrelating to the scale item generation and validation for OA, but rather the operationalization choice about an OA index from an existent measurement scale. Consequently, the work inherits from that a number of strengths and weaknesses. Then, due the limited sample size and other specific features of the collected data (i.e., skewness of the firm scores) some generalization problems occur. Further analyses and tests are needed on different data samples, or on extended versions of the current dataset, in order to provide new evidence and more representative cases in order to explore different firm OA configurations. Finally, as for the NEW index we have suggested, whether it is different in its conceptual interpretation and seems superior for use in linear models, it presents very similar statistical and explicative proprieties to the Cao interaction term [16]. Deeper testing and further evidence are needed in order to prove the effects of the operationalization on the pattern between firm OA and firm performance.
Footnotes
9. Appendix
Table A reports a review for the OA construct operationalization in term of tensions, measure, and impact on firm performance. OA main measures are obtained in different ways: “x” = multiplying; “| - |” = subtracting; “+” = adding the X1 and X2 scales

| TENSIONS | |||||
|---|---|---|---|---|---|
| X1 | X2 | OA MEASURE | OTHER MEASURES | F |
|
| [7] | 1. The management systems in this organization work coherently to support the overall objectives of this organization 2. The management systems in this organization cause us to waste resources on unproductive activities 3. People in this organization often and up working at cross-purposes because our management systems give them conflicting objectives. |
1. The management systems in this organization encourage people to challenge outmoded traditions/practices/sacred cows 2. The management systems in this organization are flexible enough to allow us to respond quickly to changes in our markets 3. The management systems in this organization evolve rapidly in response to shifts in our business priorities. |
x | YES | |
| [5] | x |-| | Median cut-off | YES (x) NO(| - |) | ||
| [6] | x | The interaction between competence exploitation and exploration is related to radical innovation performance | |||
| [25] | + 1 index | YES | |||
| [4] | x | YES context | |||
| [21] | x | YES context | |||
| [29] | They introduce a measurement scheme of exploitation and exploration routines as a derived metric based on a firm's participation in product markets with differing degree of similarities and differences. The variables are time-varying outcome measures reflecting realized exploration and exploitation; they are based on product launches across distinct within industry product markets over time. | x | NO | ||
| [22] | x | Contrary to their expectations, ambidexterity does not have a negative effect on firm performance for either prospectors or defenders; that is, they do not find an asymmetric negative effect of ambidexterity on firm performance for either strategy type. | |||
| [8] | x | YES | |||
| [30] |
|
|
— | ||
| [16] | x |-| interaction | YES | |||
| [31] | + | — | |||
| [32] | + | — | |||
| [33] | Using a scale of 1–7, whereby 1 represents “not at all” and 7 represents “very much so,” rate your firm on each of the following questions: |
Assess at a high level the degree of efficiency and the degree of innovation | YES | ||
| [9] | x | YES | |||
| [34] | + | YES | |||
| [35, 36] | |-| | YES | |||
| [23] | Concepts associated with exploration and exploitation are classified into six practical dimensions: organizational knowledge practices, innovative practices, competition, strategic orientation, organizational efficiency and partnerships | Cluster | — | ||
| [17] |
|
|
x | YES | |
| [37] |
|
|
Higher-order latent construct | SEM | YES |
| [38] | x |-| | YES | |||
| [39] |
|
|
x |-| | Median cut-off | YES |
| [40] |
|
|
x |-| | YES | |