
Abstract
This paper presents a new method for tracking moving objects that have colour variations due to illumination, which uses a maximum colour distance on the mean shift framework. Conventional colour-based mean shift methods show good results when tracking non-rigid moving objects. However, they do not provide accurate results when the initial colour distribution of the object disappears. Our method uses the maximum colour distance to represent the objects. If a colour distance can be defined as the geometric distance between two colour points in a colour space, then the maximum colour distance is defined as the maximum value among all of the colour distances. The physical illumination model, under assumptions, guarantees that the maximum colour distance is independent of ambient lighting and other illumination with an identical solid angle. The objective of our method is to provide robust real-time object tracking with large colour variation in objects whose colour changes due to external illumination. The implementation of this new algorithm shows effective tracking results with a complete object colour change over time. The validation of our approach is illustrated by the comparison of experimental results obtained using the methods described above.
1. Introduction
The subject of real-time object tracking can be described as a correspondence problem that involves the location of an object from frame to frame in a video image sequence. Normally, the time interval between two successive frames is small and constant. Therefore, the inter-frame changes are limited and the correspondence can be created based on features extracted from the image frames. However, object feature extraction can be very sensitive to variations in illumination, viewpoint, the scale occlusion of the object and the complexity of its background. The appearance of the object can change due to inconstant working conditions. To keep track of an object when its features change, the most important issue is to enhance and update the object's feature information with regard to the noisy and dynamic background.
A template approach was developed to prevent the “drifting” problem by using a heuristic algorithm [1]. This method was also extended to convert a generic Active Appearance Model to a specific model. Bayesian bootstrap and particle filters were developed to ensure the robust tracking of objects with occlusion, rotation and scale variation [2], [3]. The robustness was obtained by updating the weighted average between the object's current and new histogram. An advanced tracking system was constructed based on a Gaussian Mixture Model (GMM); this model requires a fixed number of Gaussian components, including a stable component [4]. GMMs based on histogram information using Expectation Maximization (EM) algorithms work well in situations where the observation data is incomplete [5]. They start with an initial estimate and iteratively update this estimation to increase the likelihood of the observed data and then find the expected value of the complete-data log-likelihood with respect to the unknown data, given the observed data and the current parameter estimates. If we wish to use the EM algorithm, we need to ensure the number of components in the GMM and avoid adapting extra modes in the underlying density function or frequent mode switching.
Most object tracking systems require robustness in relation to arbitrary noise and a tolerance of large variations in the observation data. We can ensure the requirements of the target through prior knowledge and proper processing. However, tracking an object in dynamic and complex circumstances is especially difficult. For example, in colour-based object tracking, the object's features are represented through colour distributions. The object's feature appearance can change with time due to a lack of colour constancy capabilities. Furthermore, the object's features can disappear when its colour is changed completely. Therefore, colour-based algorithms with a colour constancy assumption have been suggested, but their performance has been inadequate thus far.
Two dominant reasons can explain the occurrence of variations in colour: one is motion – i.e., from the front of the face, with its skin colour, to the back of the head, with its hair colour. The other is illumination changes – i.e., from a red light to a blue light.
The mean shift is a nonparametric algorithm that shifts each sample to the model to which it statistically belongs [6]. It can be generated like clustering algorithms [7] and was originally developed for data clustering, later being extended to delineate arbitrarily shaped clusters for face tracking [8]. Colour-based mean shift algorithms have also been used to track human motion. Mean shift analysis was used to derive the target candidate that had the most similarities to a given target model and thus was used to track objects with changing scale. It was modified to deal with dynamically changing colour distribution and to find the mode of colour distribution within a video scene [9–12]. An updated mean shift-based model technique was used to improve a robust and speedy human tracking system [13]. A colour-based mean shift tracker and the sum of square differences were used in the Kalman filter framework to track far-reaching objects ranging from surveillance to smart rooms [14]. Mean shift clustering was used to detect moving shadows and to recover significant image features [15,16].
Examples of the tracking of an object where the colour changes radically were shown in some colour-based mean shift object tracking algorithms [8,9]. However, cases with complete colour change have not yet been explored and examples where the initial colour changed completely were excluded. A modified mean shift algorithm is proposed for tracking an object with radical and complete colour change by the iterative updating of the reference while the colour variation exceeds a threshold value [17]. Variations in colour by motion are solved, but the variations due to illumination changes remain.
We propose another approach for cases of colour variation due to illumination changes, based on the maximum colour distance (MCD). The proposed maximum colour distance provides invariance for illumination changes. The colour distance can be calculated by subtracting all of the colour components at two arbitrary colour points. We use a reflectance model based on physical theory to demonstrate that the colour distance is constant for ambient coloured lights [18]. We improve the computation efficiency by employing a maximum value for the colour distances for each region on an image. In this paper, we use a modified mean shift algorithm with MCD to track an object in order to ensure the robustness of the tracking with respect to colour variation due to illumination changes.
2. Related Work
A mean shift algorithm is a simple iterative procedure that shifts each data point to the average of data points in its neighbourhood; it is a general algorithm that may be used for data clustering, analysis and computer vision [7]. The basic idea underlying the mean shift algorithm is to reach the nearest maximum density peak from the gradient of a probability distribution. The search is based on the kernel density estimation that converges by moving iteratively from the current location to the location with the highest density. In other words, a mean shift tracking algorithm based on colour is a real-time algorithm that seeks to maximize the correlation between two statistical distributions – i.e., to represent the similarity between the two distributions. Statistical distributions can be built using the characteristics of a tracked object discriminated from its surrounding environment.
The mean shift algorithm has several advantages: it does not require a priori assumptions for global density because it only uses gradients from neighbour distributions, while iterative processing makes it simple. In addition, when mean shift is applied to object tracking, a mean shift that exploits only colour information without any shape features is very useful for tracking a non-rigid object. Mean shift also has good performance when tracking rigid objects with constant colours. However, mean shift cannot solve the traditional local minimum problem as completely as almost every other clustering algorithm is able to do. Moreover, mean shift cannot track the algorithm's target correctly when the target's colour changes.
Various approaches have been proposed to resolve the problem that arises due to illumination. Shiguan et al. [19] represented normalized front faces using Quotient Illumination Relighting (QIR). However, this method only works under predefined, normal lighting conditions. For application to colour images, this grey image-based method must be modified. Zhu et al. [20] suggested a robust method for tracking external lighting that employed the inverse compositional algorithm and the normalized gradient. This approach is advantageous in that it accurately indicates the target's location, its rotation angle and scale, while it poses variation via inverse matrix calculation. However, this algorithm encounters problems in tracking objects when the variation in scale or the form of objects is out of the calculation range. Especially for non-rigid objects, this approach has a high probability of providing incorrect results. Whoang et al. [17] presented a novel approach based on the conventional mean shift algorithm that used iterative updating. Although this method could also be applied for colour variations arising for many reasons, they could not guarantee its performance because their experimental results showed colour variation due only to motion.
Another approach for tracking objects based on templates was suggested by Zhu et al. [21], who conducted tracking procedures using only the edges of target objects. This method is also invariant to a variety of light changes. However, it is difficult to apply to a deformable target. Comaniciu et al. [12] proposed the use of the mean shift using a colour information technique which is able to provide accurate responses for deformable objects. The mean shift has no definitions for the shapes or forms of a target. The tracking system using the mean shift uses a matching probability density function for colour. However, the mean shift method is still sensitive to colour variation due to illumination.
3. The Proposed Algorithm
In this section, we describe a new approach that is adequate for tracking an object that undergoes colour variations due to illumination changes. This method is based on the ‘maximum colour distance.’ The ‘colour distance,’ as defined within this paper, indicates the geometric distance between two colour points in a colour space (i.e., RGB, HIS and CIE). Consequently, the ‘maximum colour distance’ is the maximum value among all of the colour distances that can be calculated with all pairs of its colour points. All assumptions are satisfactory for working on more general tracking situations with a small neighbourhood range for the maximum colour distance and a sufficient distance between an object and the camera.
3.1 Maximum Colour Distance
We chose the colour distance as one of the features to be used in object tracking. Colour variation due to varied illumination is one of many issues faced by object tracking research. The colour information of an object has been used in tracking mainly for deformable targets, such as humans and animals. However, this useful data is easily transformed into another colour by external colour illuminants in many cases. Therefore, we propose a new approach that is insensitive to colour change due to varying illumination and which maintains the colour data for a specific target.
Suppose that P and Q are two points on a surface S of an object in the real world. The colour distance D between the two points is given by:

where d is a distance metric that is dependent upon the colour space. For example, if all of the points of S are represented on the RGB colour space and the Euclidean metric is used to measure a colour distance for P and Q, then the colour distance equation will be represented by:
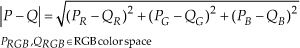
In this paper, all colour distances are calculated in the RGB colour space and the Euclidean measure is used as a distance measure function, denoted as d in (1). The RGB colour space is one of the common colour spaces that are used widely in computer vision. The RGB colour space can be described as a cube in geometric representation. In this case, colour distance can be calculated clearly by Euclidean measurement compared with other colour spaces. Therefore, the RGB colour space and the Euclidean measure are selected as a colour space and a distance measure function in (1).
Consider a light source L in a 3-D space and assume that two points P and Q on a smooth surface S are observed in an image plane. Denote a region U including two points P and Q on S and Wu as the projected pixels p and q on an image plane I. Fig. 1 shows these assumptions. The colour values of each point p and q on the image plane I depend upon the amount of incoming light from the source L that is reflected by the surface S with material E and the surface normal N. These colour values are represented by the Bidirectional Reflectance Distribution Function (BRDF). A variety of analytical models have been proposed to represent BRDFs in computer graphics. This work is based on the ‘Cook-Torrance model,’ well known as one of the best BRDF models established on the physically-based analytic reflectance model [18]. The equation of the Cook-Torrance model for BRDF is represented by:

Colour image formation process under illumination changes. The colour values at p and q on the image plane depend upon the light L distribution, the observer position, the surface normal N at P and Q and the surface material E of S.
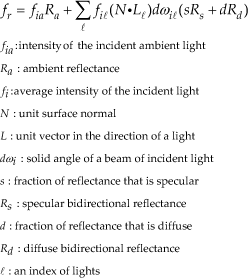
This model does not consider the reflection of light from other objects in the environment. This reflectance model depends upon material and surface roughness. In this work, we assume that the surface material S in Fig.1 shows an isotropic distribution and that S is perfectly smooth. Equation (2) for the colour distance between two points on a surface can be rearranged with the above BRDF as follows:

Suppose that all of the light sources L are sufficiently distant from the surface S, then all of the incident light rays could be parallel. This assumption means that all variables of the L in (3) can be approximated with constants. Similarly, if the observer is far enough away from the surface S, a viewing angle for two points on the surface can be achieved – with a constant. Finally, we assume that normal vectors to S in a neighbourhood U around P and Q in Fig.1 do not change, i.e., U is a plane.
Under all of the above assumptions, the surface can be considered as the Lambertian surface and the above BRDF can be simplified as:

where k is a constant that depends upon the angle between the incident light direction and the surface normal. If two points P and Q on the surface S are closely located and share an equal normal vector to S, then both of the BRDFs fr,P and fr,Q for P and Q are equal. Thus, all of the constants for a BRDF are eliminated when the colour distance is calculated and, thus, (4) can be rewritten as:

where F is a function for a surface normal and lights. Therefore, the colour distance between two points P and Q on S is independent of colour variation by illumination changes until the total of the input lights has a significant variation because N and L for P and Q are identical according to the above assumptions.
On the other hand, when a point on a surface is projected to a pixel on an image plane I, a more appropriate model is needed due to the external noise (colour readjustment by the camera of the automatic operation or else reflections coming from neighbouring objects).

In (7), δp is a constant to represent noise. Consequently, a colour distance for two points P and Q on a surface in an image is calculated by:

where δ is the total noise. If the noise is close to zero, the difference in colour between two pixels in the image indicates a colour distance for two points P and Q on the surface. This estimated value in an image also has identical properties to those of the colour distance defined for two points on a smooth surface.
Colour distance has two advantages when compared with conventional colour data (i.e., RGB). First, if all of the above conditions are satisfied, then the colour distance is invariant for any colour variation imposed by illumination changes. In particular, in the case of ambient illumination changes, the colour distance is completely independent of them, in theory, because the subtraction between two points removes the term of ambient illumination in (6). This invariance property provides more robust data for colour processing without considering illumination.
Second, colour distance provides more appropriate information when compared with simple grey data when a region with a specific colour distribution should be discriminated from others under various illumination environments. Thus, the proposed method based on colour distance is superior to the other algorithms that use grey images or edges. A few of the proposed approaches exploit colour distances as one of the features of object tracking.
As shown in Fig.2, we verified the invariance property for illumination changes by experimenting on an artificial object. The plain surface of the object has 512 different coloured hexagonal patches. All of the patches are located at random. The illumination in this experiment is a white directional light. The maximum luminance is about 3800, as measured by TSL251R. ‘Degree 0’ means that the incidence angle is 0 degrees while ‘Degree 45’ and ‘Degree 90’ indicate 45 and 90 degrees, respectively. The ‘Degree 0’ image has different luminances for the left and right areas because the incidence angle is 0. In the ‘Degree 45’ image, the difference of the luminance decreases with increases in the incidence angle. The ‘Degree 90’ image has an equal luminance over the entire patch. For accurate results, the automatic exposure and white balance of the camera are turned off. To prevent indirect light, all of the lights except for the experimental light are also turned off. The experiment is performed with a fixed object and a stationary camera.

The PDF of colour distance by incidence angles of illumination.
As the PDF plot of colour distance shows, we verified that colour distance is robust for colour variation by illumination angle. ‘Degree 0’ shows a slightly higher probability density than the others at the peak point. Because the ‘Degree 0’ image was obtained under lower luminance, camera noise occurs and this influences the colour distance measurement.
3.2 Various Measurements for Colour Distance
Colour distance supports invariance for colour changes and colour discrimination. Meanwhile, several problems still linger concerning the use of colour distance for object tracking. One of these problems involves determining the distance that best represents the proper set of colour distances. The best colour distance of a distance set is a value that satisfies (8). However, determining the best distance is almost impossible because of internal or external noise and the complexity of precisely measuring the illuminated environment. Alternatively, we can select two pixels within Wu in Fig.1 that minimize δ in (8), although this is also very difficult for the same reasons.
The colour distance of two arbitrary points in the point set Wu is then used for tracking. If a point set has n elements to be satisfied for (8), then the set can produce n(n-1)/2 colour distances, while all of these values could be used to perform object tracking. For this case, the computation time will be exponentially increased by n. Therefore, we need to select a single colour distance in order to improve the calculation efficiency as the most important value within these distances under illumination change.
Normally, several measurement functions can be used to represent a group property as a single data point; for example, the maximum, minimum, mean and medium. This paper determines a single value by experimenting with all four functions. The methods are then evaluated to determine which is the most significant for rapid illumination variation.
Denote by U the set whereby the elements of U are defined as:

The set W yields the set U of colour distances using the distance metric d as follows:

The four functions for two different points p and q in a digital image I are defined as:

We evaluate each of the four functions, as described in (11), and then choose the one that produces the minimum difference in the colour distance histogram under illumination change. The next experiment demonstrates the colour distance histograms corresponding to the four functions in order to determine an appropriate function for colour distance under various lighting environments.
Throughout this experiment, four functions are available from which we can determine the best function for rapid lighting variation. This experiment will proceed for a test image as follows:
Calculate the colour distances of each function (i.e., the maximum, minimum, mean and median). Build histograms of the obtained colour distances for each function. Estimate the difference from the reference histogram. Return to Step 1 for all the test images. Compare the difference rates of all the histograms for each function. Select the function that shows the minimum difference over the entire image.
The test image set for this experiment is part of the facial database of Carnegie Mellon University [22], which has colour images of 68 people in various poses for identical given subject under two different illumination conditions, with ambient lights on and off. The movement of another illuminant device around the subject generates images under various lighting environments. Each condition included five poses: front, angles of approximately 15, 45 and 60 degrees, and the side. Each pose has either 21 or 23 images with slightly different illumination conditions for each frame due to the translation of lighting. In order to evaluate the four functions, the backgrounds relative to the tracking target facial image are subtracted due to accurate estimation for the robustness of the colour distance.
Fig.3 shows examples of one person from the test images of the 68 people. The images in the top five rows of Fig.3 were collected when the ambient lights were turned off while the other images were collected when the ambient lights were turned on. The images in these rows have identical poses but variable illumination conditions. Rows one through five each show the face turned at 15, 45 and 60 degree angles, from the front and from the side when the lights are off, while rows six through ten each show the same facial presentations when the ambient lights are on.

Face image samples of the CMU face database that were used for the experiments with various distance measures.
This experiment provides four histograms of colour distance corresponding to the four distance functions for all of the images. Thus, each image has histograms of the maximum, minimum, mean and median functions. We assumed that the variance of one bin in the histogram has a normal distribution. All of the histograms were converted to the probability density function using a normal kernel. We chose the RGB colour space to allow us to clearly determine the performance of each function because the RGB space is sensitive to changes in illumination. The colour distance was measured using the Euclidean distance as the distance metric d in (1). The robustness evaluation for the four functions was performed via the following equation:
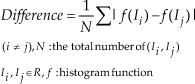
where R indicates an image set that is categorized by pose and illumination conditions.
Fig.4 shows the average differences of 68 people among all of the histograms for the four methods, as categorized by group, pose and illumination conditions. The differences for each group were calculated using (12). The horizontal axis of Fig.4 indicates the name of each image group. ‘OFF’ is used as a name prefix, which implies that the image sets were generated when the lights were off, and ‘ON’ was used when the lights were on. The number attached to the prefix name indicates the approximate degree of the pose. ‘0’ represents a front facial image and ‘90’ is a side view of the subject's face. The vertical axis shows the difference in the colour distance histograms for each image set. A more robust function (meaning that it shows less of a difference) has a lower value. On the other hand, a function sensitive to illumination change will have a higher value compared to those of the less sensitive functions. As shown in Fig.4, the ‘max’ function shows little difference between all of the groups. Although the ‘mean’ and the ‘median’ see a slight variation, they show a slightly greater difference than do ‘max’ and ‘min,’ with the largest variation over all of the groups. The colour distance with ‘min’ tends to have a higher difference than do the others where the lights are off. The best distance function for the illumination change throughout this experiment can be inferred as ‘max,’ although it could be replaced with another function depending upon the fields or the environment.
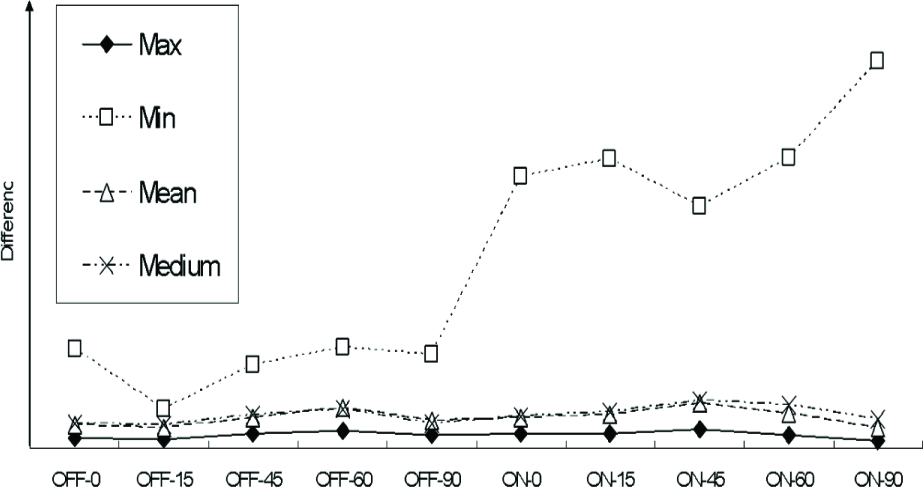
Histogram difference of colour distance for various distance measures.
This experiment verifies that the ‘max’ colour distance is robust when considering illumination changes. All of the subsequent colour distances were generated using the maximum colour distance.
3.3 Maximum Colour Distance Variance by Range
Although the maximum colour distance was selected for tracking in the previous section, we have to consider a range of WU defined in (9). In practice, we do not know which point satisfies the conditions for being an element for a set W.
Denote by l a range of a point set W. Accurate and efficient tracking requires that the optimal l̂ must be considered. Many conditions need to be met in order to determine the optimal l̂, including that there must be no surface material changes and no occlusions from shadows or other objects while the normal vectors of the target surfaces and all the coefficients for the illumination environment must be known. Normally, obtaining the optimal l̂ by mathematical computation is very difficult. Therefore, this work assumes that we have prior knowledge of the normal vectors of the plane of the target surface. In addition, we assume l to be the real geometric distance between two arbitrary points located on the plane, which can be denoted via pixel distance in a digital image. This work used 1 as the distance l between one pixel (x, y) and the next (x+1, y). This distance l is related to the accuracy and efficiency of the proposed system because l determines the volume of the point set to be used to calculate colour distance. Therefore, the determination of l is important in the proposed algorithm.
This section experiments with various values of l in order to analyse variation in the colour distances extracted from a point set according to l. This experiment for any variation in the maximum colour distance by l exploits the same image set as was used in the previous experiment, as shown in Fig.3.
Fig.5 shows the average results for various l of groups categorized by pose and illumination conditions equal to those shown in Fig.3. The horizontal axis represents the value of l and the vertical axis indicates the variance in differences for the maximum colour distance histogram of an image set. If the variances of the maximum colour distance histograms are generated using the optimal l, then the variances should have a value close to zero. As shown in Fig.5, the best range is 5. However, we can assume that the distance l has very little effect on the robustness of the maximum colour distance histogram. Based on computational efficiency via the above experiment, this work determined that the value of l was 3.

Histogram variance of the maximum colour distance for a volume of a neighborhood set.
4. System Design
The computation of the maximum colour distances in an image requires, at most, an amount of time that is proportional to the number of total pixels in the image. In general, if a tracking system demands a large amount of computational power, then its application will be limited to less than that of the conventional tracking systems. In addition, when all of the points in a point set are identical or differ only slightly, then the maximum colour distance will provide no information, with a zero or a near zero value. Therefore, in order to allow for efficient computation and effective estimation, the maximum colour distance was calculated with a constant difference value between the appropriate points. The conventional edge detector was employed to extract the proper points for computing the maximum colour distance. We used the Canny edge detector, which reduces the amount of data to be processed. In our experiment, the colour distance was processed only for the points extracted by the edge detector.
Although the use of the maximum colour distance is practical for illumination changes, the loss of colour information cannot be avoided because, then, the colour distance reduces the dimension of the feature space. For example, three dimensions of RGB colour will be converted into one dimension. Therefore, the results would be inaccurate when we apply only the maximum colour distance to track an object. We obtained responses that had greater accuracy by combining shape data with the maximum colour distance. The simple shape data template consists only of edge points. However, it could not be exploited without modification in this case because the target was deformable or else non-rigid.
We complemented the simple shape template by using a shape probability map with colour distances and applying the normal density function for shape data. The proposed shape template assumed that the shape of a target was within the normal distribution. If information about the shape of a target can be obtained via prior knowledge or through other methods, then the shape model can be designed with traditional machine learning techniques. The proposed system is based on a shape template with colour distance as a complementary method.
Fig.6 provides an example of each step for the proposed shape template. The first step defines the target. Fig.6-(a) shows an example of the defined object as a target – a front facial image. The next step is to extract significant points using conventional edge detectors. Fig.6-(b) shows the edge image of Fig.6-(a) using the Canny edge detector. This image is then used to obtain the shape template using the maximum colour distance for only those points that belong to a constant region that is centred around all of the extracted edge points. Each point set is defined with a constant variable l in (9). The maximum colour distance is calculated for all of the point sets while all of edge points are replaced with the maximum colour distances. Fig.6-(c) shows the sample data that is replaced with distances. In order to visualize an image, the colour distance map is normalized with grey levels ranging from 0 to 255. The maximum value is mapped to a white point and the minimum to a black point. The outlines of the glasses, which have the highest colour distance, are expressed as a white colour, as shown in Fig.6-(c). The map showing the maximum colour distances is converted to a probability density map using the normal density function. Fig.6-(d) shows the probability density map based on Fig.6-(c). Fig.6-(d) is also normalized with grey levels equal to those used in Fig.6-(c). The shape template that processed all of these steps is then used to track an object using an estimation of similarity.

Example of a probability map for a shape template with colour distances using the normal density function. (a) Defined original image of the target; (b) Edge image extracted by the edge detector; (c) Calculated colour distance map of (b); (d) Probability density map of (c) using the normal density function.
The proposed approach is divided into two steps: defining and modelling a target and tracking the target. The modelling step is shown as follows:
Initialize the current location and area of the tracked object within the reference image. Detect points with differences using edge detectors. Calculate the colour distances for the detected points. Generate a probability map for the shape template based on the colour distances and using the normal density function.
The tracking step is processed by the following sequence:
Obtain the next image.
Select candidates for the search region located in the centre of the current location.
Detect candidate points with differences using edge detectors.
Calculate the colour distances for each candidate.
Generate a probability map.
Compare the map with the target model.
If the similarity with the target is less than the threshold, stop tracking and update the current location. Otherwise, choose the candidate to be shown with the least similarity and then return to step 2.
The similarity estimation using the target model is measured via the following:

where f is a histogram function for the maximum colour distance, ρ is a probability map, T indicates the initialized target, e is a small positive number used in order to avoid dividing by zero and w implies the weight value of the colour distance histogram and the shape template. In this paper, w is defined as 0.5. This equation applies to all candidates and is used to determine that the target in the next frame is a candidate with the minimum amount of similarity.
5. Experiments
The experiments were conducted with an object that underwent illumination changes without scale variation, occlusion or translation, and a facial pose with only one tracking object and real recorded video. The digital image device used in this experiment was a SONY DCR-SR100, which supports digital images with resolutions of 720*480. We extracted 22 key frames for the experiment from the video stream. We selected the RGB colour space to be used for calculating the colour distances for all of the frames. Our choice for verifying the robustness of the maximum colour distance was the RGB colour space because it is more sensitive to illumination changes when compared with the alternative choices. Euclidean measurements were used as the distance metric for colour, d in (1). The proposed procedure for each frame took about 5 minutes on average by a PC with an Intel Core2 Duo 2.13 GHz CPU. There are no relations between the public database of Carnegie Mellon University for the parameter decision and the experiment data that is self-recorded video with various situations. The first video shows a face moved out of spotlight rather than an on-off light like with CMU. Second video illustrations a situation of smoothly colour change. Third video demonstrations sudden colour changes with a non-flat surface rag doll. Fourth video shows a crossover of similar colour distribution background and an initialized target.
The normalized gradient method [20] based on the inverse compositional algorithm [23] also posed a challenge to the illumination problem. The proposed algorithm exploits the shape template as being equal to the normalized gradient. The mean shift [12] using the colour distribution provides accurate results for non-rigid objects. Our method also uses colour information because the colour distance is calculated from the colour. Therefore, the normalized gradient algorithm and the mean shift based on colour are exploited in comparison with the proposed approach. Fig.7 shows the experimental results for tracking under white lighting. The luminance of the white lighting, as measured by a TSL251R sensor, will decrease from 3,000 to 300. All of the images are arranged in temporal sequence, from top to bottom. The five frames in a column are the 2nd, 26th, 54th, 68th and 80th frame within all of the frames of the input video sequence and, as shown, the tracking target is a front facial image. The target location over the entire sequence is changed from right to left. The appearance of the target is deformed concurrently from a front facial image to a left-sided image. The front face in the first image of the top row maintains its original skin colour under white light. However, as shown in the next images, the skin colour of the front face disappears as it moves away from the white light. This experiment was conducted independently using three different subject approaches, with translation and deformation simultaneous with colour change due to illumination change.

Experimental results for concurrent variation in appearance, colour and location. (a) Normalized gradient matching; (b) mean shift based on colour; (c) the proposed algorithm.
In the left-hand column in Fig.7-(a), the image sequence, from top to bottom shows the responses of the tracking system using normalized gradient matching. The topmost image in Fig.7-(a) shows the tracking results for the 2nd frame using the same method. The tracking system in the first image provides an accurate response because there is little difference in appearance between the front face and the initial front face as the target. The appearance of the subject begins to deform following the first image due to the head rotation from front to left. As the difference in the appearance increases with respect to the initial front face, the white rectangle – indicating the target position – becomes extremely skewed. The white rectangle seen in the second image has almost been transformed into a straight line. Finally, the white rectangle vanishes from the third image due to the excessive form difference. Tracking using normalized gradient matching failed in the second through to the final images.
Fig.7-(b), shown in the middle column, represents the results using the mean shift algorithm based on colour distribution. The mean shift method exploits only colour information without any target form assumptions. Therefore, mean shift is one of the best approaches for tracking a non-rigid object. The mean shift algorithm shows improved results when compared to the normalized gradient matching because the subject's appearance varies greatly. However, mean shift is not an appropriate method for objects that are experiencing colour change due to illumination because it performs tracking based on an initial colour target distribution. We can verify this by comparing the fourth and final responses in Fig.7-(b). The mean shift method provides correct images in the first through to the third images, which show similar initial skin colours. The face colours in the fourth and final results are changed to almost black and are different from the initial image. Therefore, the mean shift also failed to correctly track as effectively as the normalized gradient matching, shown in Fig.7-(a). The estimated locations for the white rectangle in the fourth and final images indicate the region with partial skin colour.
Fig.7-(c), shown in the right-hand column, shows the tracking results using the proposed algorithm. The proposed approach uses the maximum colour distance histogram and a shape template with colour distance. The proposed system based on the maximum colour distance tracks correctly over the entire sequence of images. Our method provides accurate responses for objects experiencing colour changes, as illustrated by the maximum colour distance showing little difference between the two frames under illumination changes. Although the proposed algorithm also exploits the appearance template in a similar manner to that used by normalized gradient matching, the histogram of the maximum colour distance supports the deformation of the target appearance using (13). Therefore, the proposed system still performs accurately in the fourth and final images, which show concurrent appearance deformation, translation and colour change in the target.
Fig.8 shows that the facial position is translated from the centre to the left as its pose sequentially changes from the frontal face to the left side of the face. The four rows in Fig.8 show that the 2nd, 9th, 15th and 22nd frames are arranged in temporal order from top to bottom. In the third row of the sequence, the skin colour of the face turned dark cyan due to the illumination change. The first frame shows the front face of a subject with a skin colour under white light. The luminances of white and blue illumination, measured by the TSL251R, are about 3,000. Although the skin colour maintains the previous pose during the second frame, the facial pose differs markedly from that where the initial front face was the target. The third frame shows that the skin colour has changed to dark cyan due to the external illumination. The final image in the fourth frame illustrates that the face colour had become a fully darkened cyan while the angle of the face was rotated completely from front to right. The locations of the target are indicated by a white rectangle for all of the results.

Experiment results for concurrent variation of appearance, colour and location under colour illumination change. (a) Normalized Gradient Matching; (b) Mean shift based on colour; (c) The proposed algorithm.
Fig.8-(a) shows the experimental results for normalized gradient matching. This method is based on an Inverse Compositional Algorithm and performs tracking for only grey images. The first result, shown in the first row of Fig.8-(a), displays an accurate response. However, this method yields inaccurate results between the last results and the final results. The white rectangle target indication was distorted in the last frame and became something like parallel lines in the final frame. The calculation range for a deformable object using the normalized gradient is limited because this algorithm is based on its image template. This approach failed to track correctly in the last frame, showing large deformations of the front face. Fig.8-(b) shows the tracking results for the mean shift based on the colour distribution. This method provides appropriate responses in the second frame in the sequence. However, the mean shift algorithm begins to respond incorrectly starting from the third frame, where the colour changes of the face are experienced due to illumination. In the final result, the mean shift fails to localize the target because it tracks the target location using the initial colour distribution. The estimated location is marked by the white rectangle in the fourth frame of Fig.8-(b) and has a similar colour distribution to that of the initial target – i.e., the front face indicated by the white rectangle in the first frame. Fig.8-(c) illustrates the experimental responses obtained using the proposed method. The proposed approach based on the maximum colour distance indicates accurate localization in all frames because the maximum colour distance provides robustness for illumination changes and also maintains the colour data.
Fig.9 shows another experimental result for an object with large variations in appearance, location and colour. The luminances of all the lights, measured by the TSL251R, are about 3,000. The illumination of all lights will be changed to the following sequence; 1. white (R,G,B:190,250,240), 2. blue (R,G,B: 40,200,240), 3. yellow (R,G,B:170,230,70), 4. red (R,G,B:200,60,80), 5. white (R,G,B: 190,250,240).

Experimental results for the concurrent variation of appearance, colour and location under fully colour illumination change. (a) Mean shift based on colour; (b) Normalized Gradient Matching; (c) The proposed algorithm.
We investigated the performance of the proposed method for radical colour illumination changes by removing all of the inter-frames that showed intermediates from one colour illumination to another colour.
The rows in Fig.9, from top to bottom, correspond to frames 9, 116, 190, 322 and 381 within the entire sequence. The colour illumination in Fig.9 changes all of the colours differently for each image within the sequence. There are four colour changes – blue, yellow, red and white – which consecutively occur during a sequence in Fig.9. The object is transferred concurrently from left to right in the sequence. The appearance of the object is also deformed due to rotation. The main colours of the target are red, white and yellow. These object colours will either be changed greatly or very little due to the colour illumination. The three columns of Fig.9 represent each response using the three different algorithms: mean shift, normalized gradient matching and the proposed system. The three different approaches were applied to the changed colours of the object and the experimental results were analysed for all of the methods.
Fig.9-(a) illustrates the response for the mean shift, which is able to yield accurate results until the second image. However, mean shift fails to track the object in the third and fourth images. The yellow lighting in the third image generates similar colour regions around the object. The bottom of the region, indicated by a white rectangle, maintains a similar colour distribution for the white part of the original target and the upper left of the rectangle also shows a similar red for the target. The mean shift in the 4th row of Fig.9-(a) failed to perfectly track the target due to the colours of the original object having changed to red due to the red illumination.
Fig.9-(b) shows the response for the normalized gradient matching approach. This method produces correct answers until the third row of the sequence. However, this approach has a high probability for abruptly failing to track when the deformation of an object surpasses the stated tolerance because the approach is based on a mathematical computation. In Fig.9, the object deformation increases due to the angle of rotation. The appearance in object variation between the first and third images is less than the allowable tolerance for deformation. However, the normalized gradient matching begins to misidentify the target location because over-deformation occurs after the third row of the sequence. Therefore, this method yields incorrect responses for the fourth and final images.
Fig.9-(c) shows the results of the proposed algorithm. The maximum colour distance used by the proposed system can provide a constant value, independent of colour changes due to the colour illuminants. Therefore, our approach supports accurate tracking for extreme colour changes. The proposed system also uses the shape probability density map to correctly track though a region of similar colour. We can verify this by comparing the fourth responses for mean shift with the first and third columns of the proposed system.
Fig.10 shows the crossover of a similar colour distribution background while the initialized target hand position is translated from left to right by the proposed algorithm. The frames shown in Fig.10 are arranged in temporal order from Fig.10-(a) to Fig.10-(d). The first frame Fig.10-(a) shows the hand of a subject with a skin colour and green coloured clothes. Fig.10-(a) shows that the hand moves over the face, which has a similar colour distribution with desirable localization. The hand on the face is shown in Fig.10-(c) with accurate localization. The final frame Fig.10-(d) shows the hand move across the face with desired localization. The proposed approach based on the maximum colour distance and probability map shows accurate localization in all frames because the maximum colour distance and probability map provide robustness for similar colour distributions and also maintain the colour data.

Experimental result for the crossover of a similar colour distribution background by the proposed algorithm. (a) Initialized target, (b) Move into the face, (c) Intermediate crossover, (d) Move out of the face.
6. Conclusion
In this paper, we propose a robust approach that is effective for colour variation caused by illumination changes. The proposed methods based on the maximum colour distance (MCD) provide robustness for tracking under target colour changes due to external illumination. Conventional colour-based object tracking methods – such as mean shift – require the target to maintain a minimum amount of initial colour information. However, this requirement depends upon the object and its environmental elements. When an object has a large colour variation, it may be lost as a target.
We provide a robust tracking algorithm that solves this problem using a modified mean shift algorithm with MCD that is defined from the physical illumination model. The proposed algorithm draws on the maximum value of geometric distances in a colour space on neighbour points. This guarantees the accurate tracking of the target even when target colour variation and movement occur simultaneously. The proposed algorithm proved its robustness by covering the colour variations through experiments and comparisons. From the experimental results, the proposed algorithm shows successful object tracking with colour variation in both artificial and real world environments. We have shown that our proposed algorithm is an effective approach for tracking real objects with colour variations caused by illumination. Our future work will research a robust object tracking algorithm using invariant shape information with MCD.
Footnotes
7. Acknowledgments
This Research was supported by the Chung-Ang University Research Grants in 2009.