
Abstract
Fluidization is an engineering unit operation that occurs when a fluid (liquid or gas) ascends through a bed of particles, and these particles get a velocity of minimum fluidization Vmf enough to stay in suspension, but without carrying them in the ascending flow. As from this moment the powder behaves as liquid at boiling point, hence the term “fluidization”. This operation is widely used in the aluminum smelter processes, for gas dry scrubbing (mass transfer) and in a modern plant for continuous alumina pot feeding (particles' momentum transfer). The understanding of the alumina fluoride rheology is of vital importance in the design of fluidized beds for gas treatment and fluidized pipelines for pot feeding.
This paper shows the results of the experimental and theoretical values of the minimum and full fluidization velocities for the alumina fluoride used to project the state of the art round non-metallic air-fluidized conveyor of multiples outlets.
1. Introduction
Gas-solid flow occurs in many industrial operations. The majority of chemical engineering units operations, such as drying, separation, adsorption, pneumatic conveying, fluidization and filtration involve gas-solid flow.
Poor powder handling in an industrial process operation may result in a bad performance, leading to errors in the mass balance, erosion caused by particles impacts in the pipelines, attrition and elutriation of fines overloading the bag houses. Lack of a good gas-solid flow rate measurement can cause economic and environmental problem due to airborne particles.
This paper focuses on the applications of powder technology related to the aluminum smelters processes such as dry scrubbing of gases and pot feeding to produce primary aluminum.
To optimize the residence time in the gas-adsorption process and minimize the energy consumption in the pot feeding, the precise determinations of the minimum and full fluidization velocities as well as the aerated and non-aerated angle of repose of the fluoride alumina are mandatory.
2. Fundamentals of powder fluidization
In the powder processes discussed above, it is important to know the hydrodynamic behavior of the particles in fluidized beds. It is known that the fluidization behavior of a gas-solid bed depends on the particle diameter and density. (Geldart, (1972–1973))1 classified powders into four types: C, A, B and D, based on their fluidization behavior. Geldart's diagram is illustrated in Figure 1.

Powder classification diagram for fluidization by air – source: (Geldart, (1972–1973))1.
The fluidized bed regime map is illustrated in Figure 2.

Flow regime map for various powders
Group C particles have small diameters and are very difficulty to fluidize. Channeling the bed of particles becoming difficult to determine the minimum fluidization velocity – ultrafine alumina (d p < 20 μm) Group A particles are aeratable and readily fluidize – fine alumina (dp ∼ 405 μm). Group B alumina forms a bubble bed after the fixed bed with increasing gas velocity – dp > 70 μm. Group D particles are relatively large bean-shape particles – dp∼1000 μm. This bed of particles is spoutable, re-circulating the particles in the fluidized bed
2.1 Minimum fluidization velocity calculation
This is generally defined as minimum superficial velocity at which the drag force and the upward buoyant force due to the fluid is balanced by the weight of the particles illustrated in Figure 3.
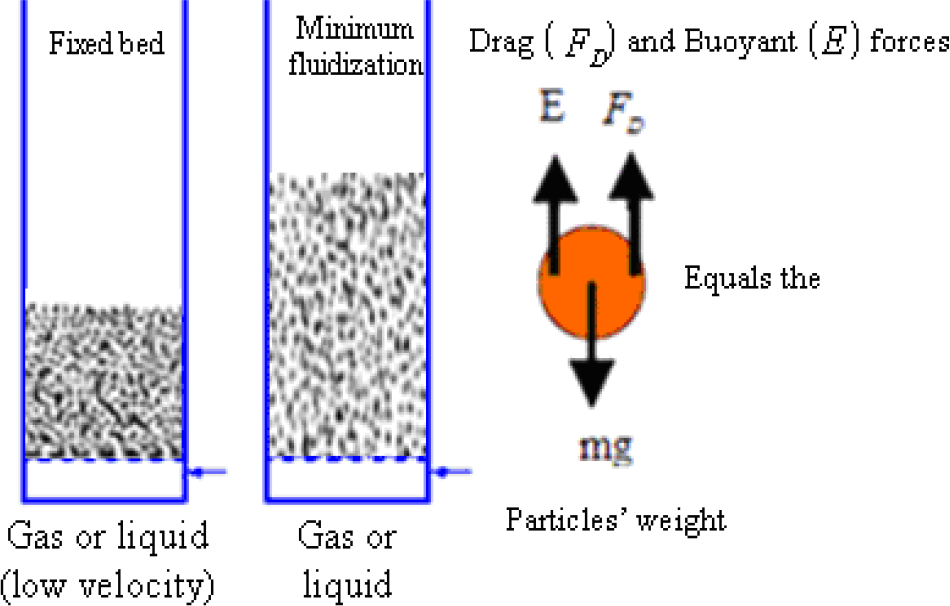
Fixed and a fluidized bed of particles at a minimum fluidization velocity – source: (Vasconcelos and Mesquita, 2011)2
2.1.1 Theoretical model equations for predict: Vmf
(Ergun, 1952)3 developed, for fixed beds, a pressure-drop correlation at incipient fluidization based on drag force considerations of a single particle in a bed of particles of the same size and neglecting the buoyant force as follows in equation 1.

Calculating C by equation 2 one gets an equation of second power, which the positive solution is calculated by equation 3.

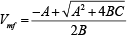
Where A and B are the viscous and the inertial factor of the Ergun equation, C is the weight per unit volume of the bed of particles.
Fluidization is related with small velocities, the factor B is negligible and the Ergun equation can be simplified with an error less than 5% related to equation 3 by the equation 4.
The prediction of Vmf by Ergun's equation for pressure drop requires the knowledge of sphericity of the particle (φs) and bed voidage (εmf). Many researchers has been trying to overreach the difficult to determine the voidage and sphericity of the particle, combining equations 1 and 2, plus the Arquimedes, Froude and Reynolds numbers with their experimental results adjusting their equations to predict Vmf as can be seen in Table 1.
Semi-empirical equations for predicting minimum fluidization velocity Vmf

For an incipient fluidization, when the weight of particles equals the drag force, it is a good attempt to consider the porosity at the minimum fluidization velocity εmf equals or close the porosity ε of the fixed bed. The porosity of the fixed bed is calculated by the equation 10.


Where ρbnv is the non-vibrated bulk density ρs is the solid real density derived in a laboratory by a pycnometer, Ms is the total mass of particles weighted on an electronic scale, Vtotal is the total volume of particles and voids in the sample previously weighted on an electronic scale, dp is the particle mean diameter obtained by sieve analysis in a laboratory, φs is the particle sphericity, that can be estimated from Figure 4 considering a normal packing bed of particles.

Voidage in uniformly sized and randomly packed beds- adapted from (Kunii and Levenspiel, 1991)11
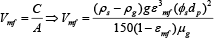
Based on the work of (Biswal et al, 2007)9 and data for alumina fluoride obtained upon a thesis by (Vasconcelos, 2011)10 for doctorate degree at Federal University of Pará, equation 12 was proposed to predict the minimum fluidization velocity.

Where:

And ρg;μg;g are respectively the real density and viscosity of the gas (air); acceleration due to gravity.
The experimental value of Vmf and minimum velocity of full fluidization Vmff are obtained using a permeameter as showed in Figure 5 measuring the gas superficial velocity and the pressure drop through the bed of particles.

Pressure drop through a bed of uniformly particles versus superficial air velocity – source: (Mills, 1990)12.
2.1.2 Experimentals details
A schematic diagram of the experimental set-up is shown in Figure 6. The arrangement of the permeameter made of fiberglass with acrylic sheets to allow visual observation of the fluidized particles. Two rectangular and one circular shape permeameters were built as illustrated in Figure 7. Air flow rate is measured by rotameters with precision of +- 3% full scale and the pressure drop with the appropriate dust filter in the pressure taps is measured by digital pressure transmitters at a precision of +- 1% of full scale. Air at a temperature of 303 K, (ρg =1.189kgm−3 and μg = 18.602x10⁻⁶ Pa.s) under one atmospheric pressure, used as the fluidizing medium was passed through a dust filter and humidity eliminator. The pressure was regulated at 2 bars in the inlet of the rotameters.

Permeameters used at Albras' laboratory to survey the minimum fluidization velocity of the powders used in the primary aluminum industry – source: (Vasconcelos, 2011) 10.

Experimental set-up: 1) air mover; 2) air receiver; 3) manometer; 4) air pressure regulator (0 – 3) bar; 5) ball valve; 6) air flow regulator; 7) rotameters (0 – 10; 0 – 25; 0 – 100; 0 – 700) LPM; 8) ball valves; 9) thermometer; 10) polyester porous membrane; 11) pressure drop transmitters (0 – 125; 0 – 1250; 0 – 5000) Pa; 12) permeameter.
2.1.3 Procedures
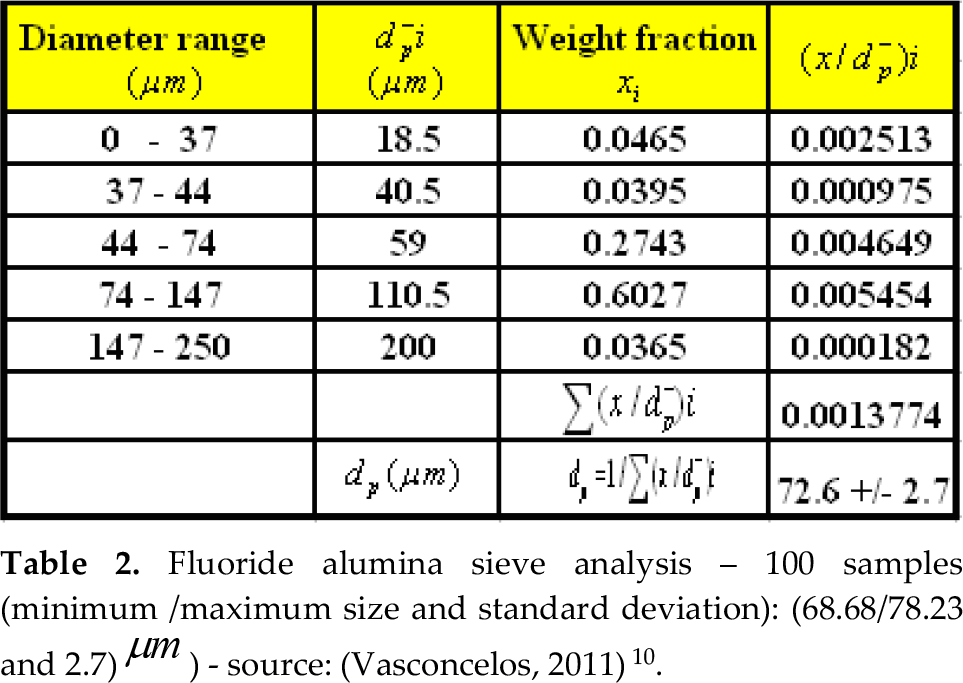
Alumina is a mixture of multi-size particles, so before to start the fluidization survey, it was necessary to perform a sieve analysis to characterize the particles size as can be seen in Table 2.
Fluoride alumina sieve analysis – 100 samples (minimum /maximum size and standard deviation): (68.68/78.23 and 2.7) μm ) – source: (Vasconcelos, 2011)10.
Firstly, a determined initial mass (15 – 53 kg) of alumina fluoride was introduced in the big rectangular 14″ permeameter and (3 – 12 kg) in the circular 8″ permeameter in order to ensure a bed height of about 0.1–0.4 m. Prior to actual fluidization tests, the bed was preconditioned to reduce the influence of interparticles forces in the dense bed packing. To this end, the superficial air velocity was rapidly increased around the predicted V mf and then decreased in more or less 30 s. This procedure guarantees better homogeneity of the bed. After this preparation the air flow rate was increased in steps of 2 LPM (liters per minute) for about one minute and subsequently the pressure drop in bed of particles was measured until the pressure drop stays constant at a variation less than 5%. Then, the air stream was decreased in steps of 2 LPM until 0 LPM see Figure 8. Each fluidization cycle test (batches of alumina fluoride summarized in Table 3) was repeated twice.
Parameters of the fluidized bed of alumina fluoride's particles – source: (Vasconcelos, 2011)10.


Experimental pressure drop in the bed of alumina fluoride – (72.6 +- 2.7) μm/3387.3 kg.m−3 versus superficial air velocity – source: (Vasconcelos, 2011)10.
From point A to point B in Figure 8 the pressure drop increases with velocity (fixed bed). The transition from the stagnant bed to fluidized bed occurs at point B, i.e. at the minimum fluidization velocity Vmf (52 cm/min) intersection with the maximum pressure drop. From point B the pressure drop increases until point C, i.e. at the minimum velocity of full fluidization Vmff (153 cm/min). The pressure drop remains constant with variation around 5% of the maximum pressure drop. After point C the bed is fully fluidized.
The same procedures explained above were used to obtain the experimental values of Vmf and Vmff summarized in Table 3 for others diameters of the alumina fluoride used at Albras aluminum smelter.
3. Results and Discussions
The minimum fluidization velocity was predict using equation 12 proposed by (Vasconcelos, 2011) 10 with an average absolute error less than 0,5% compare with the experimental showed in Figure 8.
For the granulometries sub 37 μm (- 400 mesh), it was used a small rectangular permeameter illustrated in Figure 9, because after more than 150 sieve analysis of the fluoride alumina we got only one kilogram of this fraction to study. As can be observe in Figure 9 it was impossible to determine the minimum fluidization velocity in this test due to channeling in the bed of particles.
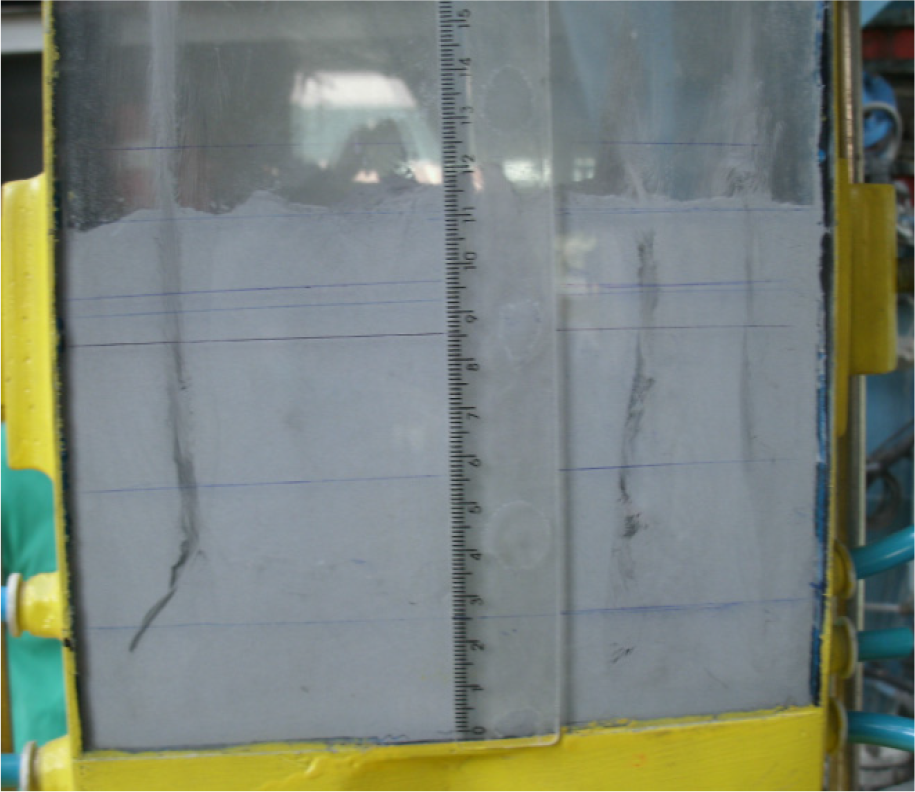
Permeameter of 50×200 mm used to fluidize alumina fluoride sub 37 μm (Geldart group C).
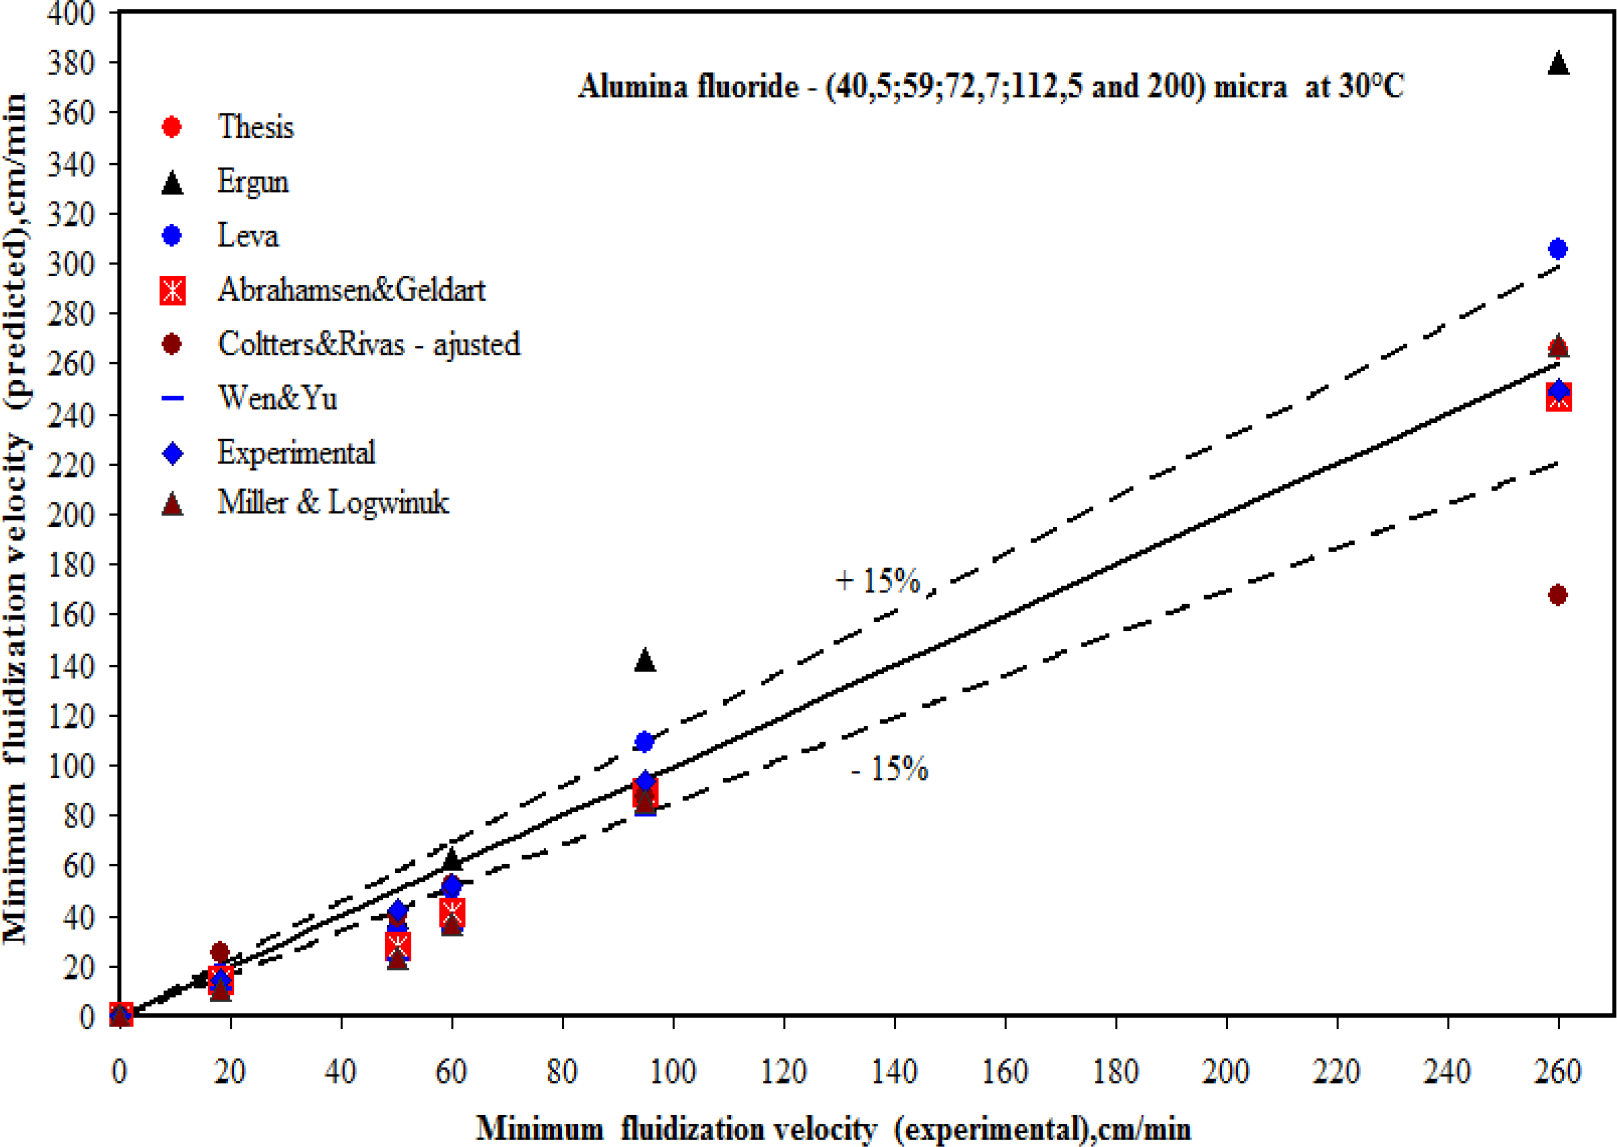
The experimental data obtained for the minimum fluidization velocity Vmf were compare with the equations proposed by (Vasconcelos, 2011)10, (Ergun, 1952)3 and others researchers listed in Table 1. The comparison of calculated and experimental Vmf for a stagnant bed of particles with the data related in Table 2 is shown in Table 4 with the respective absolute error (%) based on experimental value. Figures 10 and 13 show the graphic analysis.
Comparison of experimental and predicted minimum fluidization velocity for stagnant bed of alumina fluoride – source: (Vasconcelos, 2011)10.
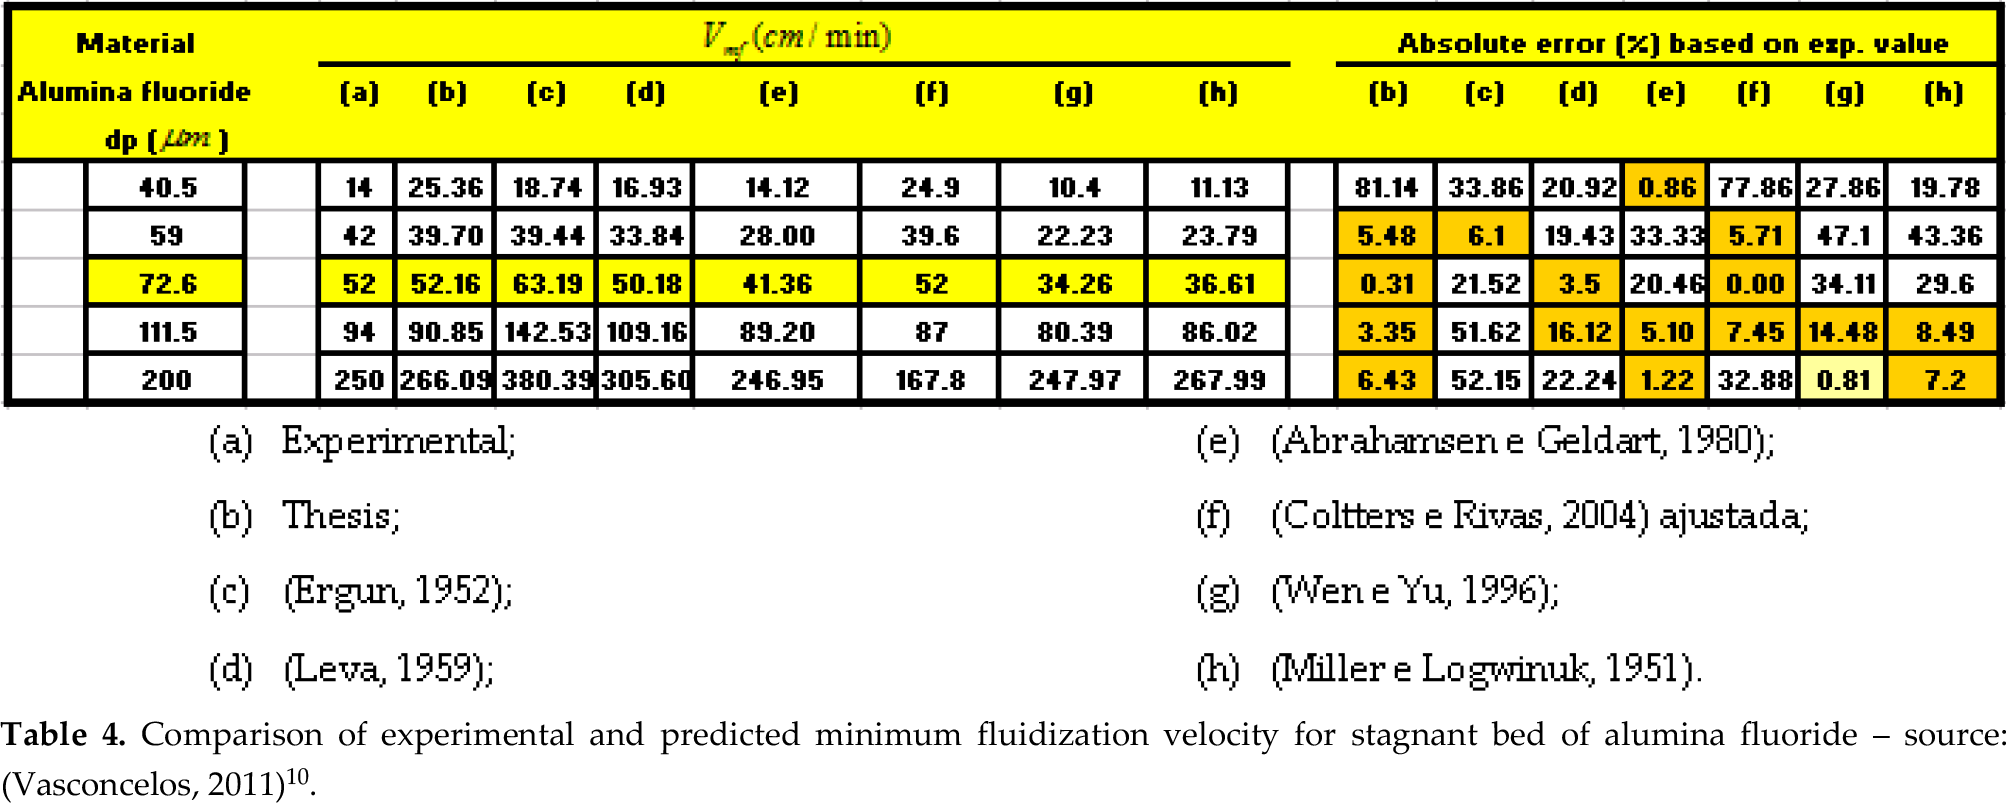
(a) Experimental;
(b) Thesis;
(c) (Ergun, 1952);
(d) (Leva, 1953);
(e) (Abrahamsen e Geldart, 1980);
(f) (Coltters e Rivas, 2004) ajustada;
(g) (Wen e Yu, 1996);
(h) (Miller e Logwinuk, 1951).

Comparison of experimental values of Vmf and predicted by Vasconcelos and Coltters and Rivas.

Apparatus to measure the non-aerated and aerated angle of repose – alumina fluoride non-aerated angle of repose (32.73+−0.437)°.
4. Conclusions
Experimentals were carried out with alumina fluoride and four fractions of this alumina in the fluidization laboratory erected at Albras smelter to survey the alumina rheology in order to optimize energy consumption of the state of art air fluidized conveyor developed and showed in Figure 12.

Albras non metallic air fluidized conveyor of three outlets
An equation was developed to predict the minimum fluidization velocity upon a thesis by (Vasconcelos, 2011)10 compared with other researchers and the experimental values. The predict values by Vasconcelos and Coltters and Rivas adjusted by the experimental result for dp = 70.6 μm are quite satisfactory with the experimentals results with an error less than 0,5% as can see in Table 4 and in Figure 10 and 13.
Comparison of experimental values of Vmf with predicted values
The correlations of Abrahamsen and Geldart fit very well with fine powders of group C and A. The equations of Wen and Yu and Miller and Logwinuk show better results for large particles of group B and D. The equation of Leva fit better with group B powders.
The correlations of Ergun and Vasconcelos are very sensitive to porosity and the sphericity of the particles and hence care should be taken to measure the porosity very accurately and also in estimate the sphericity using Figure 4.
The proposed correlation by this paper could also find practical utility in designing and operations of fluidized bed for gas dry scrubbing to estimate the residence time of the particles in contact with gases and also optimized the size and energy consumption of air slides.
Other important parameter is the non aerated and aerated angle of repose illustrated in Figure 11 to estimate flowability of the powder to be transport in conventional or new development of air fluidized conveyors of multiples outlets.
Footnotes
5. Acknowledgment
The authors would like to thanks the Lord God for this opportunity, Albras Alumínio Brasileiro SA for the authorization to public this paper, the Federal University of Pará for my doctorate in fluidization engineering and to my manager Marcelino Vasconcelos and the general managers Luís Carlos Carvalho Costa and Braz Mileo Ferraioli.