
Abstract
In this study, the experiments were carried out in a circulating fluidized bed with different coal bed methane and coal gangue mixing ratios. The results show that bed temperature distribution becomes well-proportioned and the combustion efficiency increases when coal bed methane was introduced. The NO emission increases along with the excess air coefficient rise. The SO2 emission reduces first and then increases with the rising bed temperature and there is an optimum temperature corresponding to the lowest SO2 emission. At the same time, the effects of the bed temperature and excess air coefficient on pollutant emissions are more obvious when coal bed methane and coal gangue mixing ratio is less than 0.3. In the experiments, the best operation conditions have been found at coal bed methane and coal gangue mixing ratio of 0.2 and excess air coefficient of less than 1.3. The results show that the co-combustion of coal bed methane and coal gangue in circulating fluidized bed is feasible and provides some references for the combustion optimization.
Introduction
Coal bed methane (CBM) is an associated gas during coal mining with its main combustible component methane and always diluted with air to atmosphere for safety.1–3 Coal gangue (CG) is a solid waste residue during the coal mining. A large number of these wastes not only pollute the environment but also result in wastage of resources. The clean and efficient usage of CG and CBM is actively carried out in China. The scope of comprehensive utilization about CG and CBM is broad. The co-combustion studies about gangue and coal washing mud or biomass in fluidized bed are widely studied recently.4–11 However, this research is mainly focused on the mixture of lean calorific value solid fuels; the co-combustion of lean calorific value solid fuel and gaseous fuel was less referred. CG with its characteristic low volatile and high ash content is difficult to be on fire.12–15 Circulated bed particles in circulating fluidized bed (CFB) furnace form a dense zone and keep at a high temperature. Therefore, CG can be ignited in time when in co-combustion with CBM in a CFB. Simultaneously, high-temperature flame formed by combustion of CBM can increase furnace temperature, enhance lean fuel combustion, and improve combustion efficiency and stability. The combustion speed of CBM is faster than that of CG during co-combustion. CBM consumes a large amount of oxygen while the gangue is difficult to catch fire. CBM easily grabs the oxygen when it is carried into the CFB. And it may cause the incomplete combustion of CG. It is important to choose reasonable CBM–CG mixing ratio, bed temperature, and excess air coefficient when organizing the co-combustion.16–18 The emissions caused by burning CG with higher sulfur content should be concerned. Based on the numerical studies,19,20 the key factors impacting the combustion and emissions of CBM and coal waste in CFB, such as CBM–CG mixing ratio (R), bed temperature, and excess air coefficient, were studied in order to achieve a high efficient combustion and low pollutions. 21 Pollutants from co-combustion of CBM and CG mainly include nitrogen oxides (NOx), sulfur oxides (mainly SO2), and dusts. SO2 and NOx emissions were primarily considered in this article. 22
Experimental
CG sample and CBM
Zhongliangshan CG was employed in the experiment; its industrial analysis and main chemical composition analysis were carried out. The details are shown in Table 1. Methane and nitrogen with their volumetric ratio 3:7 were mixed to simulate CBM. The low calorific value of CBM is 11,400 kJ/m3, and the low calorific value of CG is 11,760 kJ/kg.
Industrial analysis of coal gangue.

M: moisture content; A: ash; V: volatile matters; FC: fixed carbon content; ad: on air dry basis.
CFB system
The experiment system is shown in Figure 1.

The sketch map of co-combustion experiment system.
The experimental system includes a 50 kg/h CFB test equipment, CBM gas supply system, flue gas analysis test equipment, and the corresponding ancillary equipment and pipes.
The cross-sectional area of dense-phase zone is 150 × 230 mm and its height is 700 mm. The cross-sectional area of sparse-phase zone is 200 × 280 mm and its height is 2200 mm. The air distribution plate area is 140 × 220 mm and design flow velocity is 35 m/s. The primary air inlet was located at the bottom of the furnace, the secondary air inlet was located in the front wall of the furnace, 600 mm above the air distribution plate, and the coal bed gas burner was located in the back wall of the furnace, 950 mm above the air distribution plate.
The air was preheated to 300°C by electric heater. The heated air was divided into primary air and secondary air through the main air supply pipe. The primary air was introduced into the furnace from the primary inlet. The secondary air and the air for burning coal bed gas were taken from the secondary air pipeline, and two kinds of the air were introduced to the furnace from the secondary air inlet and air inlet of the gas burner, respectively.
The sketch map of the burner is presented in Figure 2. The coal bed gas burner is the composition of center pipe, gas pipe, two air ring pipe, and divergent nozzle. The air was introduced to the burner in two stages; it was a direct flow air in the inside air pipe, and it was a rotating flow air in the outside air pipe. The coal bed gas was introduced into the burner through the gas fuel pipe, and the guide vane was installed in the gas pipe to improve the swirl of gas flow. With the help of the center pipe, stable center reflux areas can be formed.

The sketch map of burner.
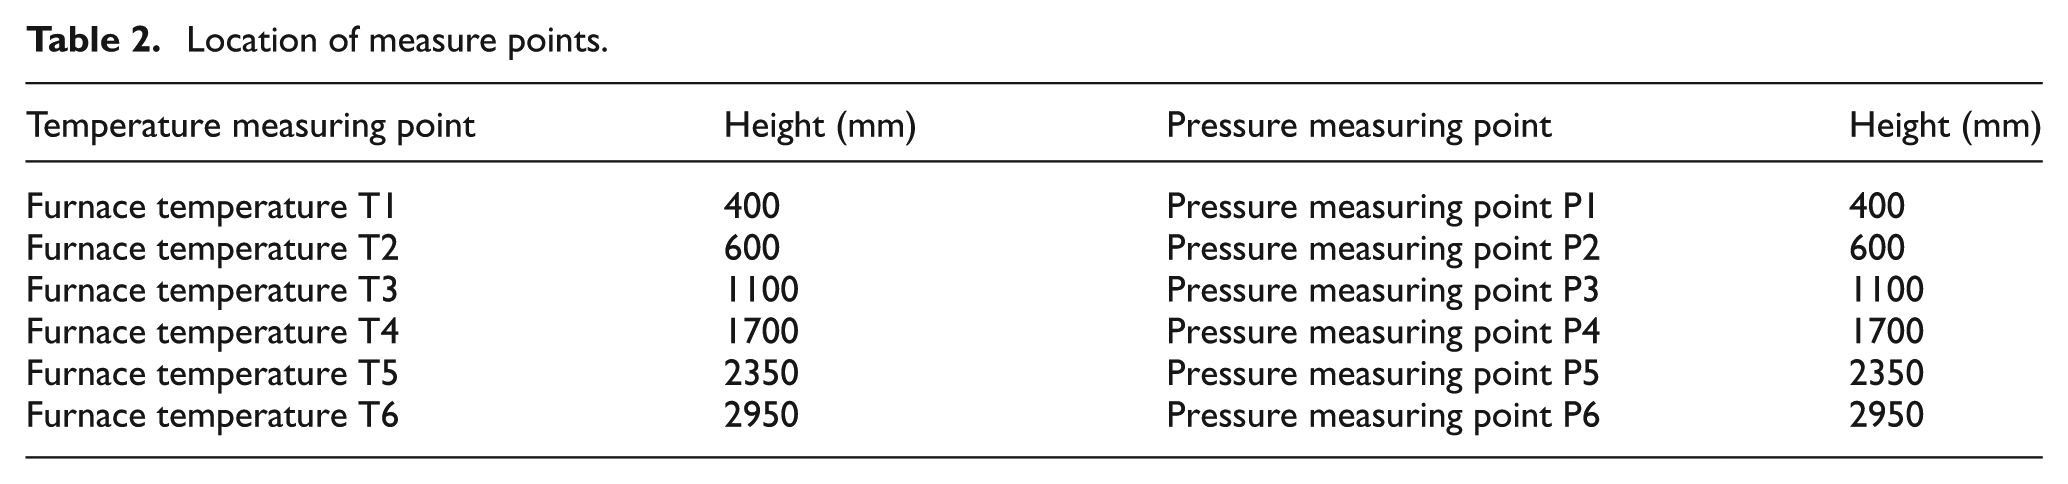
In the experiments, temperature, pressure, and concentrations of flue gas composition were measured. Six temperature measuring points and six pressure measuring points were arranged along the furnace height and the flue; the positions are shown in Table 2. For a temperature measuring point, the thermocouple was located in the center of the furnace, the average temperature was calculated by several repeated measurements when combustion was stable, and then this average temperature had been adopted for the temperature measuring point. The concentration of flue gas composition was measured in the outlet of flue.
Location of measure points.
Experimental condition and definition
The CBM–CG mixing ratio (R) is defined as the low calorific value ratio of CBM and CG, and it is described by
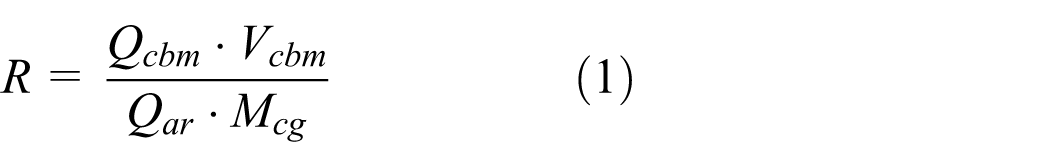
where Qcbm is the low calorific value of CBM (kJ/m3), Qar is the low calorific value of CG (kJ/kg), Vcbm is the CBM volumetric flow rate (m3/h), and Mcg is the gangue mass flow rate which was put into CFB (kg/h).
The theoretical air volume for gangue combustion is described by
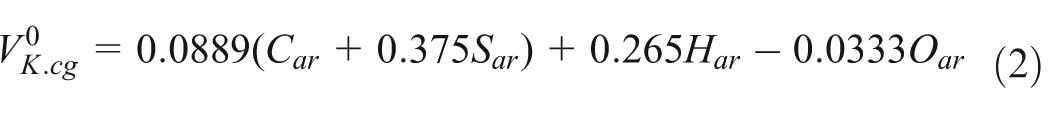
And the theoretical air volume for CBM combustion is described by

where
The air distributions for CG and CBM in different experimental conditions are shown in Table 3.
Air distributions of experimental conditions.

In Table 3, Q 1 and Q 2 stand for volumetric flow rate of primary air and secondary air, respectively


The secondary air ratio, r 2, is described as

The CBM–CG mixing ratio (R) with its values 0, 0.1, 0.2, 0.3, and 0.4 was studied in the experiments. R = 0 represents the fuel was CG only. During the experiments, the temperatures of each furnace section were measured with the K-type thermocouples. The flue gas composition is analyzed with the LancomSeriesII portable flue gas analyzer. The carbon content of fly ash was tested with a residual carbon analyzer. NOx formed by combustion can be divided into three kinds: thermal-type NOx, fuel-type NOx, and prompt-type NOx. Because the scope of the fluidized bed boiler’s operating temperature is below 1050°C, there is virtually no thermal-type NOx in the combustion process according to thermal-type NOx formation mechanism. The prompt-type NOx generally considered that N2 and the hydrocarbon fuels are burning when the excess air coefficient is less than 1; the import position of coal bed methane of the furnace is above the second wind, so the prompt-type NOx can be ignored. Therefore, the generation of fuel-type NOx is only considered in this article.
Combustion efficiency η is one of the important indicators of the combustion state. In this article, when calculating the combustion efficiency, the solid incomplete combustion heat loss and CO incomplete combustion heat loss have been considered mainly. Heat loss from solid incomplete combustion consists of the combustion heat of combustible C in fly ash and ash. The combustion efficiency computation formula is shown as follows


where η is the combustion efficiency,
The program of start CFB is as follows:
First, the state of liquefied petroleum gas cylinders and the burning torch must be checked; after confirming that the system is normal, the ignition of petroleum gas is started to heat bed material.
When the bed temperature increased to 400°C–500°C, the volume of primary air would be increased slowly to make the bed material achieve a steady flow state.
When the bed temperature increased to 800°C, the screw feeder is started to feed little amount of anthracite coal to the CFB. After 90 s, if the oxygen concentration decreased and the bed temperature increased more than 10°C, it indicated that the anthracite coal has been fired and the ignition is successful.
After the success of the ignition, the air volume and quantity of the anthracite coal must be adjusted to make the bed temperature 850°C–900°C, replacing anthracite coal with CG gradually.
After all the solid fuels are replaced by CG and the bed temperature is kept in stable condition, the air valve and CBM valves of gas burner are opened, and the CBM is introduced to combust with CG.
The whole process is about 2 h.
Results and analysis
Effect of R on bed temperature distribution and combustion efficiency
Figure 3 shows furnace temperature distribution at different CBM–CG mixing ratios under the conditions of the excess air coefficient α = 1.3 and secondary air ratio r 2 = 0.3. The temperature difference between dense-phase zone and sparse-phase zone is maximum when R = 0 and the difference gets the minimum when R increases. When CG was the only fuel, the temperature distribution and combustion organization are unsatisfactory because of its low calorific value and high ash characteristics. The high-temperature flame formed by CBM combustion can increase furnace temperature, which is beneficial to unburnt CG particles. Turbulence of solid particle and heat transfer between CG particle and CBM were enhanced in the furnace, the temperature distribution tended to be uniform, and the temperature difference between the upper and lower chambers reduces when CBM is introduced. However, when the volume of CBM is excessive, the gas volume and gas velocity increase in sparse-phase zone. The concentration of solid particles decreases and combustion portion reduces in dense-phase zone. At the same time, the flue gas volume increases because big volumes of low-temperature gases are brought into the furnace. The effect of the combustion heat release is weakened and the increasing range of the upper chamber temperature is inconspicuous.

Furnace temperature distribution at different R.
Table 4 shows the variations in combustion efficiency, carbon content of fly ash, and CO concentration at different CBM–CG mixing ratios under the conditions of the excess air coefficient α = 1.3 and secondary air ratio r 2 = 30%. As shown in Table 4, the carbon content of fly ash and CO concentration are higher while the combustion efficiency is relatively low for the purely burning CG (R = 0). The carbon content of fly ash and CO content are the lowest and the combustion efficiency is the highest when R = 0.2. The reason is that the methane combustion heat release can increase the temperature of the dilute phase zone; turbulence of solid and heat transfer between CG particle and CBM are enhanced; some unburned CG particle and CO are burned out in the sparse-phase zone because of the higher temperature and turbulence, so that the CO concentration and the carbon content of fly ash decreased. On the other hand, the increase in R means reducing the solid fuel supply, and the solid incomplete combustion heat loss (q 4) decreased. It is beneficial to the improvement of the combustion efficiency (η). Compared with R = 0.2, the gas velocity increases and the concentration of solid particles is lower in dense-phase zone when R = 0.3 or R = 0.4; the temperature of dense-phase zone decreased rapidly; the combustion is unstable; the CO concentration and the carbon content of fly ash increased because of the lower temperature of dense-phase zone and the higher gas velocity; and the combustion efficiency decreased.
Combustion efficiency, carbon content of fly ash, and CO content at different R.

CBM: coal bed methane; CG: coal gangue.
Effect of temperature on SO2 emission
The desulfurization agent is limestone in the experiment. Its average size is 0.5 mm. The influence of temperature on the SO2 emission concentration when the Ca–S molar ratio = 1.5 and CBM–CG mixing ratios R = 0 to R = 0.4 is shown in Figure 3. There is an optimum desulfurization temperature when the temperature rises. The desulfurization effect is not sensitive to temperature when CBM–CG mixing ratio becomes larger. The reason is that more CBM is brought into furnace and the total gas volume increases and then the sulfur content reduces when CBM–CG mixing ratios become larger. The temperature difference between the upper and lower furnaces is small and the desulfurization effect caused by the temperature variations changes little when R = 0.4. From Figure 4, it can be seen that the temperature in dense-phase zone is 830°C and SO2 emission concentration is the lowest (445 ppm) when R = 0. When R increased to 0.4, the optimal temperature is 850°C and SO2 emission concentration is 342 ppm. In general, the combustion efficiency and the desulfurization rate are a contradiction. However, it is found that comparing with R = 0, when R = 0.4, the desulfurization rate increases and the combustion efficiency is higher. The temperature in dense-phase zone has a significant effect on SO2 emissions. The emissions depend on the reaction rate of desulfurization agent, solid product distribution, and pore clogging properties. Desulfurization agent particles have favorable external mass transfer conditions in CFB and the resistance of gas film mass transfer can be ignored. The diffusion resistance of pore rapidly increases with the extension of reaction time. When the temperature is below 800°C, the reaction rate is low and desulfurization effect is poor; with the temperature rising, the reaction rate increases while the diffusion resistance also increases due to the premature clogging of sorbent surface pores. Under the high-temperature conditions, generated CaSO4 will decompose into CaO and SO2. Therefore, there is an optimum desulfurization temperature. When the bed temperature is greater than the optimum desulfurization temperature (850°C), the agglomeration of internal pore structure will mitigate the reaction rate of CaO and SO2 and finally result in lower desulfurization efficiency. When the temperature is between 800°C and 850°C, the desulfurization rate increases with the increase in the bed temperature. When R = 0.4, the bed temperature is higher than R = 0, so the desulfurization rate increases.

Effect of temperature on SO2 emission (Ca–S = 1.5).
Effect of CBM–CG mixing ratio on NO emission
The effects of CBM–CG mixing ratios on NO emission are shown in Figure 5. With the increase in CBM–CG mixing ratio, the NO emission decreased gradually and the decline tendency was more apparent when the CBM–CG mixing ratio was less than 0.3. The reason is that CH4 in CBM has a reduced effect on NO. The reaction equation of NO reduction by CH4 is shown as follows

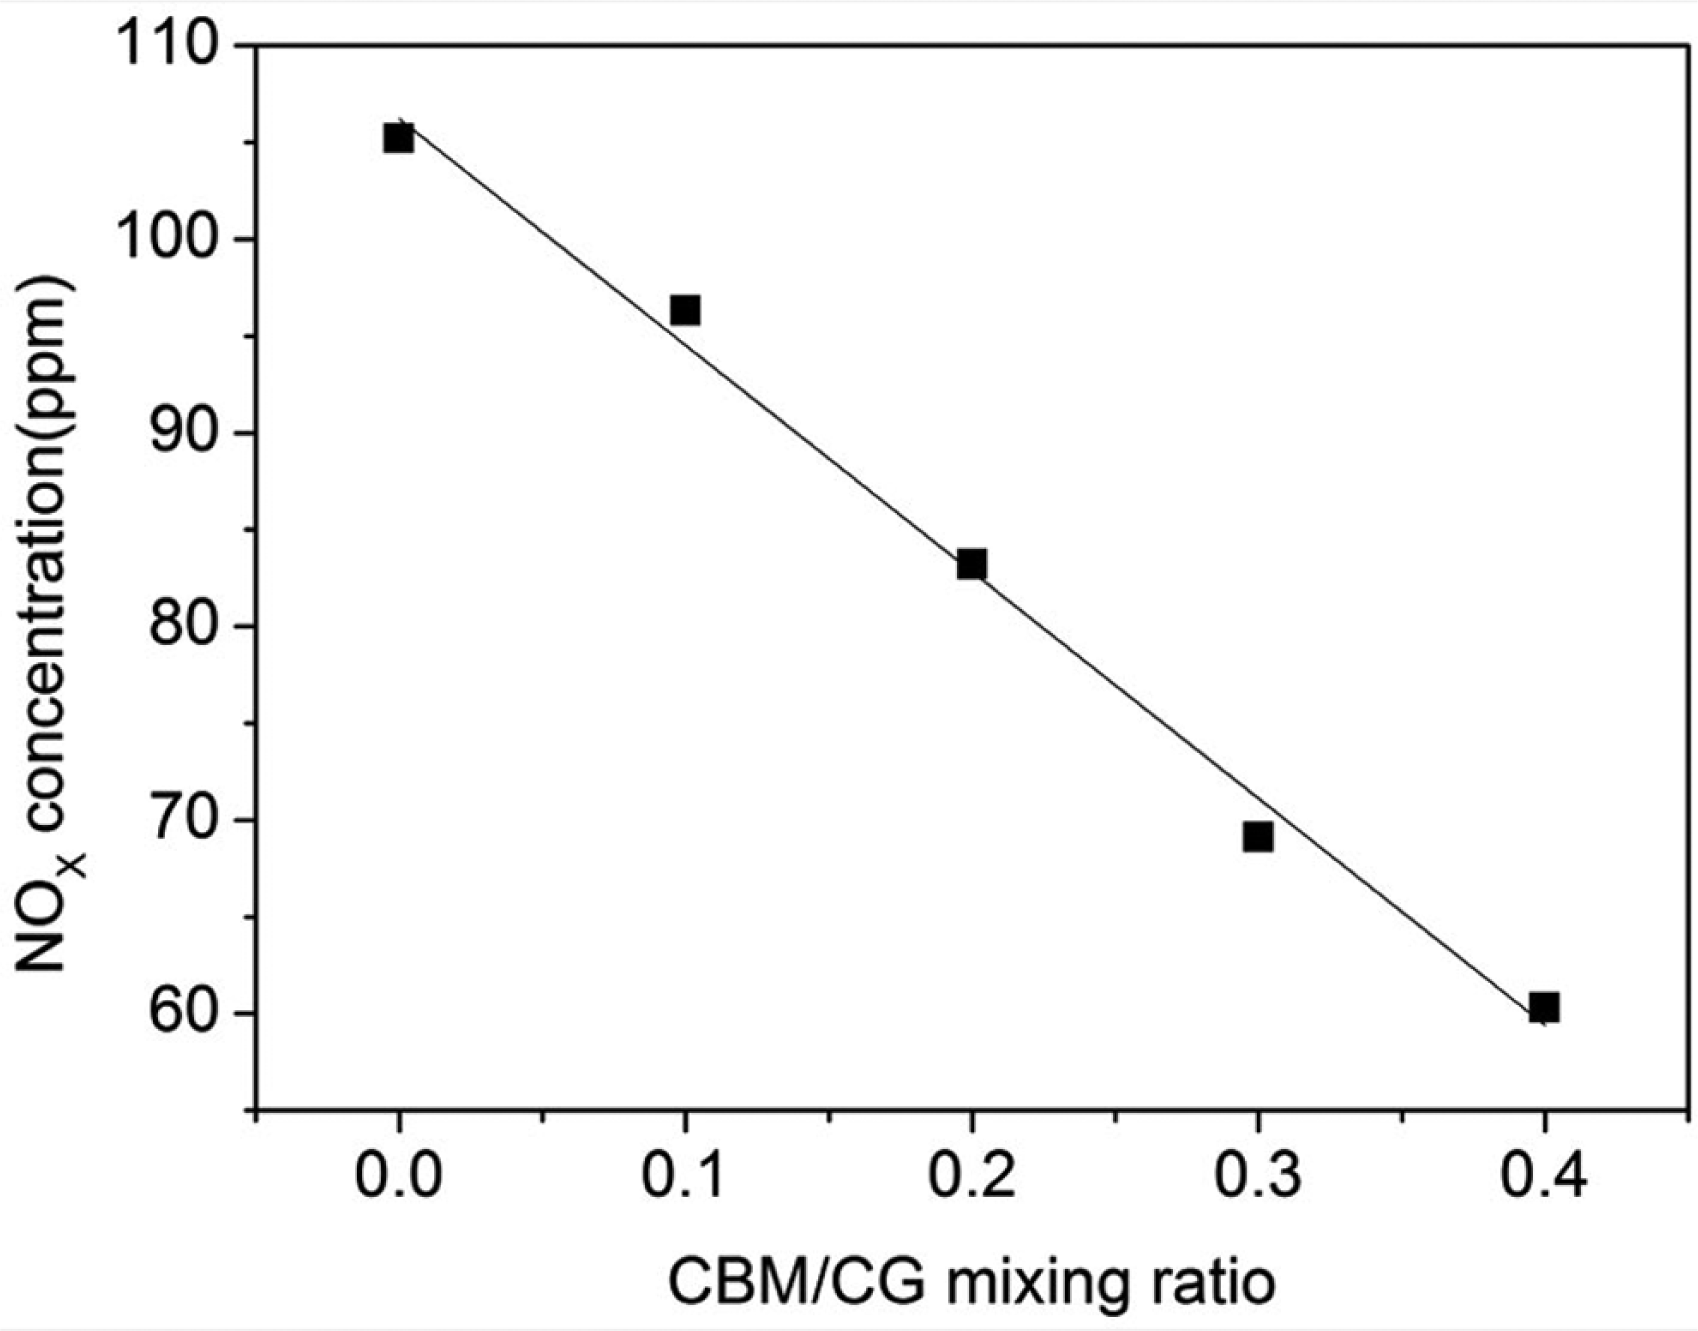
Effect of CBM–CG mixing ratio on NO emission.
The NO emission decreased when the CBM–CG mixing ratio increased because the reduction effect on NO was enhanced with increasing CH4 concentration. When the CBM–CG mixing ratio was more than 0.3, gas volume is increased and gas speed was accelerated when CBM–CG mixing ratio increased, so that gas residence time in the reduction zone was shortened. On the other hand, the CH4 reduction effect on NO would decrease with the decline of NO emission. The NO emission decline tendency became smaller.
Effect of excessive air coefficient on NO emission
The effects of excessive air coefficient on NO emission are shown in Figure 6. The NO emission increases with the increase in excess air coefficient and decreases with the increase in CBM–CG mixing ratios. This is mainly because oxygen volume increases along the furnace height when the excess air coefficient increases which makes the volatile and coke carbon reaction rate accelerated. The nitrogen precipitation process happens in advance. Therefore, the instantaneous concentration of NO increases. At the same time, oxidizing environment is enhanced and reductive environment is weakened with the increasing oxygen. As a result, the NO emission increases for the reduction reaction of CO and C. The NO emission increases obviously when the excess air coefficient is larger than 1.3. Therefore, lower NO emission can be achieved when the excess air coefficient is less than 1.3.

Effect of excessive air coefficient on NO emission.
Conclusion
Co-combustion of CBM and CG was carried out in a laboratory CFB. The temperature distribution, combustion efficiency, SO2, and NOx emissions were studied experimentally. The main conclusions are as follows:
Co-combustion of CBM and CG shows its advantages in temperature distribution and combustion efficiency comparing with purely burning CG. The CBM–CG mixing ratio has an important influence on the distribution of bed temperature and combustion efficiency. When R = 0.2, the temperature difference between dense-phase zone and sparse-phase zone is less than the other conditions. The distribution of furnace temperature is uniform and the carbon content of fly ash and CO concentration is lower when R = 0.2.
There is an optimum desulfurization temperature when the CBM–CG mixing ratio is R = 0 to R = 0.4. When R = 0, the optimal temperature in dense-phase zone is 830°C and SO2 emission is 445 ppm. When R = 0.4, the optimal temperature is 850°C and SO2 emission is 342 ppm.
With the increase in CBM–CG mixing ratio, NO emission decreases gradually and the decline tendency is more apparent when the CBM–CG mixing ratio is less than 0.3.
The excessive air coefficient has a major influence on NO emission. The NO emission increases with the increase in excess air coefficient. The lower NO emission can be achieved when excess air coefficient is less than 1.3.
Footnotes
Academic Editor: Hua Meng
Declaration of conflicting interests
The author(s) declared no potential conflicts of interest with respect to the research, authorship, and/or publication of this article.
Funding
The authors would like to thank National Natural Science Foundation of China (51206200) and Fundamental Research Funds for the Central Universities of China (CDJZR12140031 & CDJZR12140034) for sponsoring the research.