
Abstract
This paper presents an analytical model for the performance evaluation of an IEEE 802.11e network in non-saturation environments. We first characterize the probability distribution of the MAC layer packet service time. Based on the probability distribution model of the MAC layer packet service time, we then study the queuing performance of the wireless local area networks (WLANs) at different traffic loads based on the IEEE 802.11e MAC protocol. The numerical results show that we can choose a feasible number and bandwidth of the node which determines the system performance that a user demands.
1. Introduction
The widespread implementation of IEEE 802.11 as the standard for wireless local area networks (WLANs) has given reliability to the notion that WLANs may soon spread over a large number of multiservice communication networks. The primary difficulty faced in the use of IEEE 802.11 in multiservice wireless networks is the lack of quality of service (QoS) functionality as required by real-time voice and video applications [1]. To resolve this problem, the IEEE 802.11 Working Group created Task Group E to design medium access control (MAC) layer QoS enhancements according to the IEEE 802.11 standard [2]. The primary focus of the IEEE 802.11e standard is the hybrid coordination function (HCF). The HCF provides an efficient mechanism for centrally coordinated medium access and it uses the enhanced distributed coordination function (EDCF) for the distributed coordination of medium access. EDCF provides service differentiation among the different traffic priorities. It is also backwards compatible with the legacy 802.11 distributed coordination function (DCF).
In this paper, we present a mathematical model for the queuing analysis of IEEE 802.11e in a non-saturation condition. Bianchi has proposed a Markov chain model for the binary exponential backoff procedure in order to analyze and compute the IEEE 802.11 DCF saturated throughput [3]. There have also been attempts to construct a mathematical model for the throughput performance of IEEE 802.11e [4, 5]. These papers do not present the queue analysis results. Our analysis is based on the analytical framework used in [4] to compute the throughput performance of IEEE 802.11e.
In order to consider the non-saturated scenario, more practical queuing models for IEEE 802.11 DCF are proposed. They incorporate practical packet arrival processes [6]. The operation of a personal area network, operating under the IEEE 802.15.4 in the non-saturated scenario, which is also analysed using the theory of discrete time Markov chains and M/G/1/K queues [7].
To our knowledge, no comprehensive study has been done on the queue dynamics of IEEE 802.11e WLANs. The delay analysis is limited to the derivation of the mean value while the higher moments and the probability distribution function of the delay are untouched. Most of the current papers focus on the performance analysis in saturated traffic scenarios, while a comprehensive performance study under non-saturated traffic situations remains open.
In this paper, to concentrate on the above issues, first characterizing the probability distribution of the MAC layer packet service time. Based on the probability distribution model of the MAC layer packet service time, we then study the queuing performance of WLANs at different traffic loads based on the IEEE 802.11e MAC protocol.
The outline of this paper is as follows. The non-saturation Markov chain model is shown in Section 2. The analytical model for the packet service time is developed in Section 3 and the queue analysis of the model is presented in Section 4. Analytical results are presented in Section 5. Conclusions are given in Section 6.
2. Non-Saturation Analysis Model for EDCF
A simple and accurate analytical model was presented in order to compute the throughput of a saturated IEEE 802.11e DCF network under ideal channel conditions [4]. The model relies on two discrete time processes in order to model the progress of a given station through backoff. One process

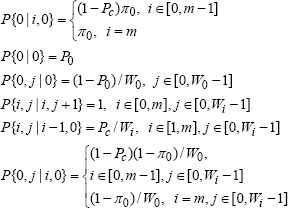
where n is the number of nodes with packets to transmit. In order to accommodate the QoS features provided by EDCF, we assume that each queue in the system is modelled by a Markov process that is specific to the AC associated with the queue. In the non-saturation regime, we assume that each network node accepts new packets via a finite buffer of size K. When the buffer is empty, the device will not attempt to do any transmission but when the buffer is full, the device will reject new packets coming from the upper layers of the protocol stack. The time required to transmit a packet from the head of the queue includes the time from the moment when the EDCF algorithm has started (i.e., from the start of the backoff counter procedure) to the moment when the receipt of the packet has been acknowledged by the receiving device. We will denote the packet service time with a Probability Generating Function (PGF) as

Markov chain model of EDCF in a non-saturation regime with a finite buffer
In the figure,

We assume that the values of
By ordering the elements of Ω lexicographically, we obtain the following transition probability matrix:

where the submatrices


and:
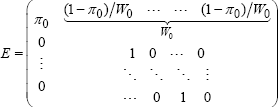
Note that all the states in Ω are a positive recurrence and the system is stable. Therefore, the steady state probability vector

By solving the equation

By Eq. (2),


Since,

Therefore, by substituting Eq. (5) into Eq. (4) we obtain

3. Probability Distribution of the MAC Layer Service Time
There are three basic processes when the MAC layer transmits a packet: the decrement process of the backoff timer, the successful packet transmission process that takes a time period of
The MAC layer service time is the time interval from the time instant when a packet becomes the head of the queue and starts to contend for transmission to the time instant where either the packet is acknowledged for a successful transmission or else it is dropped.
This time is important for when we examine the performance of higher protocol layers. Apparently, the MAC layer service time is a discrete random variable as the time unit used in transmission is a time slot. Even though
Let the non-negative random variable
The packet that leaves the mobile station through either being successfully transmitted or dropped goes to the absorption state of the Markov chain for the backoff mechanism. To obtain the average transition time to the absorption state of the Markov chain, we can use the matrix geometric approach. However, in the case of a Markov chain for
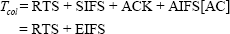
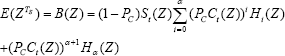
We first study the RTS/CTS mechanisms. The period of the successful transmission

While the period of collision

Generalized state transition diagram for the transmission process


In case the length of DATA is a fixed value

If the basic scheme is adopted, then

where

In the backoff process, if the medium is idle, the backoff timer will decrease by one for every idle slot detected. When detecting an ongoing successful transmission, the backoff timer will be suspended and it will be deferred for a time period of

where

Let

From the above formula, we observe that
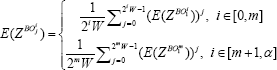
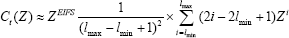
Therefore, the PGF of

For notational simplicity, we use the following notations:

By using the Eqs. (16)-(18), we obtain the PGF of
Since the expectation of
4. Queuing Modelling and Analysis
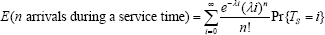
Many applications are sensitive to end-to-end delay and queue characteristics such as average queue length, waiting time, queue blocking probability, and service time. So, to obtain such performance metrics, it is necessary to investigate the queuing modelling and analysis for WLANs. A queue model can be characterized by the arrival process and the service time distribution with a certain service discipline. We have characterized the MAC layer service time distribution in the previous section. In this paper, we assume that the packet arrivals at each mobile station follow the Poisson process. The packet transmission process at each station can be modelled as a general single server. The buffer size at each station is K. Thus, the queuing model for each station can be modelled as an M/G/1/K when the Poisson arrivals of the packets are assumed.
Let
As such, we note that
Then, we have the following transition probability of

Moreover, we notice that:

where
According to the balance equation:

where
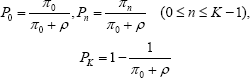
where ρ is the traffic intensity and
From the above derivation, we know that
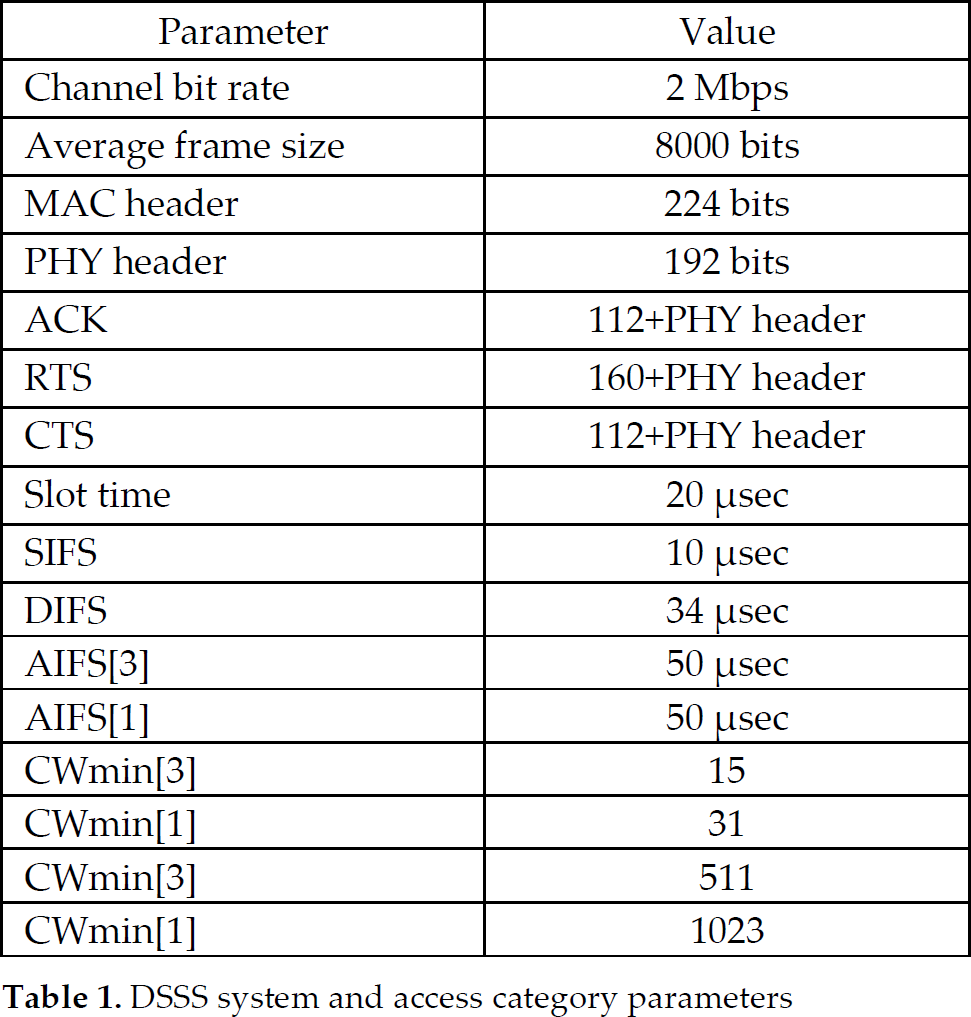
DSSS system and access category parameters
Throughput comparisons between numerical and simulation results (unit: Mbps)

The average queue length, blocking probability and the average waiting time - including the MAC service time - are given by:
If we know the blocking probability

where
5. Numerical results
In this section, we present the performance of the analysis and then we compare the analytical and simulation results to verify the accuracy of the proposed numerical model. Simulations are performed with the Matlab simulator. The parameters used in the numerical analysis and the simulations are listed in Table 1. In the analytical and simulation results, we use a three dimensional view of the performance metric for a varying number of nodes and the average bandwidth of nodes, respectively, in order to check the impact of the total incoming traffic load. Moreover, there exist AC3 and AC1 traffics in the experiment to show the effect of the service differentiation of EDCF. First of all, in order to verify the accuracy of the proposed model, the comparison of throughputs with a varying average bandwidth of nodes (the number of the nodes is fixed to 20) is presented in Table 2. As shown in the table, the results of simulation are almost the same as those of the numerical analysis. All of the simulation results in the table are obtained with a 97.85 % confidential rate (CR), which is calculated by the following:

where U denotes the throughput. Since the differences between the analytical and simulation results are negligible, in the remaining figures we present the results of the numerical analysis only.
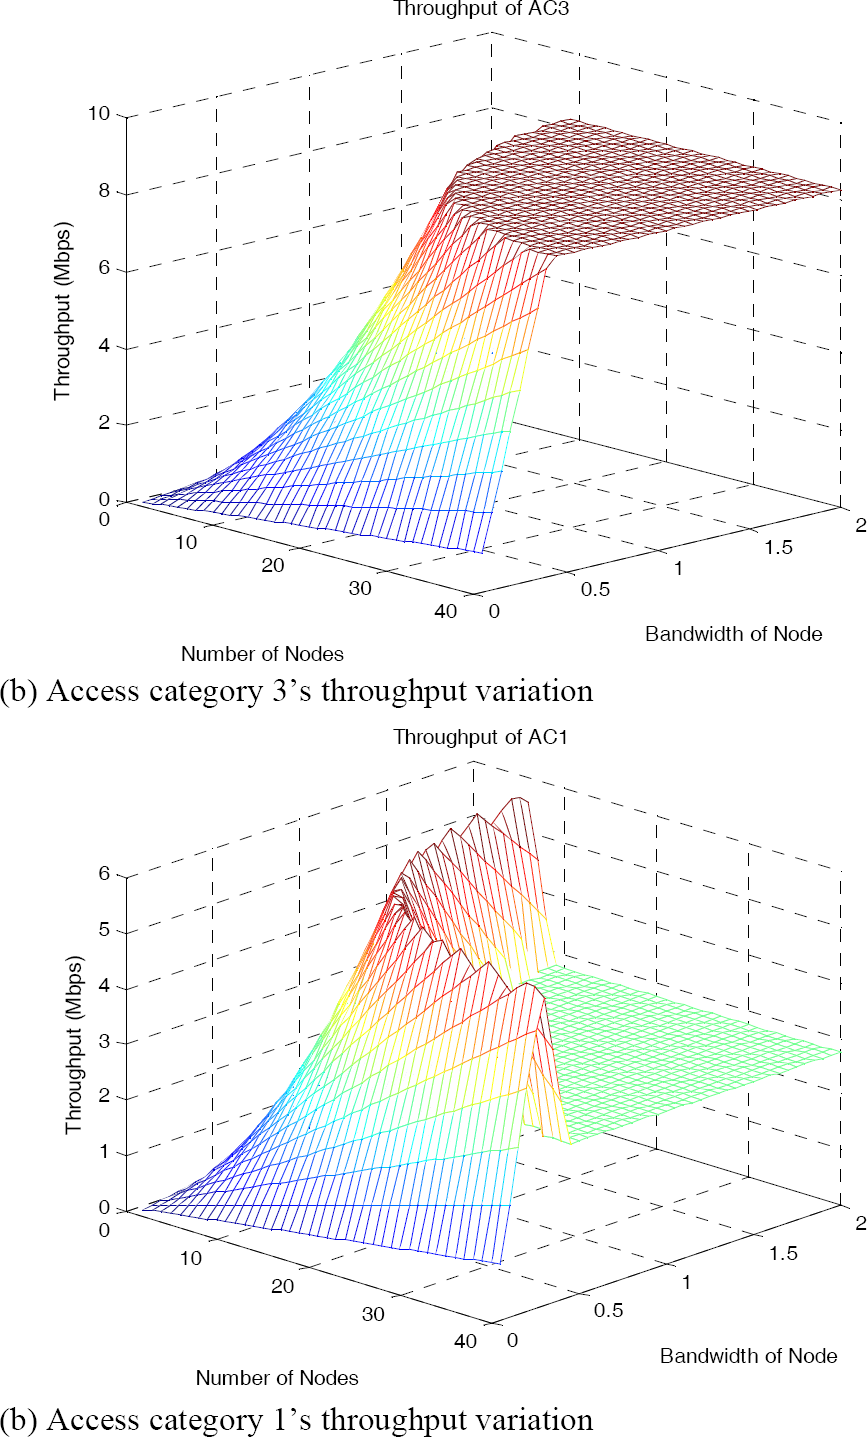
Throughput
Fig. 3 shows the three dimensional view of the throughput for a varying number of nodes and the average bandwidth of the nodes. As mentioned earlier, the variations in the number of nodes and the average bandwidth of them reflect the traffic load injected into the network. With these two metrics, we can obtain the normalized offered load as follows:

where n, P, λ and D denote the number of nodes, packet length, packet arrival rate and channel bit rate, respectively. In Fig. 3, it can be observed that the status of the network is divided into three parts, which are the non-saturated, semi-saturated and saturated conditions. In the first part (L < 0.72) of the two figures - viz. Figs. 3 (a) and 3 (b) - as the traffic load increases, the throughputs linearly increase. In the non-saturated condition, the network can sufficiently accommodate the increasing data traffic. On the contrary, in the second part (0.72 < L < 0.96), which is the semi-saturated condition, the throughput of AC3 still increases linearly while that of AC1 decreases sharply. Then, when the network comes into the saturated condition (L > 0.96), the throughputs of both AC3 and AC1 remain constant regardless of the increase in the traffic load. It is clear that the saturated throughput of AC3 is larger than that of AC1.
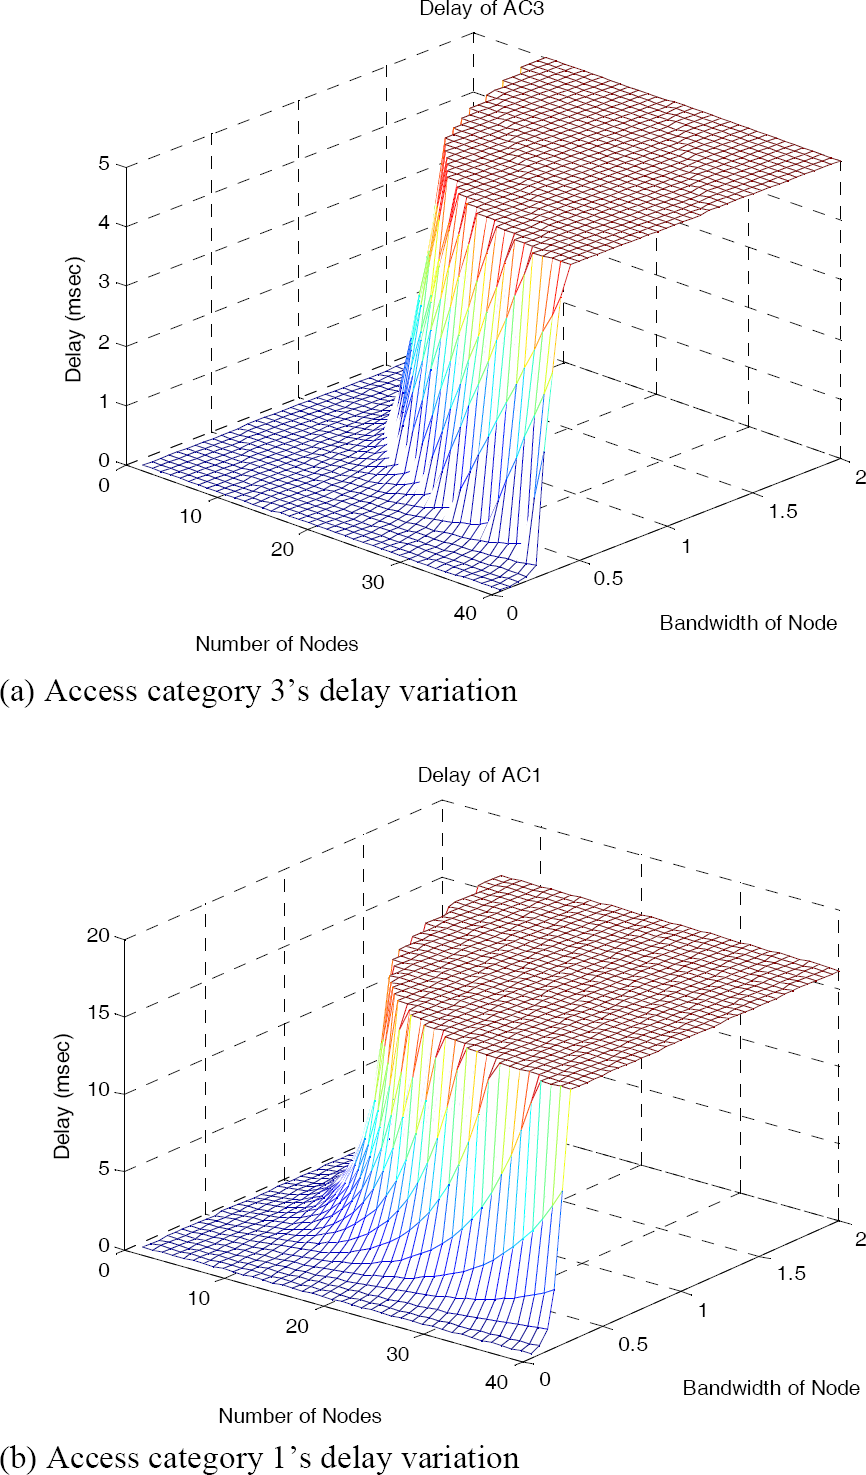
Delay
Fig. 4 shows the three dimensional view of the packet delay. When the semi-saturated condition starts, the delay of AC3 starts to increase linearly. However, in the case of AC1, the delay exponentially increases. Note that, under the saturated condition, AC1 exhibits a higher packet delay than is the case with AC3 (the average delays of AC3 and AC1 are 5 msec and 17 msec, respectively).
The variation of the collision probability is shown in Fig. 5. In the semi-saturated condition, the collision probabilities of the two node groups AC3 and AC1 increase sharply. When the network becomes saturated, they maintain constant values. Overall, the collision probabilities of AC3 are spread from 0 to 0.5 (Fig. 5 (a)), while the values of AC1 are spread from 0.1 to 0.6 (Fig. 5 (b)).
Comprehensively, the EDCF of IEEE 802.11e provides the prioritized QoS through the different access categories. Most of the performance metrics except for the throughput are rapidly deteriorated in the semi-saturated condition, rather than slowly, declining in the non-saturated status. In other words, the semi-saturated status acts as a performance boundary period between the non-saturated and saturated conditions.

Collision probability
6. Acknowledgments
This research was supported by Basic Science Research Program through the National Research Foundation of Korea (NRF) funded by the Ministry of Education, Science and Technology (2011-0014740).
7. Conclusion
This paper presented an analytical model for the non-saturation performance analysis in an IEEE 802.11e network. The model accounts for both the AIFS/CW differentiation mechanisms and the buffer state. Moreover, it considers the use of both basic and RTS/CTS access mechanisms. Significantly, it contains a probability distribution of the MAC packet service time, which is needed for M/G/1/K systems with small contention windows or operating under very high loads. The numerical results also show that most of the performance metrics in the IEEE 802.11e network rapidly deteriorated in the semi-saturated condition, which is the performance boundary period between the non-saturated and saturated conditions, rather than declining slowly during the non-saturated status. From the proposed model, we can choose the feasible number and bandwidth of the node which determine the system performance that a user demands.