
Abstract
This work describes a method for calibration of the Velodyne HDL-64E scanning LIDAR system. The principal contribution was expressed by a pattern calibration signature, the mathematical model and the numerical algorithm for computing the calibration parameters of the LIDAR. In this calibration pattern the main objective is to minimize systematic errors due to geometric calibration factor. It describes an algorithm for solution of the intrinsic and extrinsic parameters. Finally, its uncertainty was calculated from the standard deviation of calibration result errors.
Keywords
Introduction
Recently there have been several groups studying how to acquire 3D models of authentic world environments. The high accuracy, high resolution of three-dimensional models have become important in the sensor design to satisfy demands for civil engineering [1], environmental protection [2], planning [3], autonomous vehicles and robots [4], stationary and mobile surveying [5], mapping [6], as well as many other applications.
Error analysis is an important factor in calibration of a Light Detection And Ranging (LIDAR) system, the remaining errors must be estimated in order to establish the validity of the measurements. In addition, accuracy and precision are two different concepts for LIDAR error analysis. Accuracy is concerned with bias, usually determined by systematic errors. Precision is concerned with uncertainty, primarily determined by random errors, and in cases when counting LIDAR photons. It is determined for the most part by photonic noise. The measurement LIDAR error is classified into two main categories: systematic errors and random errors. In LIDAR error analysis, the measurement accuracy is determined by the accuracy of systematic errors where possible sources include: imprecise information regarding (1) atomic absorption cross-section, (2) laser absolute frequency calibration, (3) laser lineshape, (4) receiver filter function, (5) photo detector calibration, and (6) geometric factor.
In fact, the calibration of the laser range scanner plays a key role in generating an accurate 3D reconstruction that captures features with the best approximation to a real urban environment. One of the first attemps to propose a self-callibrating algoritm for LIDAR system, in [7] proposed a method based on ARMA models. After, in order to reduce the error introduced by the photo detector, the authors in [8] proposed a model and computed the best value for electronic parameters. In [9], present an automatic calibration approach for LIDARS based on predefined targets objects whose pose can be reliably recognized from a single observation; also, some numeric algorithms were applied in order to compute the geometric calibration factor. In that research, propose a novel calibration method of 2D scan laser sensor using a target object designed by the investigators was proposed. However, the LIDAR used had a limited vision angle and was composed of only one laser sensor. in order to improve the field of vision a 3D sensor must have a complete vision angle, one of 360 degrees and the number of lasers mounted in the LIDAR needs to be increased.
[10] proposed a methodology for calibrating specific lasers of the LIDAR Velodyne HDL-64E. These investigators took several sets of indoor data where only certain detectors were calibrated. Using the data sets, unique obstacles were acquired that were located at a known distance, for example, a piece of plywood held vertically in a long corridor. It was found that the offsets could be subtracted from each of these near horizontal lasers in order to obtain the correct distance information, the distance errors were between 0.3 and 0.5 meters.
In [11] using the nominal horizontal and vertical correction factors of the LIDAR Velodyne. For each laser, an additional distance offset was introduced that was computed by comparing the readings from a reference SICK LMS-291 sensor. Laser ranges with uncertainties in the order of 30cm were reported. In [12] a technique for the Velodyne HDL-64E S2 calibration based on an optimization process was presented, their calibration pattern is a 4.40m wide planar wall on a flat surface. The wall was scanned by aligning x-axis of lidar's fixed frame to the wall, and moving the lidar at various distances, ranging from 10 to 14m, and then by aligning lidar's y-axis to the wall and moving it at various distances ranging from 4 to 8m.
In [13], showing a technique for calibrating the Velodyne HDL-64E S2 model, as well as [14] presents the analysis and the stability of calibration parameters for the same scanner. [15] presents a method for the calibration of the Riegl LMS-Z420i lidar system. [16] performed self-calibration of a FARO LS880HE TLS scanner. Furthermore, in [17] shows the effect of systematics errors on the positional accuracy of a LiDAR point clouds proposing some alternatives.
The objective of this investigation is to reduce systematic errors due to geometric factor calibration of the LIDAR velodyne HDL-64E. A calibration pattern and a methodology were used in order to generate a numerical algorithm and build geometric models both for compution and calibration parameters. The calibration parameter presented herein had a high performance for nominal correction factors for each laser.
Lidar system
Currently, different types of LIDAR devices exist with varying scanning mechanisms, number of lasers, and geometric configurations. For this investigation, a Velodyne HDL-64E was used, see Fig. 1,

The Velodye LIDAR HDL-64E is composed of 64 beams. Each laser orientation is in the function of ϕ and θ. (a) The θ angle is achieved by utilizing the Velodyne rotation. (b) The ϕ angle is fixed by the beams.
The LIDAR possessing high definition that provides a 360 degree azimuth field of vision (θ) and a 26.5 degree elevation field of vision (ϕ). According to the aforementioned descriptions the scanner can be identified as a hybrid scanner on the market [18]. Furthermore, up to 15 Hz frame refresh rate, and a rich point cloud populated at a rate of one million points per second is possible. The HDL-64E operates on a rather simple premise: instead of a single laser firing through a rotating mirror, 64 lasers are mounted on upper and lower blocks with 32 lasers each and the entire unit spins. This design permits the use of 64 separate lasers, each firing thousands of times per second, providing exponentially more data points per second and a much richer point cloud than conventional designs.
For correction of the calibration parameters, it is necessary to understand how the Velodyne LIDAR Scanner converts the data, namely time-of-flight distance information, in a 3D position. The time-of-fight information from a LIDAR system can be used by the laser beam in order to measure the distance to the surfaces with high resolution and accuracy. The reflected pulses from the solid surface dominant the return signals which permits one to determine the time-of-fight to a much higher resolution than the usual pulse duration time. Each HDL-64E laser beam is fixed with respect to vertical angle and offset to the rotational level. For each data point issued by the HDL-64E, rotational and horizontal correction factors must be applied in order to determine the location of the point in 3-D space referred to by the return. This procedure doesn't factor in orientation of the scanner, such as roll, pitch, yaw. Both physical offsets between the two laser beam blocks are not presently taken into account; however adding these corrections is fairly straightforward. The following nominal correction factors are used:
vertCorrection(ϕ).- The elevation angle for each laser beam (positive rotates the laser beam towards the top of the scanner), i.e., vertical correction angle (deg), see Fig. 1(b).
rotCorrection(θ).- The azimuth angle offset for each laser beam (offset from the current rotation angle, positive rotates the laser beam counter-clockwise), i.e., rotational correction angle (deg), see Fig. 1(a).
distCorrection.- A distance correction offset in centimeters, applied to the time of flight distance given by an individual laser beam.
horizOffsetCorrection(h OSC ).- A horizontal parallax correction orthogonal to laser beam (cm), see Fig. 4.
vertOffsetCorrection(v OSC ).- A vertical parallax correction orthogonal to laser beam (cm), see Fig. 3.
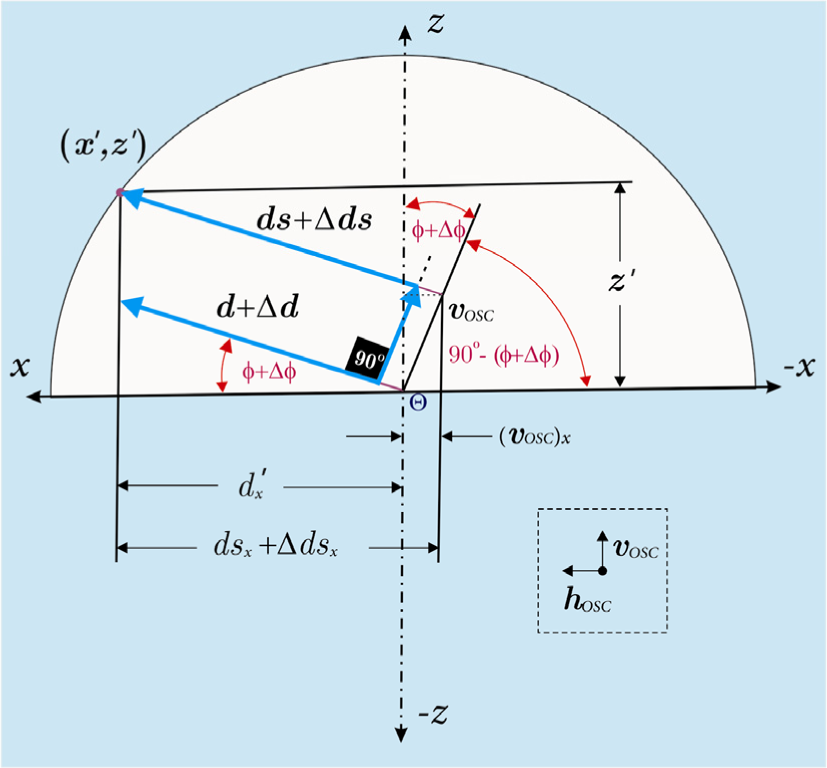
In these computations, the positive y-axis is at rotational degree zero and the scanner rotates clockwise around the z-axis. The offset corrections are to be applied in planes orthogonal to the rotation corrected laser beam. The origin Θ represents the beam pointing into the output window of the lidar, if the beam were aligned with +y in the world frame then v OSC would be aligned with +z and h OSC would be aligned with-x, which is shown in Fig. 2.

The elevation angle ϕ for each laser beam.
According to the aforementioned descriptions, it is induced from the model displayed by the manufacturer that the ending points of vectors


Correction for the elevation angle ϕ for each laser beam.
The magnitudes are calculated by the following:

In Fig. 3(a) by using basic trigonometry, the vectors and are parallel, that is:

Therefore, in order to compute the distance in the plane without accounting for rotation:


Correction for the rotational angle θ for each laser beam.
A basic model for the data generation process was applied which defines a spherical global coordinate system whose origin is the location of the LIDAR sensor. Then, the point cloud is modeled as a AllPointCloud = f(r,θ,ϕ) with respect to this point, where r is the radius of the surface, θ colatitude or zenith angle, and ϕ azimuthal angle of the unit sphere. The heuristic of the approximal mathematical model for measured 3D point consists of each position on the unit sphere after being converted to cartesian coordinates; however this conversion takes into consideration the addition of perturbations at extrinsic and intrinsic parametrers. See Fig. 5 and Fig. 6.

Perturbed intrinsic parameters from Velodyne LIDAR, for the rotational angle θ.
Perturbed intrinsic parameters from Velodyne LIDAR, for the elevation angle ϕ.
For each perturbed coordinate,
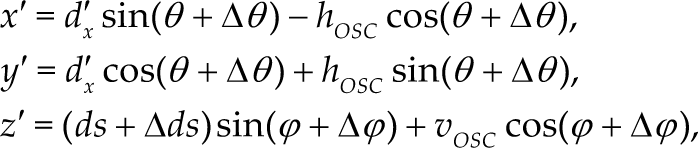
where, d′ x = (ds + Δd s ) cos(ϕ + Δϕ) – v OSC sin(ϕ + Δϕ).
For an specific laser i, the last equation can be rewritten as:
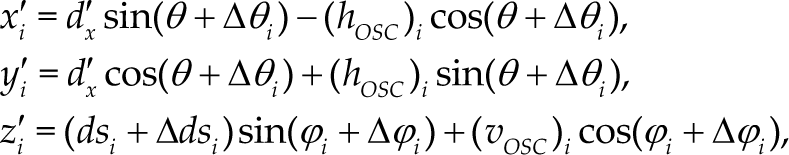

where, d′ x = (ds i +Δds i )cos(ϕ i +Δϕ i )-(v OSC ) i sin(ϕ i +Δϕ i ), i = 1,2,… 64.
The mathematical model considers five intrinsic parameters for the laser i, this is:

For the 64 lasers, the model computes 320 intrinsic parameters.
Given the number of parameters to be estimated, it is very likely that a minimization procedure converges on a local minimum, if it is not properly initialized. To avoid this, the calibration algorithm utilized herein uses several steps, minimizing incrementally specific parameters, before refining all their estimations using Eq. 7.
Initial parameters of Δθ i
For the lidar calibration, a target made up of five planes, was used see Fig. 7.

Two different views of the geometric targets: (a) and (b) With dimension of 2.42×2.42 meters. (c) and (d) 9.73×6.46 meters. The dimensions were recorded with the ultrasonic range finder SKIL-0520 with accuracy of +/-0.5%.
A first estimation of the intrinsic parameters is obtained by measuring the angle shift between them. For this, four planes of the target were used, see Fig. 8(a). If the z-axis of the lidar frame is parallel to z-axis of the target frame, the ds
i
are computed by means of:
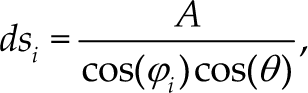

(a) Top view orientation, laser intersection with the four planes. (b) Side view orientation, intersection between the laser and one plane, the angle ϕ i for each laser is fixed, and the θ angle is given by lidar rotation. ds i is the distance between the lidar and the plane in a (ϕ, θ) direction.
where, A is the distance between the lidar and the plane, i corresponds to the laser number i = 1, 2,…, 64.
Laser intersection with a plane. The angle ϕ for each laser is fixed, and the θ angle is given by lidar rotation. ds
i
is the distance between the lidar and the plane in a (ϕ, θ) direction. If one laser is considered as a reference, the other lasers can be displaced by an angle Δθ
i
, these displacements are modeled by:

Usually, laser 1 is used as reference, in this case Δθ1 is zero. Fig. 9 shows the values of two lasers using the Eq. 12, in Fig. 9(a) the lasers are aligned while Fig. 9(b) shows the lasers misaligned by 15 degrees. In this figure, the displacement between the minimum local values represents the displacement between the laser orientation. In order to compute Δθ1, laser 1 is used as reference and computation of the displacement between the lasers is carried out using the local minimum.

The calibration pattern model consists of five planes, see Fig. 7: four walls and the floor. The pattern calibration frame is placed in the center of the four walls. The planes had to be referenced in respect to the lidar frame. Initially the position and orientation of the lidar frame and pattern frame were considered to be the same. The distance of the plane is computed by measuring the plane in respect to the lidar. For this case, the plane equation is:

where, j = 1,2,3,4,5. Let

As the lidar frame does not match the pattern calibration frame, the pattern frame is considered rotated and translated with respect to the lidar frame. Thus, Eq. 11 is rewritten as:

where,
In this investigation, the calibration pattern dimension was known; however the signal given for each laser when the LIDAR is in the calibration pattern was not known. Using the lidar model, the ideal signal for each laser was computed. Fig. 10 shows the signal for the laser numbers 10 and 47 by using

The values given by the lidar are: pan rotation (0), tilt orientation of the laser (ϕ
i
), distance measured by the laser in an angle θ (ds
i
), and the intensity of the signal. The parameters (θ, ϕ, ds) are corrected as θ′ = θ + Δθ
i
,ϕ′ = ϕ + Δϕ
i
, and ds′ = ds + Δds. It is possible to compute the signal for each laser by using the intersection between the planes as represented by Eqs.12 and 7 using the data θ, ϕ
i
,ds and intrinsic parameters {Δθ
i
,(h
OSC
)
i
,(v
OSC
)
i
, Δϕ
i
, Δds
i
} for the laser i. The signal for the laser can be represented as:

Using the values given by the lidar (θ, ϕ, ds), the initial values Δθ
i
and the nominal factors can be used as initial parameters, The 3D points:

are computed by using Eq. 7. The extrinsic parameters are initialized by measuring the pattern calibration and locating the center of their frame. For the total calibration, f
i
and g
i
were used see 3.3 and 2.2, respectively and a refinement stage utilizing the total minimization of the following expressions was carried:

in compact form

The minimization uses the Levenberg-Marquardt's method of Matlab, and is obtained by solving the equation systems:

where, Γ = {Δθ
i
, Δϕ
i
,v
OSC
)
i
, Δds
i
, (h
OSC
)
i
,
In this section, the experimental numeric results for a whole lidar calibration are presented. Given the number of parameters to be estimated, it is very likely that a minimization procedure converges on a local minimum if it is not properly initialized. In order to compute the extrinsic and intrinsic parameters, the following cases were considered:
Error of the nominal factor. Only the extrinsic parameters for comparing the 3D points of the pattern reconstruction with respect to the pattern 3D model were computed.
The nominal parameters are used to compute intrinsic and extrinsic parameters. The nominal parameters are used as initialization for the minimization method.
Proposed method. The calibration algorithm uses several incremental steps, minimizing some parameters, before refining all of their estimations by using Eq. 7.
Error of the nominal factors
Fig. 11(b), (c), and (d) show the reconstructed calibration pattern viewed from different angles. This reconstruction uses nominal parameters of the LIDAR. The extrinsic parameters are computed by minimizing the Eq. 13 in order to match the LIDAR frame and calibration pattern frame. Fig. 11(a) shows the histogram of error, the mean error is 22.4cm with a variance of 972 cm2. The error range specified in the LIDAR technical guide is 5 cm. [11] reported as an initial error of 30cm.
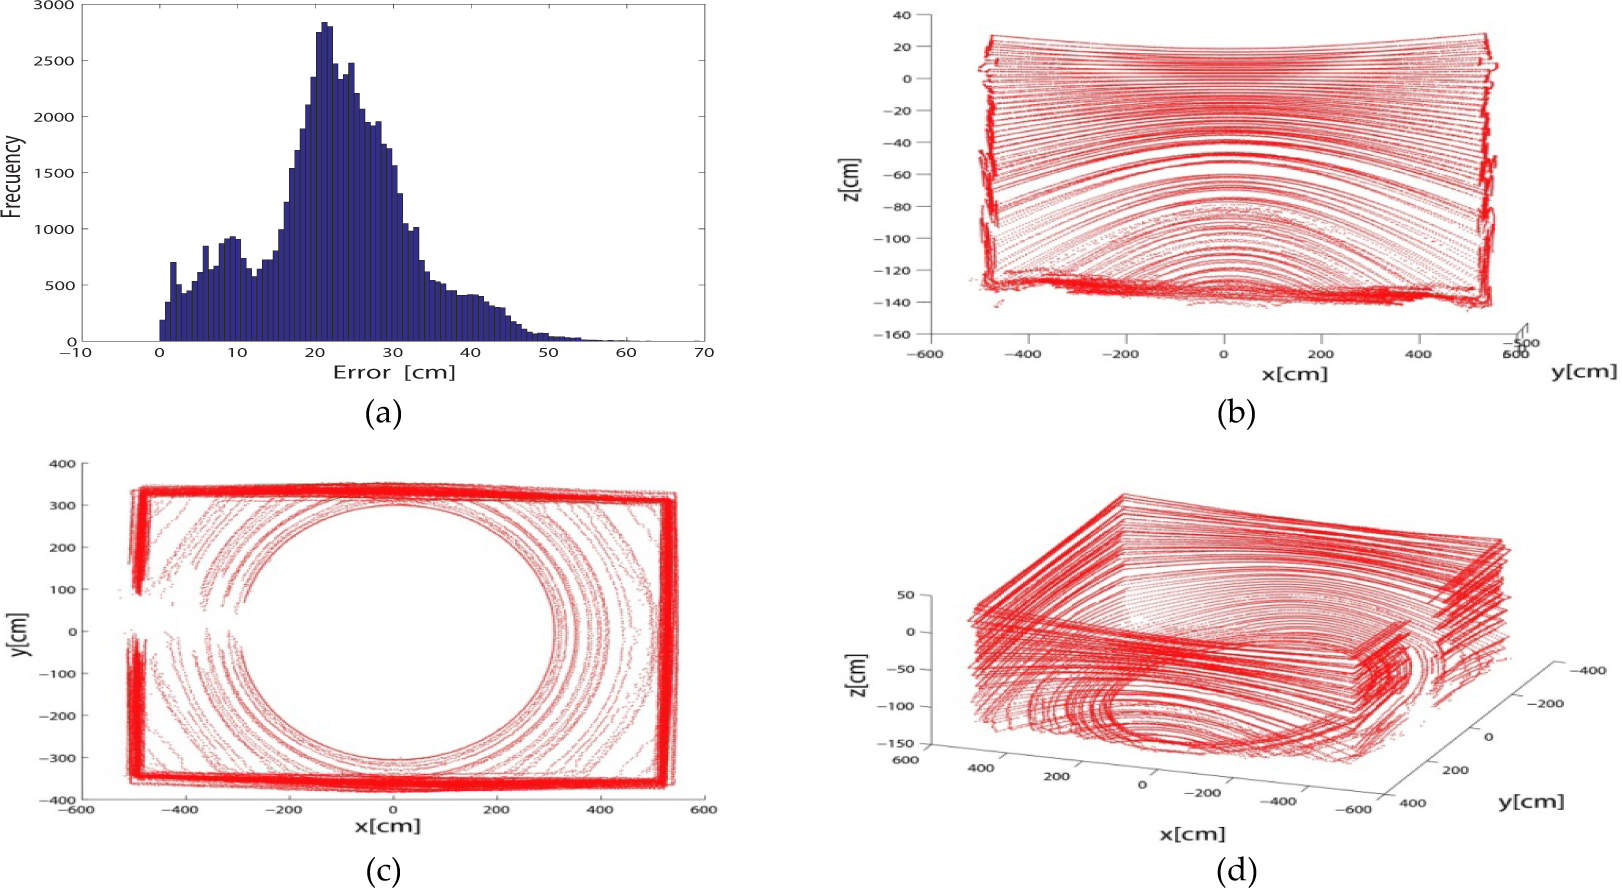
Calibration pattern reconstruction by using the calibration technique of Velodyne company. (a) Error of the nominal factor, the mean and variance are 22.54cm and 9.72 cm2, respectively. (b), (c) and (d) show the 3D calibration pattern reconstruction by using the nominal parameters.
The differences between the nominal parameters and the computed parameters are shown in Fig. 12(a), these differences are between 2.3 cm and 5.2 cm. Also, the difference between both values as represented in the Fig. 12(b). The differences of (v OSC ) and (h OSC ) between the nominal values and the computed values are shown in Figs. 12(c) and 12(d), respectively.

Differences between nominal parameters and the computed parameters by minimizing Equation (13). The nominal parameters are used as initialization. (a) ds i , (b) θ i , (c) (v OSC ) i , (d) (h OSC ) i .
To properly initialize the intrinsic and extrinsic parameters, the calibration algorithm uses several steps, minimizing some parameters increnentally, before refining all their estimations by using Eq. 7. The proposed method considered the following steps:
Physical measurement of the LIDAR position relative to the walls of the pattern calibration. These values are used to understand an approximation of the translation between the LIDAR frame and calibration pattern one. The accuracy of the system used for measuring this translation is to hundredths of cm. However, the LIDAR frame is unknown, and these measurements are not exact, but are still a very good initial value. Offset angle Δθ
i
. In Fig. 13, the ds
i
values are shown with respect to the LIDAR orientation. The data shown in Fig. 13 uses a calibration pattern target with dimensions 973×646 cm and the LIDAR frame does not match the center of the target. Therefore, the minimum local values are different. The LIDAR frame is displaced, with respect to the target center, 15 and 17 cm in x and y, respectively. In the figure, the displacement between the minimum local values represents the displacement between the laser rotation (Δθ
i
), such affirmation was discussed in Section 3.1 In order to compute the Δθ
i
, laser 1 was used as reference by computing the displacement between the lasers with the local minimum. Δθ
i
are computed by using the local minimum as described in the Section 3.1. The displacement angle between lasers 20 and 34 are shown in Fig. 13 which is 18.63 degree. Initialization of Δds
i
,(v
OSC
)
i
and (h
OSC
)
i
. The Δds
i
values are given by the physical laser position. It is not possible to measure these, but in order to obtain an approximate value, the nominal Δds
i
was used as initialization. The (v
OSC
)
i
and (h
OSC
)
i
parameters were initialized as zeros. Refinement values. Use the values described in items 1, 2 and 3 as the initial parameters for minimizing Eq. 13 considering the variables Δθ
i
, Δϕ
i
, (v
OSC
)
i
, Δds
i
, (h
OSC
)
i
,R,T.

Data for the lasers 20 and 34 using the nominal correction factors.
Fig. 15(a) show the histogram error of the calibration by using the proposed methodology. The mean error was 1.56 cm with a variance of 2.22 cm2. These errors are smaller than the errors produced by the nominal values, see Fig 11. In Fig. 14(b), (c) and (d) shows the reconstructed calibration pattern viewed from different orientation. The width of the wall is thinner than that of Figs. 12 and 11 where the same calibration pattern was reconstructed.

Calibration pattern reconstruction by using the new parameters. (a) Histogram error of the LIDAR calibration, the mean and variance errors are 1.56 cm and 2.22 cm2, respectively. (b) Front plane. (c) Top plane. (d) Isometric view orientation.

Differences between nominal parameters and the computed parameters by minimizing Equation (13) by the methodology described in this Section (a) ds i . (b) θ i . (c) (v OSC ) i . (d) (h OSC )i.
The Fig. 15 shows the differences between the computed intrinsic parameters by using the proposed methodology in this section and the nominal parameters.
In Fig. 16(a), the 64 ds i values are shown. The figure on the left shows the nominal parameters, while the figure on the right shows the ds i parameters computed with the minimization of the Eq. 13 by using the methodology presented in this section.

(a) Nominal factor of Δds i . (b) Computed values of Δds i by minimizing the Equation (13) and the nominal factor as initialization. (c) Computed values of Δds i by using the proposed methodology.
The differences between the nominal parameters and the computed parameters are shown in Fig. 15(a), the differences between these parameters are bigger than the parameters computed in the Fig. 12.
Fig. 17(a) and (c) shows the nominal parameters and the parameters computed by minimizing the Eq. 13 using the steps presented in this section. The difference between both values is represented in Fig. 15(b).

(a) Nominal factor of Δθ i . (b) Computed values of Δθ i by minimizing the equation (13) and the nominal factor as initialization. (c) Computed values of Δθ i by using the proposed methodology.
The nominal factor are shown in Figs. 18(a) and 19(a), respectively. The computed values (v OSC ) i and (h OSC ) i proposed are shown in Figs. 18(c) and 19(c). The differences of (v OSC ) i and (h OSC ) i between the nominal values and the computed values are shown in Figs. 15(c) and 15(d), respectively. The computational time needed to estimate all the calibration parameters was 8564.9s.

(a) Nominal factor of (v OSC ) i . (b) Computed values of (v OSC ) i by minimizing the Equation (13) and the nominal factor as the initialization. (c) Computed values of (v OSC ) i by using the proposed methodology.

(a) Nominal factor of (h OSC ) i . (b) Computed values of (h OSC ) i by minimizing the Equation (13) and the nominal factor as the initialization. (c) Computed values of (h OSC ) i by using the proposed methodology.
Fig. 20 shows a 3D environment reconstruction at different scale. The reconstruction in the figure on the left uses the nominal parameters; however, the column on the right uses the parameter computed in this section. From the figure it is evident that if the scale was reduced, the walls are better defined and less noisy than when nominal calibration parameters are used.
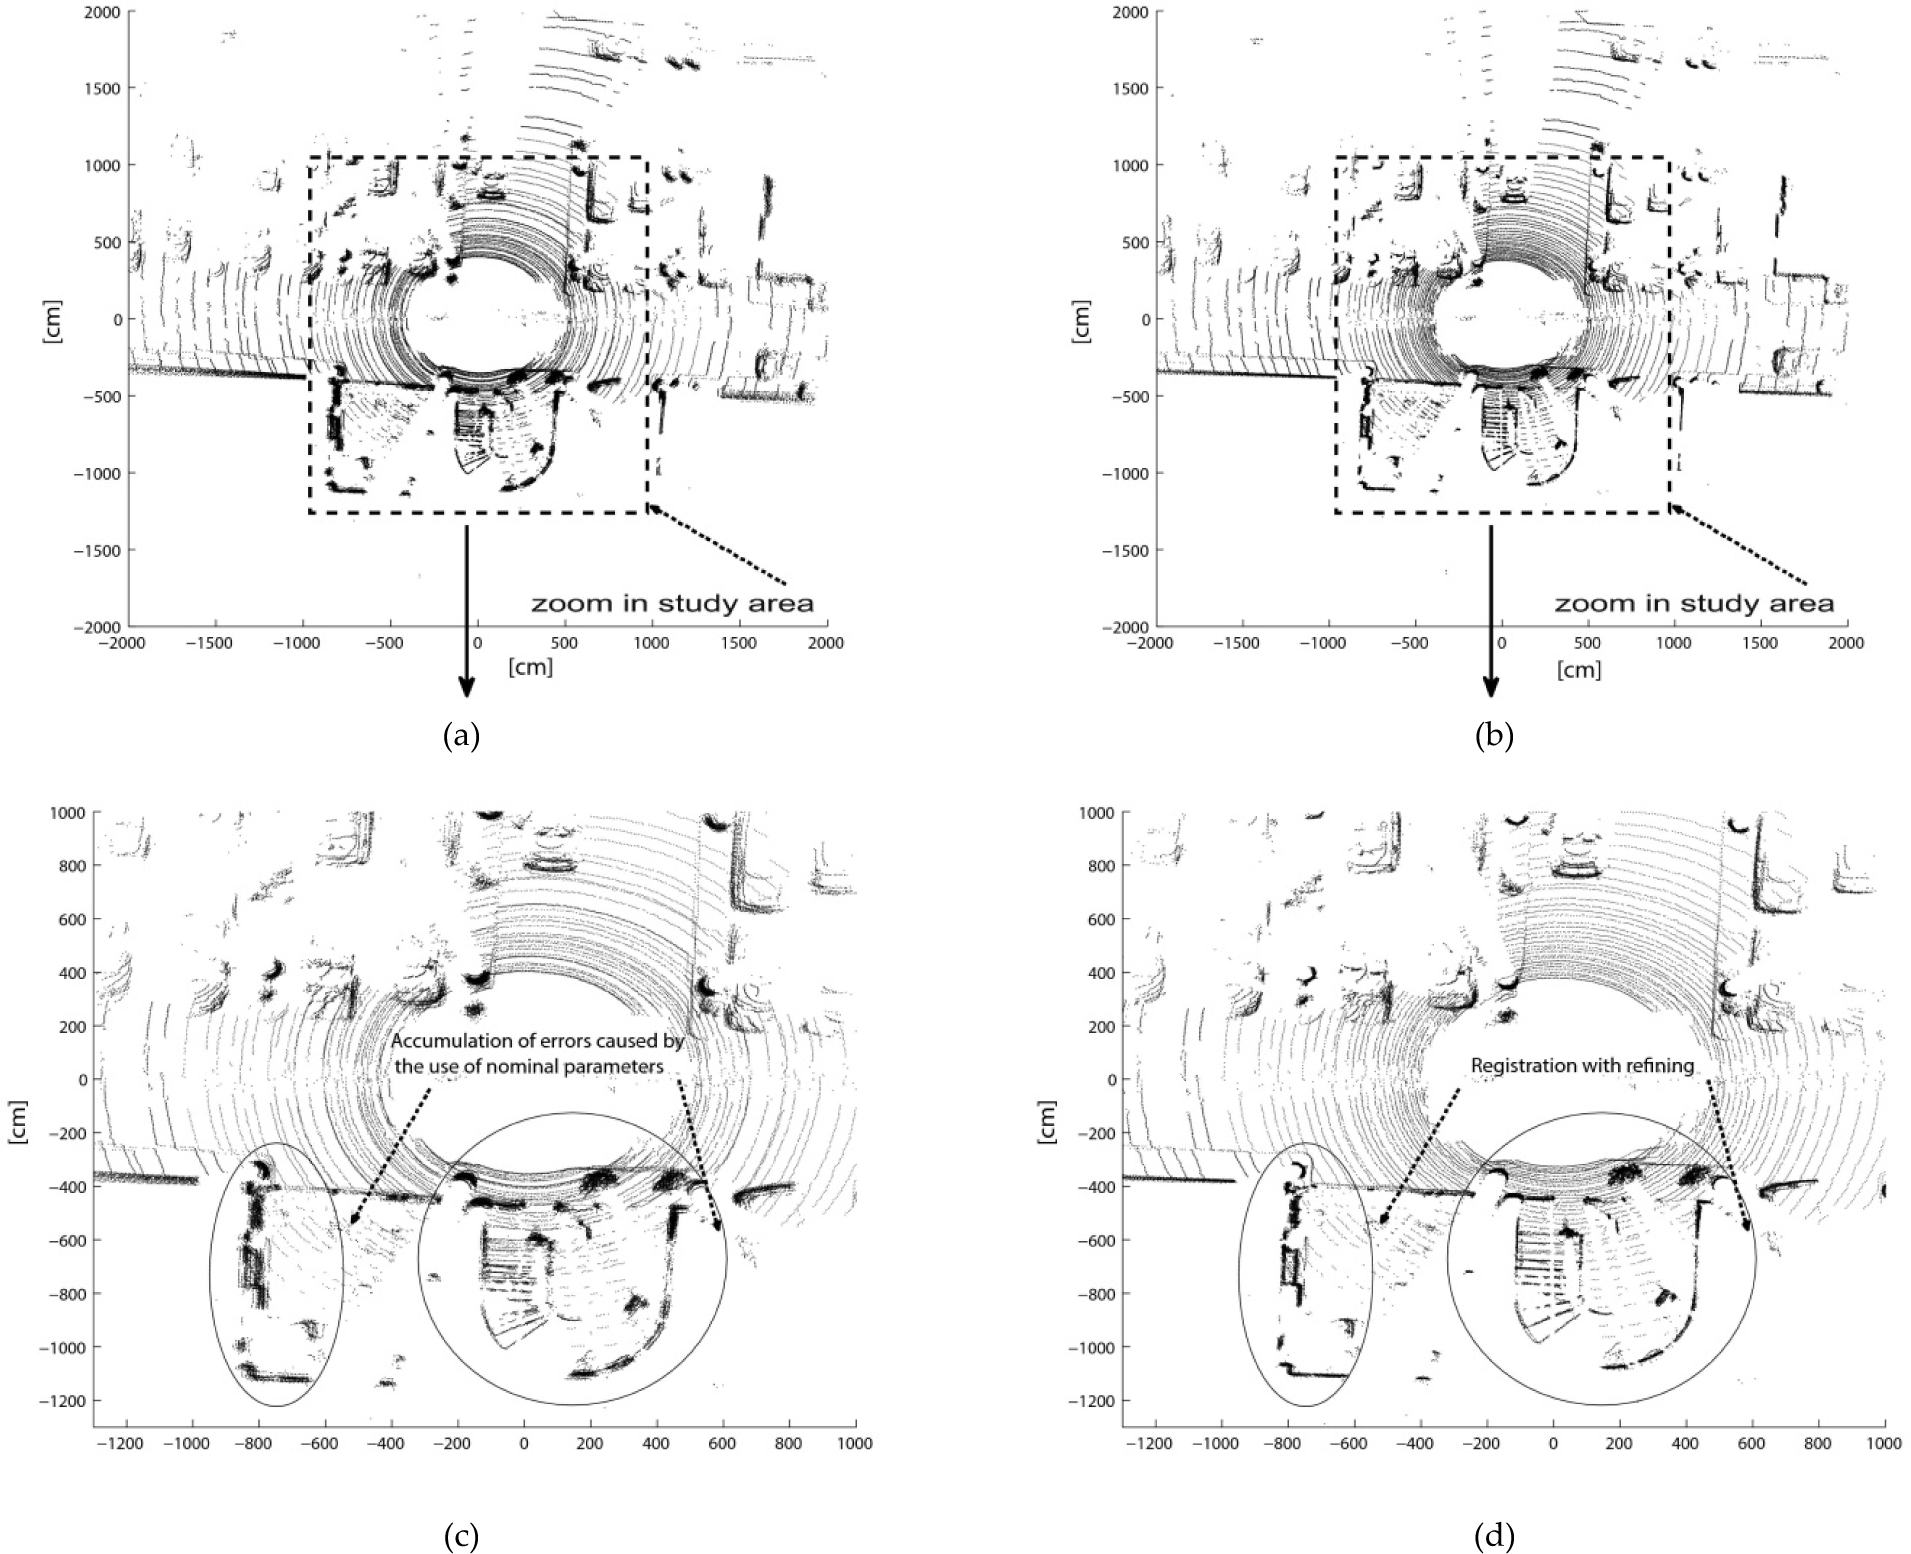
A registration of laser range profiles. (a) and (c) Uses the nominal parameters without refining. (b) and (d) The intrinsic parameters are computed by applying the methodology proposed in this article.
In [19] random numbers wee used to simulate many synthetic data sets. The synthetic data set represents the noise of the calibration pattern and they were used to recalculate the parameters of the LIDAR 200 as many as 200 times to compute its uncertainty from the standard deviation. The procedure for evaluating the uncertainty of the LIDAR parameters were to add noise to ideal coordinates of the reference points for each data acquisition. The noise consists of random numbers with normal probability distribution, zero mean and standard deviation equal to the difference between ideal and real coordinates of the points of reference. The uncertainty results are shown in Fig. 21.

Uncertainty of intrinsic parameters. The uncertainty values reported are in the range if 1σ, which correspond to a confidence level of 95%. (a) Uncertainty values of ds i ,(h OSC ) i and (v OSC ) i . (b) The uncertainty values of θ i and ϕ i .
A method for fully automated calibration of the Velodyne HDL-64E Mobile Scanning System, as applied to terrain modeling has been presented. The system uses laser range scanners, mounted on a mobile platform to quickly digitize 3D models of real world environments. This scanning system can acquire 3D data in real time while it traverses a long terrain, and processes the data online to obtain a 3D model. However, its nominal accuracy is approximately 22.54cm (Applying the calibration procedure of the Velodyne company). This error is too great for the 3D reconstruction of a historic building. The results presented showed that the mathematical model and the numerical algorithm for computing the calibration parameters of the LIDAR system is capable of scanning both, terrain and surrounding buildings, with a pre-determined level of precision of approximately 1.56cm. The experiments showed that the proposed calibration method can minimize the reconstruction error thus it is appropriate for developing models for use in simulation, dynamic testing, and building reconstruction.
Footnotes
6.
1Would like to express his gratitude to the DGEST-PROMEP-Instituto Tecnológico de Querétaro for its financial support. This work was supported partially by CONACYT grants CB-2005-01-51004 and SIP-IPN grant 20101726. The authors would also like to thank Silvia C. Stroet and Oscar Cejudo Hernández for editing the English content of this document.