
Abstract
Of the range of wireless communication technologies, wireless sensor networks (WSN) will be one of the most appropriate technologies for the Microgrid and Grid-enabled Vehicles in the Smartgrid. To ensure the security of WSN, the detection of attacks is more efficient than their prevention because of the lack of computing power. Malicious packet drops are the easiest means of attacking WSNs. Thus, the sensors used for constructing a WSN require a packet drop monitoring agent, such as Watchdog. However, Watchdog has a partial drop problem such that an attacker can manipulate the packet dropping rate below the minimum misbehaviour monitoring threshold. Furthermore, Watchdog does not consider real traffic situations, such as congestion and collision, and so it has no way of recognizing whether a packet drop is due to a real attack or network congestion. In this paper, we propose a malicious packet drop monitoring agent, which considers traffic conditions. We used the actual traffic volume on neighbouring nodes and the drop rate while monitoring a sending node for specific period. It is more effective in real network scenarios because unlike Watchdog it considers the actual traffic, which only uses the Pathrater. Moreover, our proposed method does not require authentication, packet encryption or detection packets. Thus, there is a lower likelihood of detection failure due to packet spoofing, Man-In-the Middle attacks or Wormhole attacks. To test the suitability of our proposed concept for a series of network scenarios, we divided the simulations into three types: one attack node, more than one attack nodes and no attack nodes. The results of the simulations meet our expectations.
1. Introduction
The Smartgrid is an intelligent electric grid which is characterized by a bidirectional flow of information and electricity. It can provide customers with more electricity usage choices and it has the following features: self-healing after disturbances, physical attacks, cyber attacks, and natural disasters; linkage with a wide array of energy sources, including energy produced by power plants and renewable energy producers; better power quality; and the more efficient delivery of electricity [1]. The numerous advantages of the Smartgrid mean that many countries have developed their own Smartgrid infrastructure where the test bed has been managed at the national level during the past decade.
The Smartgrid is currently in the final stages of its first step - i.e., infrastructure development - while its research and development is moving on to a more practical application perspective known as ‘next Smartgrid' or ‘Smartgrid 2.0.' Energy-related forums such as OpenAdr (http://www.openadr.org) categorize Smartgrid 2.0 research topics according to five types.
Distribution Automation
Data Analytics
Demand Response
Carbon Management
Microgrid Management and GEV (Grid-enabled Vehicle)
These topics are the core business models for companies and core research topics for future researchers into Smartgrid 2.0. In particular, research into the Microgrid and GEV component is expected to grow faster than the other topics because it is a user-centric field rather than an infrastructure-centric field.
The Microgrid and GEV are composed of many devices and operate automatically with minimal human intervention. To facilitate this, the Microgrid and GEV exploit a Wireless Sensor Network (WSN). The Microgrid and GEV use many different types of sensors for monitoring and reporting operating conditions to a control centre or control unit. These sensors are connected via a wireless network, i.e., the WSN. These sensors are tiny devices that are powered by batteries; they have limited computational capabilities. These limitations make it difficult to adapt security mechanisms to WSN. Another characteristic of WSN is that the sensors are fixed in specific locations. The Microgrid is not always a government facility - such as a power plant or Smartgrid substation - because it may be installed in a school, a company building or even normal family houses. These fixed sensors make it easy for an attacker to access the system. GEVs are moving machines and they can be parked anywhere, but they have the same problem.
Attackers can exploit sensor devices by replacing them with a modified device during attacks. However, the simplest attack mode is the forced dropping of packets. It prevents the transmission of a received packet to the next node on the routing path. If the attacked node is located at an important spot for routing, this can cause an obstacle for overall network communication.
A Watchdog has been developed to detect a packet dropping attack, but it generates many false positive and false negative errors because it does not consider the actual traffic volume for each node and it suffers from a fixed threshold problem.
In this paper, we suggest a novel packet drop monitoring scheme for a WSN on the Microgrid and GEV which considers the actual traffic volume without a fixed threshold.
2. Related Work
2.1. Wireless Sensor Network
WSNs contain numerous spatially distributed small sensors for monitoring physical or environmental conditions, such as temperature, sound, vibration, pressure, humidity, motion and pollutant levels. They cooperatively pass data through the network to a server.
WSNs have several differences from an ad hoc network. First, the sensors used by WSNs have limited capabilities, such as a short transfer range, low computing power and low battery capacity, which contrasts with the devices used to construct an ad hoc network, such as a laptop or PDA. Second, ad hoc networks support bidirectional communication between nodes, whereas the destination of most of the data in a WSN is the base station (a type of server used for collecting data). Intermediate nodes between a source node and a base station in a WSN can only relay packets to the next nodes. Third, sensors are generally fixed to a specific location. Thus, WSN sensors have limited capabilities because they are fixed to a specific location, where these nodes send data measurement to a base station at regular periods.
We can define the two types of WSN traffic based on their characteristics and restrictions.
Many-to-one: many nodes send normal data traffic to one node (base station or gateway) when an event occurs.
One-to-many: one node (base station or gateway) sends control data traffic to many nodes when an event occurs.
2.2. Microgrid and GEV WSNs
The Microgrid uses several different wireless data communication technologies, including Wi-Fi, WiMax and ZigBee. ZigBee is a type of WSN, which is a representative communication technology used by the Microgrid. ZigBee is a short-rage wireless communication standard that is used mainly by ubiquitous home networks. ZigBee is widely used for robot control, sensor networks and embedded systems. It is also well-suited to the Smartgrid because of its key features, i.e., it is small, cheap and easy to use. The ZigBee Alliance developed a ZigBee guide for the Smartgrid, i.e., SEP (Smart Energy Profile) 2.0. ZigBee is already used by many Smartgrid components such as the AMI meter, IHD (In Home Display) and DCU (Data Control Unit). The range of applications available on the Microgrid will increase as the Smartgrid is increasingly commercialized. Figure 1 shows an example of a distributed control model for the Microgrid based on the installation of ZigBee agents for each Microgrid component which communicate the collected data.
WSN technology is also used by the GEV environment in addition to the Microgrid. The GEV environment uses WSN and it is classified as 'internal communication within a vehicle' or 'communication between a vehicle and infrastructure.' In recent years, the increasing number of sensors and ECUs found in a vehicle means that more studies have been conducted of wireless connections via WSN so as to reduce cost and complexity. A group at Carnegie Mellon University has demonstrated the effectiveness of a test bed for constructing an Intra-Car WSN using 'Ultra High Frequency Radio Frequency IDentification (UHF RFID)' and 'IEEE 802.15.4' technologies. Indeed, wireless technology is already used to sense the tire pressure and inform users [2].
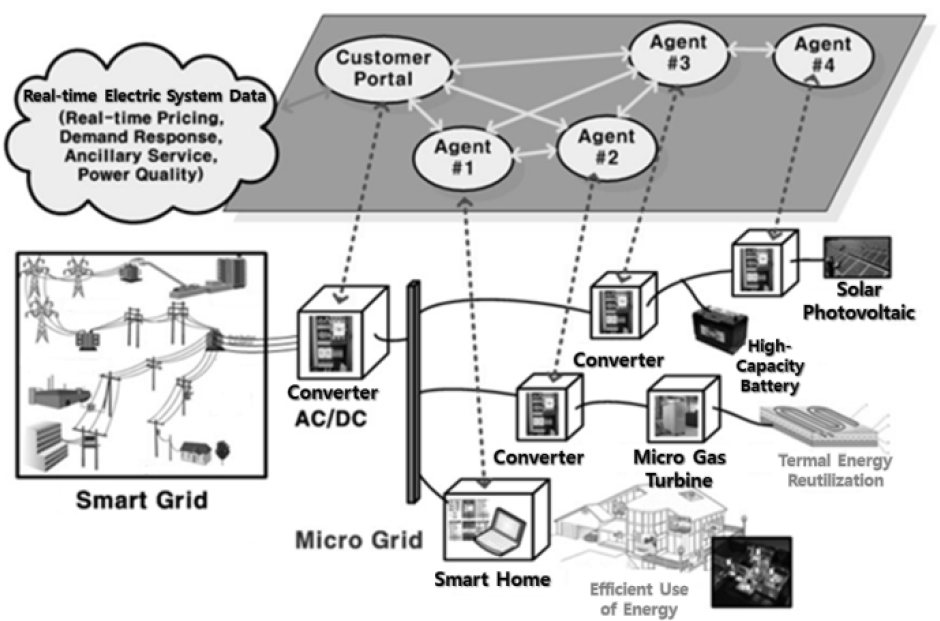
Distributed Microgrid control model based on ZigBee agents

Application of WSN in a car
WSN technology is also used for communication among vehicles and infrastructure (V2I). For example, vehicle information such as the battery status can be collected wirelessly to facilitate the charging process or to improve vehicle status monitoring systems. Various wireless communication technologies can be employed for such applications, including 3G cellular, Mesh, IEEE 802.11 family and ZigBee [3].

Vehicle grid communication
2.2.1. WSN Security on
The use of a wireless environment means that a WSN inherits known security problems from a wireless network (WLAN, ad hoc or MANET). Unlike a typical wireless network, WSNs require no user intervention to operate a sensor. The sensors operate automatically, without any human intervention, and they are located in an unobserved position. Thus, an attacker can remove a specific sensor and replace it with his own modified sensor during the next step of hacking. Thus, WSNs need to consider both network security and physical security simultaneously [4].
WSN sensor devices have limited capacities for employing the security techniques used by a typical wireless network. Thus, many different types of novel security technology have been developed for WSN or else converted from established methods [4][5].
These security techniques can be divided into ‘prevention' and ‘detection.'
Prevention techniques
The goal of prevention techniques is to prevent unauthenticated attackers from forging or falsifying packets after eavesdropping by adapting security techniques such as authentication, protocol protection, and VPN tunnelling. These types of techniques are based on cryptography and symmetric or asymmetric key management schemes. However, the limited capacity problem of WSN sensors makes these methods unsuitable. To address this problem, novel key management schemes have been developed such as SPIN (SNEP & μTesla) [6] and TinySec [7].
Detection techniques
The goal of detection techniques is to detect unauthorized or unusual behaviour in a network. In general, IDS (Intrusion Detection System) and node monitoring techniques are used for detection [8] [9] [10] [11].
WSN security studies have focused on detection techniques rather than prevention techniques, because of the limitations of sensors.
2.3. Watchdog
Watchdog [10] is a representative agent, which is used to monitor packet transmission to neighbouring nodes in an ad hoc network. Watchdog saves packets using a Watchdog monitoring buffer before packet transmission in order to monitor packets relaying from a neighbouring node to the next node.

Example of Watchdog
Figure 4 shows an example of watchdog. ‘S' is the sender node and ‘D' is the destination node (base station), while the other nodes are intermediate nodes in the route. When node ‘A' receives a packet from his neighbouring node sender ‘A', ‘A' relays the packet to its neighbour on the route to the destination. Before transmission, the Watchdog agent module of node ‘A' saves the packet on its Watchdog monitoring buffer. After packet transmission to node ‘B', ‘A' waits to check that the packet relays from its neighbouring node ‘B' to the next node ‘C' on the route. When node ‘B' retransmits the packet received from node ‘A' to the next node ‘C', node ‘A' also receives the packet because ‘A' is also within the transmission range of node ‘B'. Thus, node ‘A' compares the packet received from node ‘B' with that saved by the Watchdog monitoring buffer. If the packet is not the same or if it is not transmitted within the time period defined by node ‘B', the Watchdog on node ‘A' changes the confidence level of node ‘B'. The initial level is 0.5 and the level is reduced by 0.05 if a drop or change in a packet is detected. When the node level falls to 0.0, the Watchdog decides it is an attacker and reports it to the network administrator. If the node transmits a packet normally without any problem, Watchdog increases the rate by 0.01 every 200 ms. The Watchdog rating mechanism is known as Pathrater.
2.3.1. Problems with Watchdog
A common security problem with wireless networks is that is easy to acquire a packet from the network and use it for a direct or indirect attack by forging or falsification. These problems are exploited by almost every type of attack. With WSN, however, the packet types are limited to specific information depending on the purpose of the network. The number of one-hop neighbours is also high because of the sensor transmission range. Hence, we can easily detect an unusual node that has dropped a packet if the Watchdog agent is used in the sensor. However, some patterns cannot be detected by Watchdog on WSNs. These can be classified into four types.
Partial dropping
If the attacker knows the minimum misbehaviour threshold (the Pathrater used by Watchdog) and if they can manipulate the packet dropping rate, it becomes difficult to detect the misbehaving node.
Intentional packet collision on the receiver side
Suppose that the attacker node ‘B' transmits a packet as normal to the neighbouring node ‘C'. If a packet collision occurs on node ‘C' because of a packet from node ‘D' when node ‘C' receives a packet from node ‘B' simultaneously, node ‘B' needs to transmit the packet again. However, if the attacker ignores the situation and simply drops the packet, this event cannot be detected by Watchdog when monitoring node ‘A'.

Packet collision on the receiver side
False misbehaviour accusations
If the attacker reports a false alarm intentionally to the monitoring node or base station, it will not be possible to confirm whether the report is true.
Modified transmission power
If the attack only modifies the transmission range that is received by the monitoring node, the Watchdog on the monitoring node will decide that the attacker is a normal node.

Intentional modification of the transmission power
Determining a fault using power-aware routing
Power-aware routing schemes [12] [13] [14] only optimize the transmission power that can be received by the next node on the routing path. If these types of schemes are used, Watchdog might decide that a normal node is an attacker.
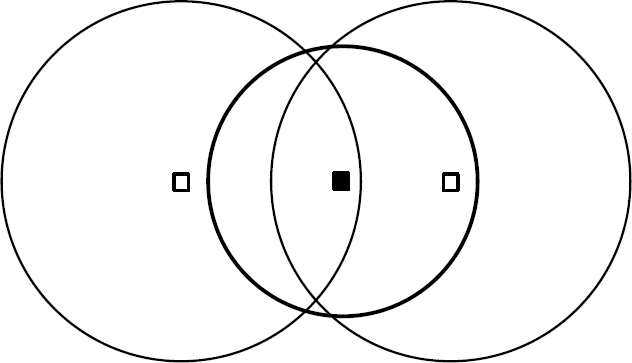
If more than two nodes can cooperate to avoid detection, it is difficult to identify the attacker. Figure 8 shows the cooperation of node ‘C' and node ‘D' to avoid packet dropping detection by node ‘A'. In this case, node ‘B' does not report the misbehaviour of node ‘C' to the base station.

Two nodes cooperating to avoid packet dropping detection
3. A novel monitoring agent scheme
There are many improved and converted versions of Watchdog for WSN [15][16][17]. However, all of these methods inherit problems from Watchdog because they only focus on the energy consumption by sensors. The objective of this study was to mitigate one of Watchdog's problems (i.e., the partial dropping problem caused by setting a fixed threshold). To address this problem, we suggest that a fixed packet drop threshold not be used for detecting attack nodes, and instead we collect the drop-rate from neighbouring nodes based on the actual traffic volume so as to dynamically detect malicious nodes.
The method of packet drop monitoring with consideration for traffic is based on traffic and packet drop rate information that is captured simultaneously from neighbouring nodes with a one-hop distance. A node with concentrated network traffic may experience unavoidable packet drop with a packet drop rate that is higher than other neighbouring nodes. Therefore, existing methods that identify an attacker without considering the traffic - such as Watchdog - are inefficient and make it difficult to determine whether a packet drop is due to a real attack or network congestion. Thus, the method proposed in this paper aims to improve pre-existing methods. We exploit Watchdog's determination of a packet drop by a node using Pathrater, which employs a confidential grade to dynamically determine the attack node by considering the traffic of one-hop neighbours.
3.1. Assumptions
The assumptions used in this paper are as follows:
All sensor nodes lack mobility.
All sensor nodes need to know the nodes that are within their transmission range.
All sensor nodes within a network need to have the same transmission range, except the base station.
All sensor nodes use flooding for routing and transferring.
3.2. The proposed concept
The concept proposed in this paper is based on capturing packets sent by neighbouring nodes in the transmission range, which is a characteristic of wireless networks that use broadcasting.
All nodes in the network collect information from their neighbouring nodes in the transmission range for a specific time T. The information that needs to be collected belongs to two types, as follows:
WL i : The total number of packets transmitted from a neighbouring node i.
AWL: The average packet transmission by neighbouring nodes.
DR i : The packet drop rate of a neighbouring node i for packets sent from the focal node.
ADR: The average packet drop rate for all neighbouring nodes.
DEV i : ADR - DR i
Dn: ADR / 2
WL i is the number of packets broadcast by a neighbouring node during a specific time period T. Packets are transmitted by broadcasting, so we can count the total number of packets sent during time T by simply checking the source node of the packet.
DR i The packet drop rate of a neighbouring node i for packets sent from the focal node. We use the same method for determining the rate as that employed by Watchdog.
Figure 9 illustrates our proposed method. Node S collects information from the neighbouring nodes A, B, C, D and E, which are within its transmission range.
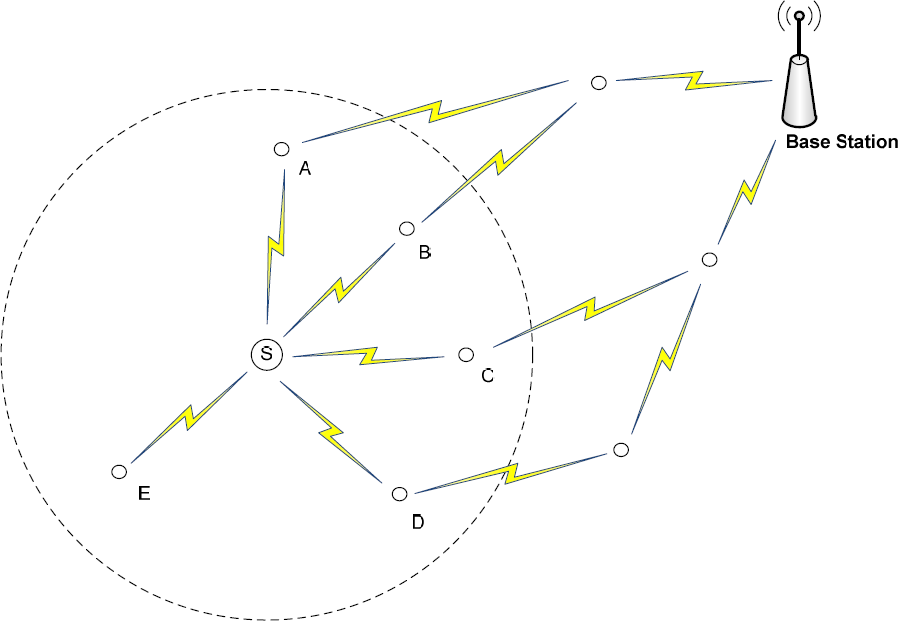
Illustration of the proposed concept
Based on the information collected, node S communicates with its neighbours to determine whether they are normal or malicious nodes.
Suppose that WL i and DR i , shown in Figure 9, are parameterized according to Table 1.
Measured sample values

The sample values shown in Table 1 are extreme values that have been selected intentionally to simplify our understanding. We assume that node A is an attack node and the ADR (average packet drop rate) shown in Table 2 is 40.4%. In general, WSN sensors send data periodically or else when a predetermined condition is triggered. Therefore, the traffic and packet drop rate caused by the broadcasts from nodes should remain similar to the average for the normal state of affairs. Thus, the DEV i of each node would remain at a certain level. However, if the malicious node has a small difference of DR i for the ADR in the transmission range of the monitoring node, it is not easy to detect a malicious node simply by comparing this with the ADR and DR i of the malicious node.
Thus, our proposed scheme uses several steps. We check the ADR and then calculate the DEV i for each node before sending a packet from the monitoring node to each neighbouring node. Next, we sort them in descending order and classify the suspicious and normal packets. We then determine the total number of packet transmissions by neighbouring nodes in order to detect the malicious nodes.
DEV i sorted in descending order

Table 2 shows the DEV i sorted into descending order. Compared with ADR, we can see that Node C in Table 3 had the lowest packet drop rate, whereas Node A had the highest packet drop rate. To determine the malicious node we need to calculate the value of Dn (Average packet drop rate / 2). We use Dn because an attack node might be among those nodes with a lower than average drop rate. It makes the detection range of the packet drop rate more broad and precise. If one node has a higher DEV i value than Dn, that node is considered to have a lower packet drop rate than other neighbouring nodes. Thus, they would be considered normal nodes. However, if the nodes with a DEV i value lower than Dn are considered, which have a higher drop rate than other neighbouring nodes, we assume that they are attack nodes. In Table 2, we assume that Dn is 20.2, and nodes B, E, D and A are suspicious nodes where DEV i > Dn for i = B, E, D, A.
Table 3 shows the DEV i difference for each suspicious node. Based on these differences, the nodes on the right side of the node with the highest DEV i difference are considered as more likely to be attack nodes. This is because they have a higher difference in the packet drop rate compared with suspicious nodes. In Table 3, node A had the highest value, so it was determined to be a malicious node.
DEV i difference for each suspicious node


Finally, to determine whether a node dropped packets intentionally or whether they were attributable to an actual traffic problem, we calculated the AWL (average of packet transmission by neighbouring nodes). In Table 1, the AWL value is 224. The total number of packets broadcast by a malicious node A during a specific time T was 100 and we compare it with the AWL value of 224. Although node A broadcast 100 packets, this was lower than the average number of packets, so it had a high packet drop rate. Thus, monitoring node S determined that node A was the final malicious packet drop node and an alarm message was sent to the base station.
A flow chart of our proposed concept is shown in Figure 10.

Flow chart of our proposed concept
4. Analysis of our proposed concept
In this section, we will test the suitability of our proposed concept for a series of network scenarios. In the simulation, we set all of the nodes to transmit a maximum of 300 packets in 3 minutes, while each node had a maximum 80% random drop rate for a packet sent from a monitoring node. We experimented by changing the total number of nodes and the number of attack nodes. We did not consider packet drops caused by external attacks, such as DoS (Denial of Service) attacks. We divided the simulations into three types: one attack node, more than one attack node, and no attack nodes. Simulations that depended on the total number of nodes produced similar results, so we will describe three cases where the total number of nodes was 10.
4.1. One attack node
We set up node 0 as an intentionally malicious node and randomly set the rest of the traffic and the drop rate. The WL i (number of total broadcasts) had the main effect on detection, so we set the range of WL i as significantly different for the attack node and node 0, while WL i = 0 and DR i = 80%. The range and results for the WL i and DR i of the other nodes was as follows:
200 ≤ WL i ≤ 300
0 ≤ DR i ≤ 80
Simulation results with one attack node

The AWL, ADR and Dn for the above were as follows:
AWL = 243.9
ADR = 38.3%
Dn = 19.15%
Based on our proposed concept, the final results were as follows:
DEV i difference for each suspicious node with one attack node


Based on Dn, we found that nodes 8, 2, 6, 4, 7 and 0 had a DEV i that was lower than Dn during the first phase. We also found that nodes 8 and 2 had a lower than average packet drop rate. This showed that our proposed concept could detect an attacker with a packet drop rate that is similar to the average.
During the second phase, the highest DEV i difference in Table 5 was 22, while nodes 6, 4, 7 and 0 were suspicious nodes. The WL i (total traffic) of node 0 was less than the AWL (average total traffic), so we finally determined that node 0 was the malicious node.
4.2. More than one attack node
We set up malicious attack nodes and set the remaining nodes with random traffic and packet drop rates. The attack node was node 0 while WL i = 20 and DR i = 80%. In the ideal simulation, we set the minimum traffic rate as 50. The range and results for WL i and the DR i of the remaining nodes were as follows:
50 ≤ WL i ≤ 300
0 ≤ DR i ≤ 80
Simulation results with more than one attack node

The AWL, ADR and Dn for the above were as follows:
AWL = 144.8
ADR = 39.2%
Dn = 19.6%
Based on the proposed concept, the final results were as follows:
DEV i difference for each suspicious node with more than one attack node


The highest DEV i difference in Table 7 was 13. We can see that a value of 13 was obtained twice, so the value nearest to Dn was selected. The final detected malicious nodes were 1, 4 and 0, which had lower than average actual traffic.
4.3. No attack nodes
We randomly specified the traffic and packet drop rate for all of the nodes. With a narrow WL i range, all the nodes could broadcast at a similar level in the network. The range and results of WL i and DR i for each node were as follows:
230 ≤ WL i ≤ 300
0 ≤ DR i ≤ 80
Simulation results with no attack nodes

The AWL, ADR and Dn from above were as follows:
AWL: 263.3
ADR: 31.9%
Dn: 15.95%
By the proposed idea, the final data sheet is as follows:
DEV i difference for each suspicious node with no attack nodes


The highest DEV i difference in Table 9 was 31.2. Thus, nodes 1, 6 and 2 were suspicious nodes. However, we could determine which nodes were normal, because there no nodes had traffic rate that was lower than the average AWL of 263.3.
4.4. Advantages and restrictions
The method proposed in this paper has the following advantages:
It is more effective in real network scenarios because it considers the actual traffic rather than Watchdog, which only uses the Pathrate.
Our proposed method does not require authentication, packet encryption or detection packets.
There is a lower likelihood of detection failure due to packet spoofing, Man-In-the Middle attacks or Wormhole attacks.
The Watchdog method cannot recognize intentional packet drops and it risks malfunction because it only uses the Pathrate of the monitored node. We considered a real traffic situation and packet drop rate and our method delivered more precise detection. There was also a lower likelihood of malfunction due to packet spoofing, Man-In-the Middle attacks and wormhole attacks, because our method does not require a control message for the initialization of detection.
However, our method also had limitations:
Only flooding can be used as the routing protocol.
The method requires at least three neighbours.
Our proposed method uses the number of all packets broadcast by neighbour nodes and the packet drop rate of neighbouring nodes in the packet transmission range of the monitoring node. However, routing protocols such as DSR (Dynamic Source Routing) [18] and AODV (ad hoc On-demand Distance Vector) [19], drop packets when they do not follow an optimized path to their destination node (this is the base station in a sensor network). It is difficult to apply such routing protocols in a network because the method we proposed requires an assumption that the packets received by all of the nodes in a network simply need to send packets to a base station via simple flooding.
5. Conclusion and Future Studies
The Smartgrid is no longer a future technology and it will soon be a part of our everyday life. The Microgrid and GEV are the hottest topics of the future Smartgrid, which uses a variety of wireless data communication technologies. WSN will become one of the most important wireless technologies because of its key features and its suitability for the Microgrid and GEV.
Existing security technologies are difficult to apply in WSN because of certain conditions. Therefore, attack detection is more important than attack prevention, which requires high computational power. Monitoring neighbouring nodes is the most appropriate security method, along with IDS (Intrusion Detection System). Many monitoring methods are based on the Watchdog method for ad hoc networks. However, they suffer from high energy consumption, which is an inherited security problem of Watchdog.
This paper proposed a malicious packet dropping monitoring method which considers traffic conditions. We used the actual traffic volume of neighbouring nodes and the drop-rate of the focal monitoring node for a specific period of time.
However, there are certain limitations with our proposed method. We did not consider the participation of new sensor nodes and it was difficult to apply in a network with any routing protocol other than flooding. Thus, our method has the drawback of high energy consumption due to duplication by packet re-transmission. Therefore, we need to develop an efficient network design and a method that considers energy based on a routing protocol. We leave this for future research.
Footnotes
8. Acknowledgments
This work was supported by the new faculty research fund of Ajou University.