
Abstract
This paper presents the process of measuring the level of quality control process to ensure the quality of delivered software package during the development cycle. The success of the project requires three pre-requisites and they constrain one another. Quality is the most important factor for successful project completion. In other words, quality should not be sacrificed for the sake of meeting cost budget or delivering within schedule. Also, cost caused by any quality issues such as defect resolution increases exponentially once the product is out of the door. Having said that, we also have to consider the schedule side of constraints for the successful project. In other words, we have no time to do a quality job and we have to compete with other competitors to ship the product to the market earlier than them. So, the quality measurement and management concept is introduced to meet the agile software development environment in conjunction with performance strategies to execute within organization. Obviously, there are many key performance indexes derivable from the actual data associated with quality control activities and it is desirable to create a quality process to integrally represent overall level of quality control activities performed while developing the software deliverables. With the quality process, it is possible to evaluate whether enough quality control activities are performed for the project officially and secure the quality of the software deliverables before it is delivered to the customers.
1. Introduction
Generally, quality takes one side of the project triangle, along with schedule and cost [5]. In other words, quality is one of the important constraints of successful project completion. It does not go too far if we say that quality cannot be sacrificed for the sake of meeting cost budget or delivering within schedule [4,12,15].
To secure the quality of the produce from the project, it is necessary to keep monitoring the level of quality activities conducted while executing projects [2, 3]. There are fourteen quality metrics used across global leading companies, but we call it software quality metrics and this term will be used from now on. Software quality metrics are measurements of some properties of a piece of information regarding quality activities conducted during the software development cycle. Since quantitative methods have proven so powerful in the other sciences [6,7], computer science practitioners and theoreticians have worked hard to bring similar approaches to software development. Tom DeMarco stated, “You cannot control what you can't measure” [1,11,13].
The quality control process has two properties; we have a contradiction between quality vs. schedule.
Unfortunately, we have to meet both criteria. In order to meet both criteria to achieve successful projects, a quality control process was developed and utilized. It looks at the project performance from two perspectives: project and business.
2. Basic Studies
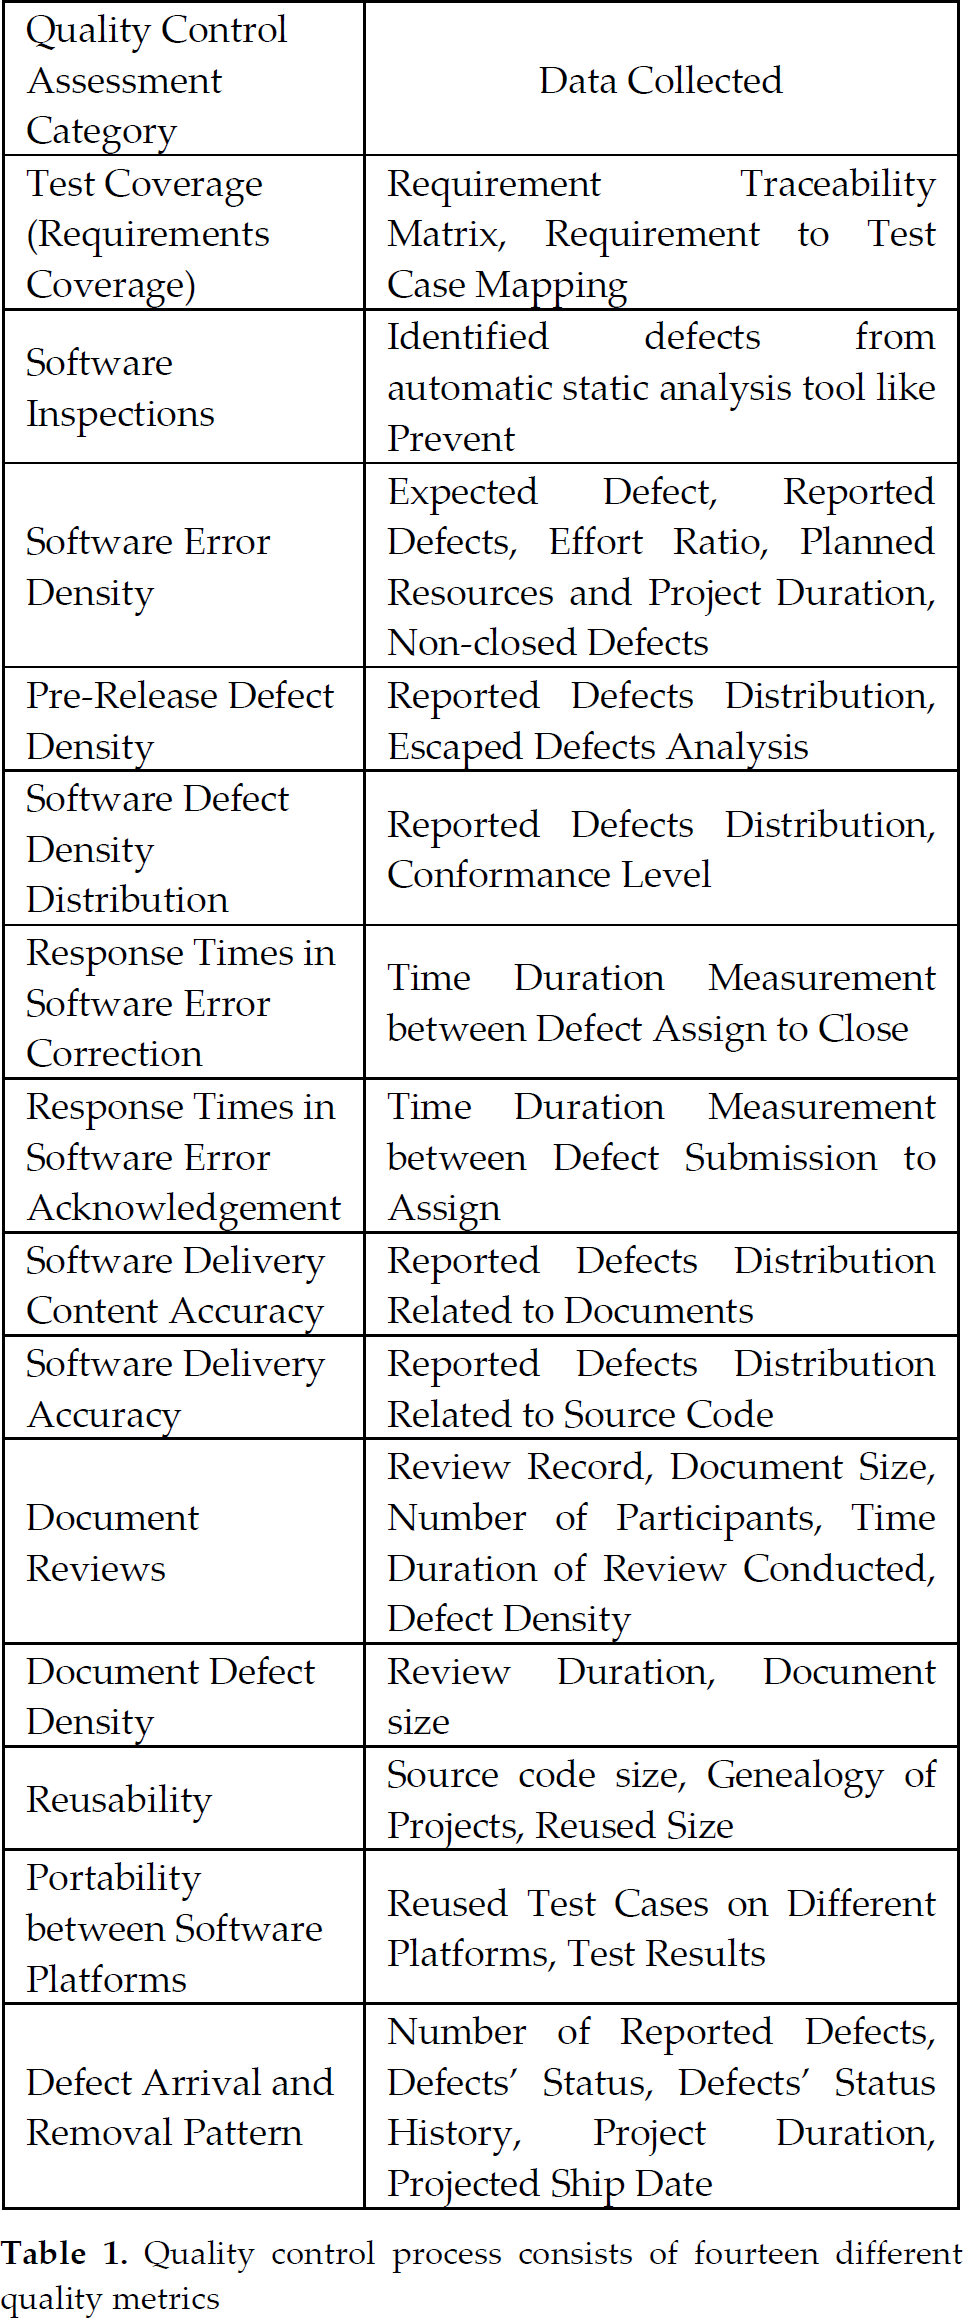
Before presenting the main topic, we will discuss three categories as a basis for the study: quality metrics, the analytical hierarchical process and metrics. Generally, there are fourteen quality metrics used widely across the world to monitor quality control activities [7]. The quality control process consists of fourteen different quality metrics. The table below shows the quality metrics and its necessary associated data.
2.2. Analytical Hierarchical Process (AHP)
The AHP was developed by Thomas L. Saaty in 1980 and is designed to solve complex problems involving multiple criteria [4]. A judgment is made about the relative importance of each criterion and then specifies decision alternatives on each criterion. This methodology is utilized to weight every quality metrics according to its importance and derive overall assessment as a quality process [10,12,15].
When we make a decision, it is recognized that there are many parts that are based on “feelings” and these are difficult to quantify. In such a situation a method to quantify and choose a good method for selection is better, using abstract assessment and the greatest common divisor (G.C.D.) [13].
Quality control process consists of fourteen different quality metrics
3. Quality Control Process
Almost three-quarters of major corporations have used the concept of business process because of its scalable assessment for strategic performance management [9]. For that reason we want to assess the performance of overall quality control conducted through the process to identify and improve weaknesses of the development process to deliver better quality software products.
3.1. Score Value for Each Quality Metric
The next chapter will present how to assess the performance and score the effort correspondingly.
3.1.1. Test Coverage (Requirements Coverage)
Score value for this metric can be used transparently by following its formula to measure the comprehensiveness of test cases utilizing automated systems like DOORS and Requirement Traceability Matrix.
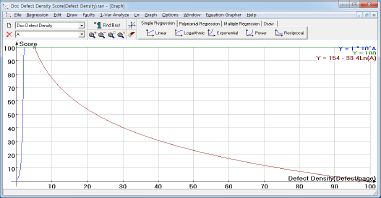
3.1.2. Software Error Density
In order to score the software error density metric, its formula can be simply used to derive score value after counting the total number defects recorded in a defect management system such as ClearQuest with source property key values tagged.

Where, Effort is the effort index to represent the performance of detecting defects and Density is the defect density that is not closed. Again, Effort can be obtained from the following formula,

Where, “ActualDefects” is the number of defects found during the development and “ExpectedDefects” is the number of defects that are estimated for the project. Therefore, the closer the actual defects to the expected defects, the closer the score to 50. The reason why 50 is multiplied is that the Effort factor contributes half of the total score for this metric.
In order to estimate expected defects for the project, the following formula will be used,

Here, 0.05 is used because empirical data shows that 0.05 defects are susceptible to be injected by every person-hour working.
On the other hand, “Density” can be obtained by the following formula,
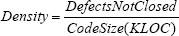
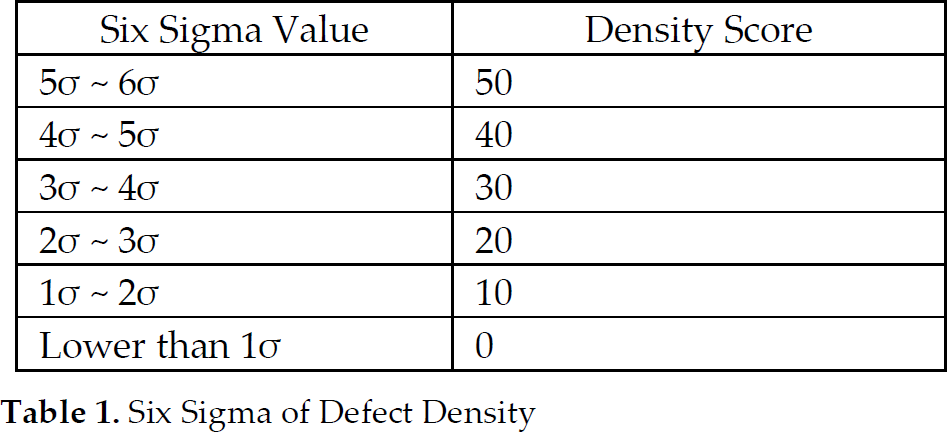
Then, the density will be re-expressed in six sigma scale and the corresponding score will be given according to the sigma value.
Six Sigma of Defect Density
3.1.3. Software Defect Density Distribution
In order to integrate this kind of metric into the quality control process, the Rayleigh curve will be used as a reference with which actual defect density in each development phase is compared. Therefore, the closer to the predicted Rayleigh curve, the higher the score will be.

To integrate this kind of metric to the quality control process, there should be some manipulations required; the main point is to measure how closely the defect density distribution follows the Rayleigh curve. In order to do that, the name of the key performance index should be changed to Software Defect Density Distribution Conformance Degree.
Here, Conformance Degree represents how closely software defect density distribution resembles the Rayleigh curve and deviation degree shows how much defect density distribution deviates from the desired defect density.
If we consolidate the conformance degree in every development phase, the formula will be as follows,

To derive overall conformance degree, the average of every conformance degree in three segments of development phases will be calculated.
Since our assumption dictates that no defects are allowed in the After-Release phase, the final score will be obtained from the average conformance percentage score subtracted by defect density in After-Release phase and can be expressed like the following formula,

3.1.4. Portability between Software Platforms
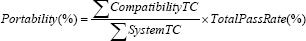
In order to convert this metrics into a quality level process, the proportion of compatibility related test cases passed will be calculated over the total system test pass rate. If translated into an equation, the score for compatibility will be expressed as follows,
3.1.5. Document Defect Density
Software engineers have experimented a lot to ascertain when it can be said that a document review is effective. The answer lies with the defect density. Experimental data has proven that document review was effective enough when defect density was recorded at 2 to 5 defects per page. Therefore, the same decision was made to adopt 2 to 5 defects per page as a reference guide to assess and assign value accordingly by the level of document review activity.
For example, if total document defects density calculated from the above equation is in the range of 2 to 5, then the score of 100 will be given. Otherwise, the score will be reduced from 100 accordingly as shown in the table below.
Defect Density Score

Quantitative Value of Assessing Document Defect Density
3.1.6. Pre-Release Defect Density
The score value for this metric can be used transparently by following its formula to measure Pre-Release defect density utilizing the ClearQuest tool to count source-code or document related defects
3.1.7. Software Delivery Accuracy – Delivered Defect Density
In order to derive quantitative value out of the metric, total defects related to source code will be obtained and the percentage of its defects distribution during the development phase and After-Release phase can be calculated. After that, score for this metric will follow the percentage of defect distribution in Pre-Release phase.

3.1.8. Software Delivery Content Accuracy
The score for this metric can be obtained by following the formula of Software Delivery Accuracy except dealing with document related defects.
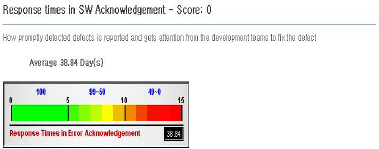
3.1.9. Response Times in Software Error Acknowledgement
Measured elapsed time for the project will be assessed against the target elapsed time set by the organization and depreciated by the number of delayed days. For example, if the organization sets a 5 day allowance as maximum error acknowledgement time, the score will be 100% if up to 5 days, 90% if delayed by 1 day, 80% for 2 days and so on. The score will be downgraded until it hits 0% and does not go below zero.
3.1.10. Response Times in Software Error Correction
The score value for this metric uses the same method used in deriving the “Response times in Software Error Acknowledgement” metric, except measuring elapsed time of defects being assigned to the state of defect resolved.

3.1.11. Software Inspections
We use automatic static analysis tools like ‘Prevent' developed by ‘Coverity Co.,' and archive reported defects to ClearQuest with filtering out defects in “false” and “intentional” category. Those defects archived in ClearQuest shall be tagged with “Prevent” to identify the defects reported from static analysis.
If there are no archived defects from Prevent, the score will be given 100%. As the portion of detected real defects increases, the total score will be decreased. In summary, the following formula will be used to calculate the score,

Note that the software inspection score can be lower than zero - a minus score. Since it is critical not to leave defects unclear at the source code inspection stage, we would like to let a minus score impact the overall quality control process.
3.1.12. Documents Reviews
In order to consolidate the score of this kind of metric into an overall quality control assessment score, the total score of the documents' review will be calculated considering the following assessments:
Whether or not a review is conducted?
How many participants are involved with the inspection?
Was the review rate appropriate? Not too fast? = Review Rate
Was the review effective to detect defects? = Defect Density
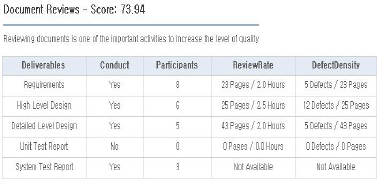
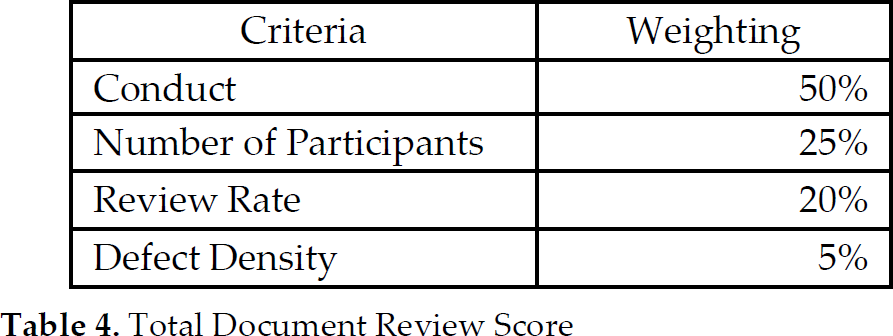
The total document review score will be calculated with weighting proportionally depending on its importance and expressed as shown in the following table.
Total Document Review Score
3.1.13. Reusability (%)
Score value for this metric can be used transparently by following its formula to measure Reusability. In order to do this, a system can be built to manage source-code by block with unique ID assigned. For a project, engineers can search and load registered block of source codes and calculate the percentage of those LOC over total LOC of a project.
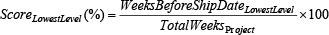
3.1.14. Defect Arrival and Removal Pattern
When we examine the pattern in depth, we can find that two aspects of quality metrics are involved; defect arrival rate and defect removal rate. T
The pattern of defect arrival would be healthier based on the following three factors: how early does defect arrival happen, how early does defect arrival reach the peak (relative to the base line), and how early a decline to a lowest level of defect arrival reach before the product shipment date? Since time interval is usually on a weekly basis, the score value after assessing the health of the defect arrival rate will be given based on three factors as stated above.
The following figure illustrates the three stated measuring factors above.
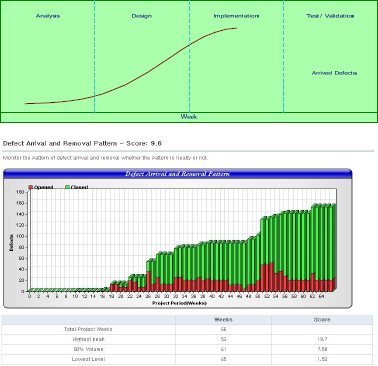
Defect Arrival and Removal Pattern
The score will be obtained from those three perspectives as stated above. Since three factors are equally important and contribute to the overall level of the metrics, the average of every score will be calculated by the following equation,

Where,


3.2. QMM (Quality Measurement and Management)
Process Generation
So far, fourteen different kinds of quality metrics were explained with deriving formula to convey the degree of quality control activities to quality metric. Now, it is time to assess the overall level of quality monitoring and control activities performed, weighting each derived quality metric proportionally, which is called the quality control process.
In order to formulize the quality control process, the Analytical Hierarchy Process [4] is used. Since every key performance index [quality metrics] related to quality control activities are equally important, pair-wise comparison was conducted and then followed by a normalization process. After that, each key performance index was weighted, observing consistency index to sustain the acceptable level of consistency in the comparison results. Mean weighting values are calculated from the Anderson-Darling Normality Test and the result was proved to be normalized.
Weighting Percentage for Each Quality Metric Score

4. Conclusions and Future Research
So far, quality metrics were developed to monitor the current quality control activities, analysing the unusual phenomena. With the detected unhealthy cases, engineers look into what the causes are and suggest what kind of activities are required to improve the quality of the delivered software product. Since each quality metric is merely observing the current situation in its own interesting area, the overall quality control level cannot be assessed.
However, adopting and utilizing the quality control process mechanism enables the organization not only to monitor the situation of the quality control in every different aspect, but also to assess the overall performance level of the quality control on every software development project. The organization can ascertain how to efficiently and effectively improve the quality of the products they deliver.
Right now, associated processes and teams are not yet established to collect field defect data, and as yet, our quality process is not complete. To increase the reliability of its assessment, we are building processes, teams and systems to collect data related to software delivery content accuracy, reusability and portability between software platforms.
All those areas are under research and development.