
Abstract
Nanostructure CaCu2.90Zn0.10Ti4O12 (CCZTO) electronic ceramic was synthesized by semi-wet route. The objective of this route is to enable the calcination and sintering processes to go for completion in shorter time and at lower temperature.***The samples were characterized by XRD, TEM, SEM and EDX analyses. The crystallite size of the CCZTO ceramic, obtained by XRD using Debye Scherrer formula, range from 38-74nm which is in good agreement with the particle size observed by TEM analysis. It was observed clearly that the grain size significantly increased with an increase in sintering duration. Dielectric measurements were carried out by LCR meter in the temperature range, 300–500K, at few selected frequencies. It was also observed that the dielectric constant and dielectric loss of CCZTO are temperature independent in higher frequency whereas temperature dependent in low frequency region. The ceramics exhibit high dielectric constant of 1.35 × 10⁴ at 1 kHz.
1. Introduction
Nanosized materials with high dielectric constant are in the focus of interest, not only for purely academic reasons but also because new high εr materials are urgently sought for the further development of modern electronics. The high dielectric constant material is desirable to miniaturize capacitor required for integerated circuit. BaTiO3 and SrTiO3 based ferroelectric materials exhibit high dielectric constant but these materials show strong temperature dependence of their dielectric constant which is not desirable from the device points of view [1–2]. On the other hand, CaCu3Ti4O12 (CCTO) ceramic has high dielectric constant (εr ∼ 104 −105) independent of frequency (102 - 106 Hz) and temperature (100-600K) which is desired for microelectronic applications [3–4]. Unfortunately, the CCTO ceramic with giant dielectric constant exhibits higher dielectric loss that limits its practical applications. It has been previously reported that the dielectric properties of CCTO are largely influenced by factors such as doping schemes [5–7] as well as stoichiometric variations [8–9]. Recently much work based on partial substitution at Cu or Ti ions site in CCTO ceramic has been carried out in order to improve the dielectric properties and to understand the origin of gaint dielectric response in CaCu3Ti4O12 ceramic [10–12]. Partial isovalent ionic substitutions of Cu by Zn or Mg in CaCu3Ti4O12 ceramic have enhanced the dielectric response due to modification of its structure [13–15]. In these cases, compared to the slight change of Cu+/Cu+2 ratio which also increases Ti+3/Ti+4 ratio, may be the primary factor for the enhanced dielectric response in CCTO ceramic. The dielectric constant (εr) and loss tangent (tanδ) of CCTO are strongly dependent upon the processing conditions such as sintering temperature [16], sintering time [17], cooling rate and partial pressure of sintering atmosphere. The traditional solid-state reaction method is usually used to prepare crystalline CCTO with starting materials, CaCO3, CuO and TiO2, in stoichiometric ratio at high temperature. The mixtures are calcined for long duration with several intermediate grindings. This procedure requires tedious work, relatively long reaction time and high temperature condition. In addition, some other secondary phases also appear during synthesis because of limited atomic diffusion through micrometer sized grains. On the other hand, the wet chemical methods provide atomic level mixing of individual components and result in the formation of nanocrystalline materials at much lower temperature compared with solid state reactions. There are many chemical methods, such as, sol-gel, co-precipitation, precursor solution technique and hydrothermal process [18–20] which have already been reported for the synthesis of CCTO ceramics. But in these chemical methods Ti is used as Ti(OR)4 which is very costly.
In the present communication we report a new successful route to synthesize nanocrystalline CCZTO by semi-wet route at low sintering temperature and short duration. In this method, the mixing process is performed in solution state as nitrate solutions along with solid TiO2 which is very cheap. This is one of the most advantages over the other methods. We also report the dielectric properties of this ceramic.
2. Experimental
Analytical grade chemicals, Ca(NO3)2.4H2O, Cu(NO3)2.3H2O, (CH3COO)2Zn.2H2O, titanium dioxide and citric acid, obtained from Merk, having purity of 99.95 % or better were used as starting materials. Standard solutions of metal nitrates were prepared using distilled water. Solutions of the metal nitrates in stoichiometric amount of these metallic ions were mixed in a beaker. Calculated amounts of TiO2 and citric acid equivalent to metal ions were added to the solution. The solution was heated on a hot plate using a magnetic stirrer at 70-90 °C to evaporate water and then dried at 100-120°C in hot air oven for 12h to yield a blue gel. The gel was calcined in air at 800°C for 6h in a muffle furnace. The resultant mixture was ground into fine powder using a pestle and mortar. Cylindrical pellets were made using hydraulic press. The pellets, sintered at 950 °C for 6 h, 8h and 12h in air, were abbrebated as CCZTO-6h, CCZTO-8h and CCZTO-12h, respectively. The densities of samples were measured by Archimedes method. The crystalline phases of the sintered samples were identified using an X-ray Diffractometer (Rich-Siefert, ID-3000) employing Cu-Kα radiation. The microstructures of the fractured surfaces were examined using a Scanning Electron Microscope (SEM, Model JEOL JSM5410). The Energy Dispersive X-ray Analyzer (EDX, Model Kevex, Sigma KS3) was used for the elemental analysis of the sintered samples. Transmissions Electron Microscopic (TEM Technai 12 G2, FEI) studies of the sintered samples were carried out by placing the test sample on carbon-coated copper grid, operated at an accelerated voltage of 120 kV. The dielectric data of Zn doped CCTO ceramics were collected using the LCR meter (PSM 1735, Newton 4th Ltd, U.K) with variation in temperature at few selected frequencies.
3. Results and discussion
The relative densities of CaCu2.90Zn0.10Ti4O12 (CCZTO) ceramics sintered at 6h, 8h and 12h were found to be 91.16, 93.34 and 94.44%, respectively. It clearly shows that density increases with sintering time. XRD patterns of CaCu2.90Zn0.10Ti4O12 sintered at 950 °C with different sintering time (6h, 8h and 12h) are shown in Fig.1. X-Ray data were indexed on the basis of a cubic unit cell similar to undoped CCTO (JCPDS 75-2188), which confirm the formation of single phase. The lattice parameters and unit cell volume, determined using least square refinement method, are given in Table 1.

X-ray diffraction patterns of CaCu2.90Zn0.10Ti4O12 Ceramics sintered at 950 ° C for 6h, 8h and 12h
Lattice parameter, unit cell volume and particle size obtained from XRD and TEM for CaCu2.90Zn0.10Ti4O12

Fig. 2 shows the variation of lattice parameter with sintering time. It is observed from the figure that the lattice parameter increases with the increase in the sintering time. The change in unit cell parameter with time of annealing is due to increase in density. During the heat treatment each crystallite get enough dwelling time to get properly crystallized [21].
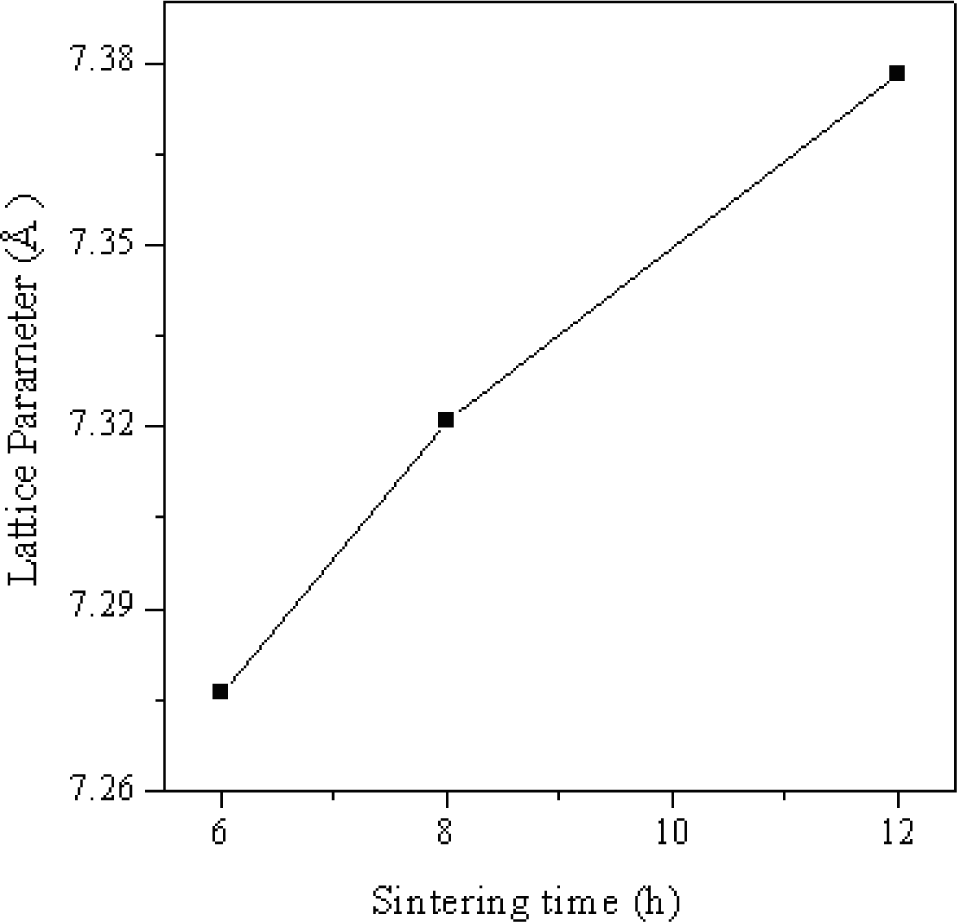
Varaiation of lattice parameter with sintering time
There is no evidence of the presence of secondary phase. XRD patterns show the presence of split peaks for the reflections at 400, 422 and 440. This may be due to presence of Cu-Kα2 along with Cu-Kα1 in the X-ray radiations used for the diffraction. This is supported by the fact that in all these reflections the intensity of peaks due to Cu-Kα2 is close to 50 % of intensity of peak due to Cu Kα1 as expected. From the line broadening of the main peaks, the crystallite size of the ceramic was estimated using the Debye Scherrer formula [22]:

where λ is the wavelength of the X-ray, k is a constant taken as 0.89, θ is the diffraction angle and β is the full width at half maxima (FWHM). The crystallite size derived from the XRD data and TEM analysis are given in the Table 1.
It is clearly observed that the crystallite size increased with increasing sintering duration, which is confirmed by the TEM analysis. The increased crystallite size with increasing sintering time is mainly due to over grown grains resulting from the destruction of the grain boundaries at higher sintering time. These data clearly show that the sintering time is responsible for increasing crystallite size with increasing sintering time of CaCu2.90Zn0.10Ti4O12 ceramic.
Fig. 3 shows SEM images of surface microstructures for the ceramics sintered at different sintering times. As can be seen from Fig. 3(a)-(c), the microstructures of CaCu2.9Zn0.1Ti4O12 change significantly with sintering time. In specimen sintered at 950 °C for 6h a porous with small grain size 8-10 μm is observed. The grain size range varies from 10-15 μm and 15-25 μm of the ceramics sintered at 8h and 12h, respectively. It can be seen that the grain size increased with increase of sintering time and the correspondingly grain boundary was reduced. Increasing the sintering time significantly promotes the grain growth and microstructural densification. The microstructures show grain growth in the specimen sintered for 8h and 12h along with some liquid phase. Additionally, a small amount of CuO phase was found in grain boundary region. This phase was so small that XRD could not detect. It also seems that with increasing sintering time from 6h, 8h and 12h solid CuO phase start melting as shown in Fig. 3(b) and totally melted in at grain boundary as shown in Fig. 3(c). Copper oxide present at grain-boundary transforms into the liquid phase during sintering which leads to abnormal grain growth [23–24].
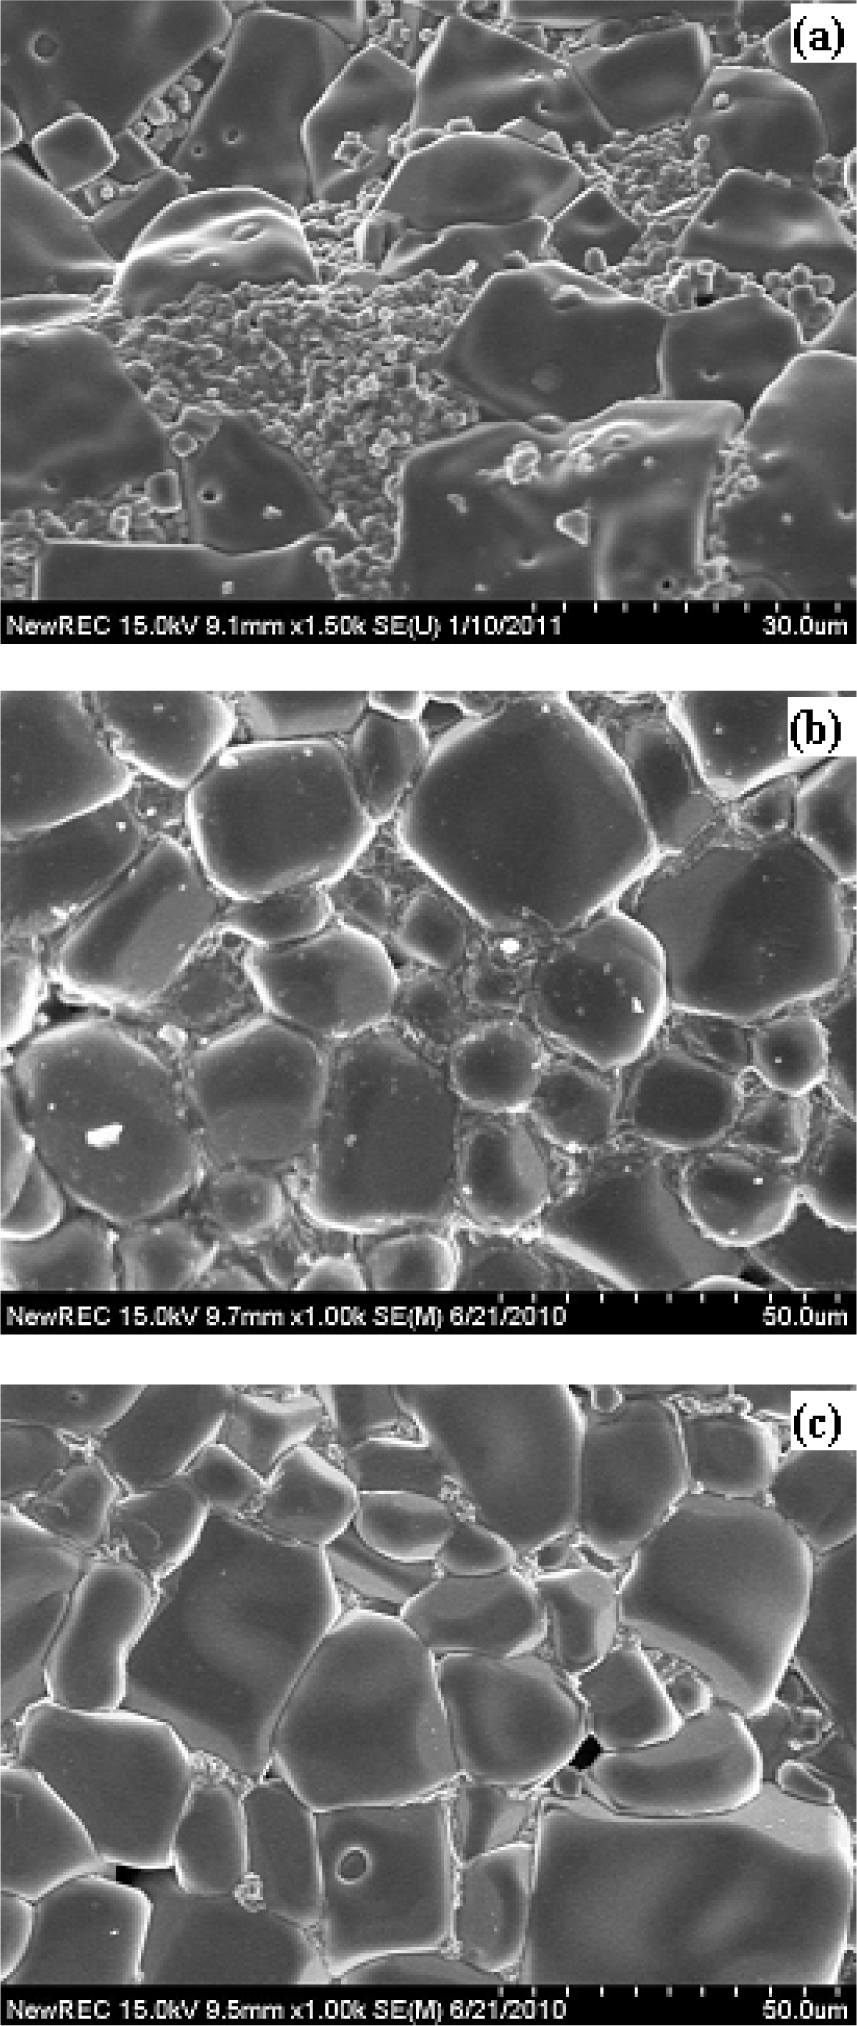
SEM images of CCZTO ceramics sintered at 950 °C for (a) 6h, (b) 8h and (c) 12h
TEM images (Fig. 4) of the CCZTO sintered powders clearly show that all of the samples consist of nanocrystalline CCZTO particles whose size increases with increasing sintering time. A representative manually constructed histogram of particle size distribution of CaCu2.90Zn0.10Ti4O12 (CCZTO-8h) is shown in Fig.5. The particle size of the ceramics sintered at 950 °C for 6h, 8h and 12h were found to be 54±11, 73±23 and 84±15 nm, respectively. The crystallite size obtained using Debye Scherrer formula is smaller than the particle size obtained by TEM. This is due to fact that the Debye Scherrer formula does not take into account the effect of lattice strain and instrumental factors on peak broadening.

TEM images of CCZTO ceramics sintered at 950 °C for (a) 6h, (b) 8h and (c) 12h

Histogram of Particle size distribution curve of CaCu2.90Zn0.10Ti4O12 nanoparticles of CCZTO-8h
EDX spectra of CCZTO ceramic (Fig.6) sintered at 950 °C for 6h, 8h and 12h show the presence of Ca, Cu, Zn, Ti and an extra peak of Pt at 2.15 keV. Pt coating was performed by ion beam sputtering for increasing the conductivity which was necessary to avoid charging or charged up of samples. The atomic percentage of Ca, Cu, Zn and Ti in the CCZTO ceramics obtained from EDX data are given in Table 2. The Cu/Ca ratio for CCZTO-6h, CCZTO-8h and CCZTO-12h are 2.75, 2.73 and 2.73, respectively. The percentage error are found to be 5.45, 6.22 and 6.22%, respectively.

EDX spectrum of CCZTO ceramics sintered at 950 °C for (a) 6h, (b) 8h and (c) 12h
Atomic percentage of elements for CaCu2.90Zn0.10Ti4O12 (CCZTO) sintered at 950 °C for 6h, 8h and 12h

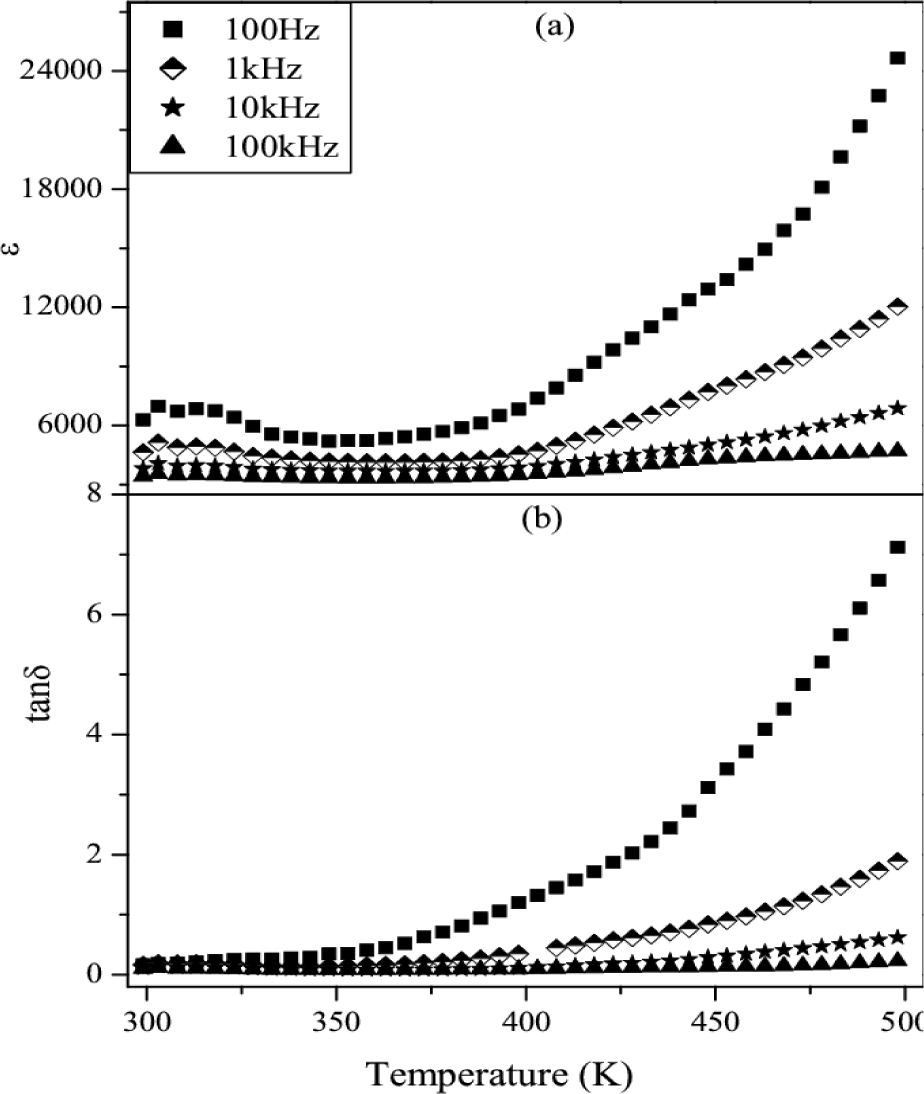
The temperature dependence of dielectric constant (εr) and loss tangent (tanδ) of the CCZTO ceramic sintered for 6h at different frequencies 0.1, 1, 10 and 100 kHz are shown in Fig.7. Dielectric constant (εr) exhibits a step like increase from low value 4216 to a giant value 16560 at temperature above 350K, which is prominent in the low frequency region and diminishes on increasing the frequency. At above room temperature a broad dielectric peak appears between 350K to 425K which also shifts to higher temperature and decreases in amplitude with increasing higher frequencies. It shows a ferroelectric relaxor behavior in the ceramic [25]. It is observed from the Fig. 7 (b) that the corresponding peaks are also present in the temperature-dependent plot tanδ. The above characteristic behaviors of a ferroelectric relaxor is usually characterized by diffuse phase transition and strong relaxational dispersion in dielectric constant and loss tangent (tanδ).

Variation of εr and tanδ vs temperature of CCZTO ceramic sintered at 950 °C for 6h
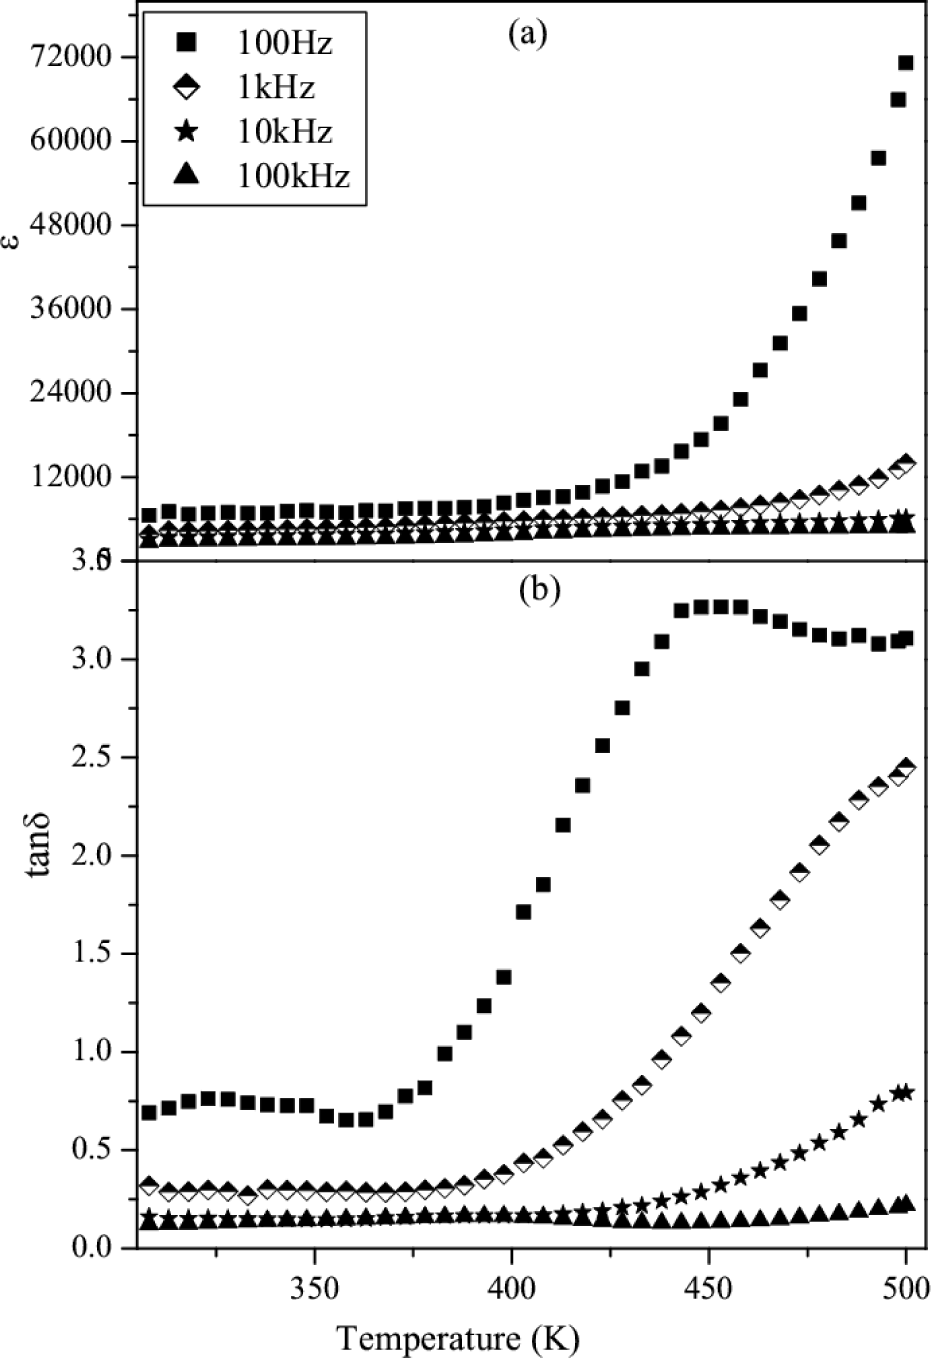
Figs.8 & 9 show the variation of dielectric constant and loss tangent (tanδ) with temperature at 0.1, 1, 10 and 100 kHz for CCZTO ceramics sintered at 950 °C for 8h and 12h, respectively. It is clearly shown from the figure that ferroelectric behavior is not present. It is also observed that the dielectric constant and dielectric loss of CCZTO 8h and 12h are temperature independent at higher frequency whereas temperature dependent in the low frequency region. It is also noted from the figures that the values of εr for CCZTO ceramic are 1083, 4751 and 4957 at 1kHz for 6h, 8h and 12h, respectively.
Variation of εr and tanδ vs temperature of CCZTO ceramic sintered at 950 °C for 8h
Variation of εr and tanδ vs temperature of CCZTO ceramic sintered at 950 °C for 12h
It is also inferred that εr increases with increasing sintering time. This is due to the fact that the longer sintering time produces more oxygen vacancies in the CCZTO ceramics and results high dielectric constant. It is observed from the figure that dielectric losses at 1 kHz for CCZTO are 1.07, 0.38 and 0.18 for 6h, 8h and 12h, respectively, at room temperature. A very clear picture of the sintering time dependence of dielectric constant value measured at 10 kHz is shown in Fig. 10. The high dielectric constant for CCZTO ceramics is due to interfacial space charge polarization [26]. This interfacial charge polarization arises due to accumulation of charge carriers at the interface of semiconducting grains and insulating grain boundary.
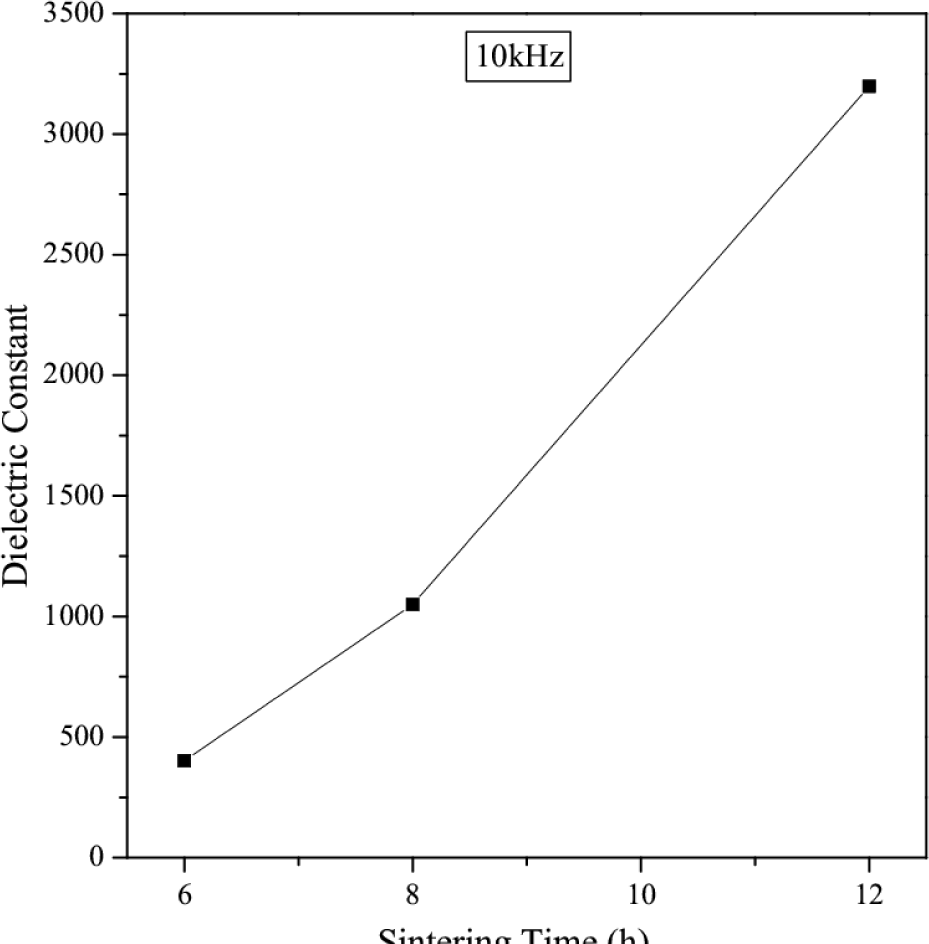
Dielectric constant value as a function of sintering time measured at 10 kHz
4. Conclusion
It is immensely important that an adequate control of sintering time and temperature are needed to obtain the desired microstructure and dielectric properties. Dielectric constant increases with increasing sintering time and dielectric loss decreases. It is suggested that the longer sintering time may lead to more defect structures. The size of the particle increases with increasing sintering time. It is mainly due to formation of large size particles as a result of loss of grain boundaries of small size particles. These changes lead to stability to the large size particles due to loss in grain boundary.
Footnotes
5. Acknowledgements
Authors express their gratitude to Dr. Madhu, Scientist, Institute of Medical Science, BHU, Varanasi for extending the facility for TEM analysis.