
Abstract
Although there have been many researches on mobile robot localization, it is still difficult to obtain reliable localization performance in a human co-existing real environment. Reliability of localization is highly dependent upon developer's experiences because uncertainty is caused by a variety of reasons. We have developed a range sensor based integrated localization scheme for various indoor service robots. Through the experience, we found out that there are several significant experimental issues. In this paper, we provide useful solutions for following questions which are frequently faced with in practical applications: 1) How to design an observation likelihood model? 2) How to detect the localization failure? 3) How to recover from the localization failure? We present design guidelines of observation likelihood model. Localization failure detection and recovery schemes are presented by focusing on abrupt wheel slippage. Experiments were carried out in a typical office building environment. The proposed scheme to identify the localizer status is useful in practical environments. Moreover, the semi-global localization is a computationally efficient recovery scheme from localization failure. The results of experiments and analysis clearly present the usefulness of proposed solutions.
Keywords
Introduction
There have been successful applications on autonomous navigation of mobile robots. However, developing a localization scheme for an inexperienced newcomer is still a difficult problem since there are various issues that affect to the localization results. In this paper, we concentrate on three issues which are design of observation likelihood model, localization failure detection and recovery from the failure. So far, the presented issues are difficult to be solved, and the solutions have been developed mainly based on developer's experiences.
Thrun et.al. introduced the Monte Carlo Localization (MCL) in (F. Dellaert, et. al, 1999). The MCL technique can deal with both global localization and local localization problem. The MCL is widely used due to its superior robustness to sensor noise. Gutmann et. al. conducted an experimental comparison of MCL with other localization schemes in (J. S. Gutmann and D. Fox, 2002).
The observation likelihood model design has been studied extensively to solve the mobile robot self localization problem. Thrun et.al. presented the Beam Model in (S. Thrun, et. al. 2005). The Beam Model is computed by the multiplication of individual sensor measurements. One of the disadvantages of the Beam Model is the discontinuity of the computed result. Therefore, the Beam Model requires additional filtering schemes to exclude unmapped obstacles in a given environmental map. Another observation likelihood model is the Likelihood Field in (S. Thrun, et. al. 2005). The Likelihood Field is difficult to be applied in dynamic environments because the performance becomes worse under data corruption. Therefore, it is desirable to build robust observation likelihood model under the obstacles. In addition, design requirements of observation likelihood model should be clearly presented.
Another important problem in this paper is the detection of localization failures. Sidek and Sarkar proposed the FDI framework to detect wheel slippage by using the neural network in (N. Sidek and N. Sarkar, 2006). Sidek and Sarkar exploited an additional accelerometer. Sundvall and Jensfelt proposed a method for detecting a collision due to obstacles which cannot be detected using the laser scanner in (P. Sundvall and P. Jensfelt, 2006). By using the CUSUM (F. Gustafsson, 2000) test, they estimated the difference of the expected poses between the odometry and the laser scanned image. Verma et. al. presented a method for detecting a fault of the Rover, which is equipped with 6 wheels, by using the particle filter (A. Doucet, et. al. 2001) in (V. Verma, et. al. 2004). This method cannot be applied directly to an indoor two wheeled differential mobile robot. In addition, it requires high computational cost as shown in (C. Plagemann, et. al., 2007).
In order to recover from the localization failure, Thrun et. al. introduced the MCL with the mixture proposal distribution in (S. Thrun, et. al., 2000). The scheme in (S. Thrun, et. al., 2000) maintains partial samples as a global localization status which is distributed based on the sensor measurements. However, it is not sufficiently fast to deal with localization failure due to wheel slippage. Lensor and Veloso introduced the Sensor Resetting Localization (SRL), which is used for soccer robot localization in (S. Lensor, et. al., 2000). The SRL is difficult to apply in a large office building environment. The limitations of previous researches summarized in Table. 1. We developed a range sensor based integrated localization scheme. The proposed scheme can be used for human co-existing real environment such as a science museum or an office building. Lee and Chung introduced a localization algorithm using the selection technique that decides a strategy between the global localization and the local localization in (D. Lee and W. Chung, 2003–2006). Kim and Chung proposed a navigation behavior selection scheme that exploits localization status and navigation history in (G. Kim and W. Chung, 2007; W. Chung, et. al., 2007) based on the Generalized Stochastic Petri-Nets (J. Wang, 1998). From our experiences, we found out several significant issues in the MCL based pose estimation. In this paper, we focus on three key issues based on the MCL scheme. The three issues are as follows:
Features and limitations of previous localization schemes.

Features and limitations of previous localization schemes.
Design requirements of a desirable observation likelihood model and performance analysis of our design.
Localizer status estimation by computing map-matching error.
Semi-global localization scheme to deal with localization failure due to the abrupt wheel slippage.
The first issue is the design of an observation likelihood model of the MCL. The design requirements are established. Thereafter, map-matching function and probability mapping function are developed. The usefulness of the proposed design is verified through experiments.
The second issue deals with the following question: Can we rely on the current localization result? There are many exceptional situations such as severe sensor data corruption by visitors, or abrupt wheel slippage due to uneven floor conditions. In this paper, we concentrate on the localization failure due to an abrupt wheel slippage. The third issue is the semi-global localization scheme, which is developed to deal with the localization failure due to abrupt wheel slippage. Once the localization fails, samples should be redistributed over the entire region of the given environment to carry out a global localization. In our approach, the sample distribution area is efficiently limited to a small region by exploiting the history of the localization status.
The remainder of this paper is organized as follows. In Section 2, we present the design requirements of the observation likelihood model and our observation likelihood model. In Section 3, it is shown how to detect the localization failure. The recovery strategy is also presented. Experimental results are presented in section 4. Finally, some concluding remarks are given in section 5.
Observation likelihood model design
The first step in the design of the observation likelihood model is the determination of pose error E(
Our pose error E(
Another significant property is that E(
After the definition of E(
On the other hand, too small ∂P(
Design of map-matching error
Fig. 1 illustrates a designed map-matching error function named “matching error”. The matching error E
m
(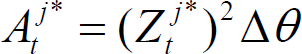


Illustration of matching error.
Equations (1) and (2) imply the area of the free spaces. Equation (4) defines the matching error E
m
(
E
m
(
Fig. 2 shows the result of the matching error distribution simulation when the real robot pose is located at (101,101) in the given map. For simplicity, the environment is a square and we use a grid map. The boundary of a rectangle is occupied and represented by black dots. Fig. 2(b) shows the matching error distribution with four obstacles, which are denoted by black dots. From Fig. 2(a), it is verified that matching error E
m
(

The matching error distribution plot as the robot position changes for two cases: (a) without obstacle and (b) with for obstacles (marked by black dots).
Fig. 3 shows the matching error under orientation errors. It is verified that E
m
(
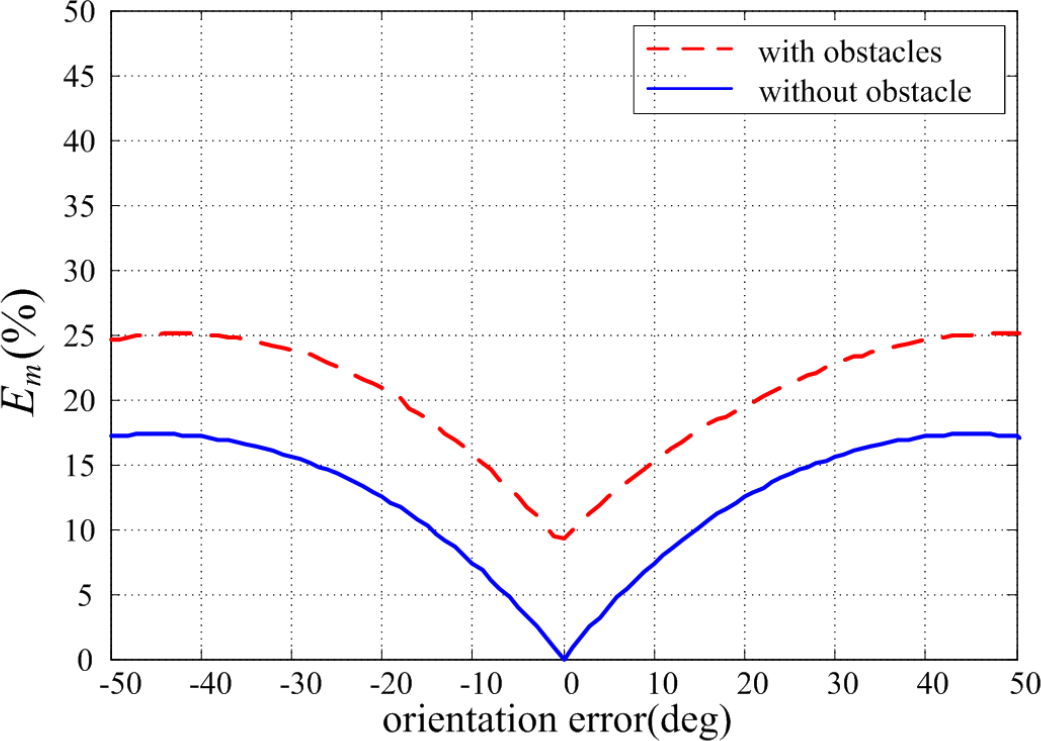
The matching error plot along the changes of the orientation error.
Once map-matching function is defined, a developer should design the probability update rule, which is represented by p(o
t
|
Our suggestion is the use of a saturated Gaussian function as the probability density function. By monitoring the standard deviation of matching error, a designer can obtain quantitative insights into the convergence properties. Furthermore, excessive convergence can be prevented by using the saturation. The probability saturation region is designed in order to avoid erroneous concentration of probability. The localization accuracy cannot be higher than the resolution of a grid map and sensing accuracy. Therefore, it is advantageous to saturate the probability around the center of Gaussian distribution. The excessive number of iteration may reduce the pose distribution to a very small area and may disturb the uncertainty handling capability. Pfaff et.al. proposed a localization algorithm using an adaptive likelihood model in (P. Pfaff, et. al., 2006). The adaptive likelihood model is advantageous in dynamic environments. In this paper, we exploit this algorithm. We use the statistical data of the samples, which are the mean value and standard deviation of the sample's matching error, to adjust the convergence speed. The designed probability updating rule is given by the following equations:
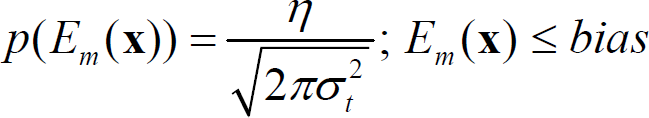
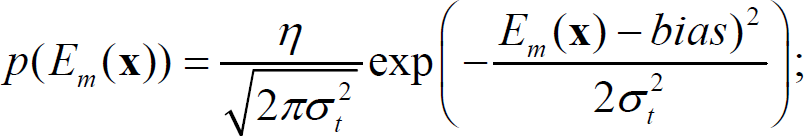
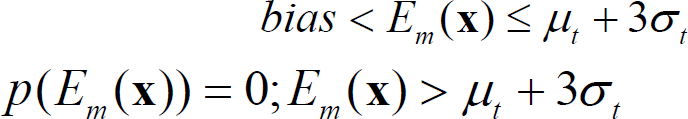
We compute the probability using (5), (6), and (7).B is a normalizer. The σ
t
and μ
t
denote for the standard deviation and mean value of sample's the matching error at time t Bias determines the region of probability saturation. The adopted Bias is 3% because the grid resolution is 10cm. The region of saturation is inside of 3% E
m
(
Fig. 4 shows the probability distribution of the Beam-model and the proposed model under the identical environmental conditions with Fig. 2(b). It is well-known that the continuous distribution is more robust than the discontinuous distribution. As shown in Fig. 4(a), the probability distribution shows local discontinuity around the true position. The positional error is larger than 20cm. This result implies that the Beam-model requires a large number of samples to deal with sensor noise. However, the probability distribution of the proposed scheme is smooth around the true position as shown in Fig. 2(b). Therefore, it is advantageous to adopt the proposed observation likelihood model.

The probability distribution simulation results as the robot position changes. (Red curve indicates the highest probability contour.) (a) Beam Model, (b) Proposed model.
Since the proposed scheme is a range sensor based localization scheme, it works only when sensor readings are partially corrupted by obstacles. In the highly dynamic environment, additional sensors such as upward pointing cameras should be installed.
Localizer status estimation using the matching error
The objective of the localizer status estimation is to decide whether the current localization status is localizer success or localizer failure. The matching error was used to detect a localizer failure. It is assumed that matching error is greater than a specific threshold when localization is failed. The major difficulty lies in the determination of the threshold. The threshold cannot be a single constant.
Fig. 5 shows experimentally measured the matching error history while the mobile robot performs 11,000 steps of the MCL successively. The navigation experiment is conducted in a typical office building which is shown in Fig. 7 and travel distance is about 670m. As shown in Fig. 5, the matching error is non-zero due to various errors, even for a successful localization. The matching error is affected by the scale of environment, unmapped obstacles, sensing accuracy and so forth. Therefore, it is difficult to estimate the localizer status with a constant threshold of the matching error. In this paper, the threshold h is the upper limit of the matching error of a localizer success.


Experimentally measured matching error during a navigation. (a) Matching error history, (b) Matching error histogram.
Equation (8) shows the computation of threshold h. μ i-k:i is the mean value of the matching error from (i-k)th step to i-th step, σ i-k:i is the standard deviation of the matching error.
Equation (8) exploits the sliding window scheme based on Hypothesis testing using Gaussian and χ2 test in (F. Gustafsson, 2000). The proposed equation is a simplified representation of the Hypothesis testing. Since bias indicates the upper bound of the Gaussian probability, the threshold is shifted by bias. The confidence interval is determined by 3 σ, since the matching error does not exceed the confidence level in most cases without wheel slippage. Finally, the sliding window size k is empirically determined from experiments. k is 500, which corresponds to 100s.
The localizer status estimation is independently carried out with the MCL loop for updating cycle of sensor data, since the MCL cycle time is more slower than the sensor cycle time. The matching error can be higher than h for a short time period. In most cases, instantaneous failures can be recovered by conventional MCL owing to its robustness. Hence, we use a median filter (E. Olson, et. al., 2005) to eliminate the short-term outlier values. A median filter removes the outlier by replacing a data with the median value of the n surrounding points. In the experiment, n was set to 15. The localization status is switched to localizer failure when the computed value of the matching error by the median filter is greater than h.
We propose a semi-global localization scheme to deal with exceptional localization situations. Many uneven floors exist in indoor environments. In such a case, abrupt wheel slippage may occur, which cannot be compensated by conventional MCL techniques. Using the localization status history of past movements, we can detect the moment that robot fell into localizer failure. Therefore, we can specify the reachable region of the robot. Semi-global localization implies that the sample distribution can be limited to the robot's reachable region.
Fig. 6 shows the maximum motion boundary region as a circle after the localizer fails to estimate a robot pose. Suppose that a robot starts navigation at time t0 following the reference path. The localizer status is estimated as a localizer success at time t0. While the robot moves forward, the robot's wheel slips at time t1. In Fig. 6, slip distance of the left wheel was larger than that of the right wheel. Since it takes time for a robot to detect localization failure, the robot's localization status was switched into localization failure at t3. It is clear that the local tracking may fail at t3 as shown in Fig. 6. The maximum motion boundary region of a robot after slippage is a circle, as represented in Fig. 6. The maximum motion boundary region is computed by assuming that the maximum moving distance is the accumulated distance from time t0 to t3 in all directions.

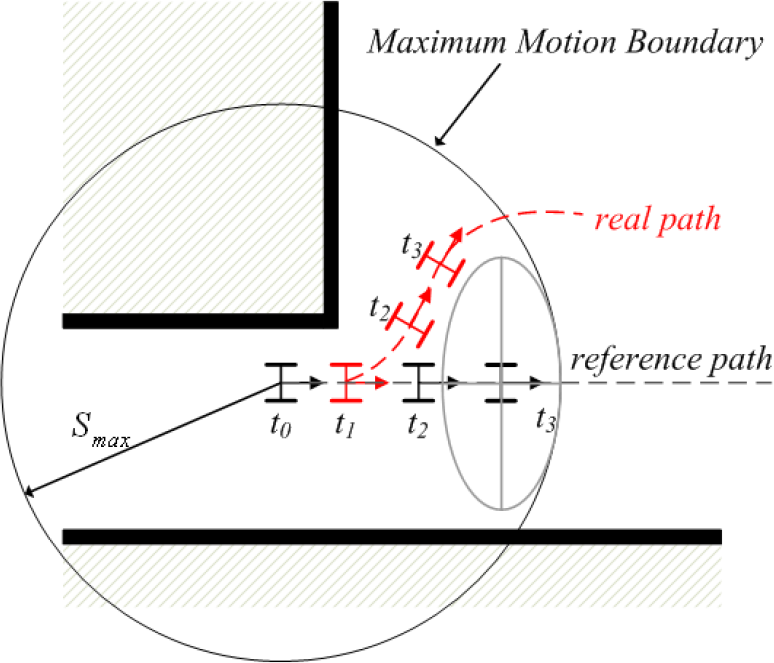
Conceptual illustration of semi-global localization.
Equation (9) shows S max , which is the maximum moving distance. σ is the standard deviation of the motion model. Δs i is the moving distance from wheel encoders. Using a motion model that has the Gaussian probability distribution, we assume the maximum moving distance by abrupt wheel slippage as max(δ trans ) ≈ 3σ. We perform the semi-global localization in the maximum motion boundary area with intentionally added 300 samples.
Experimental environments
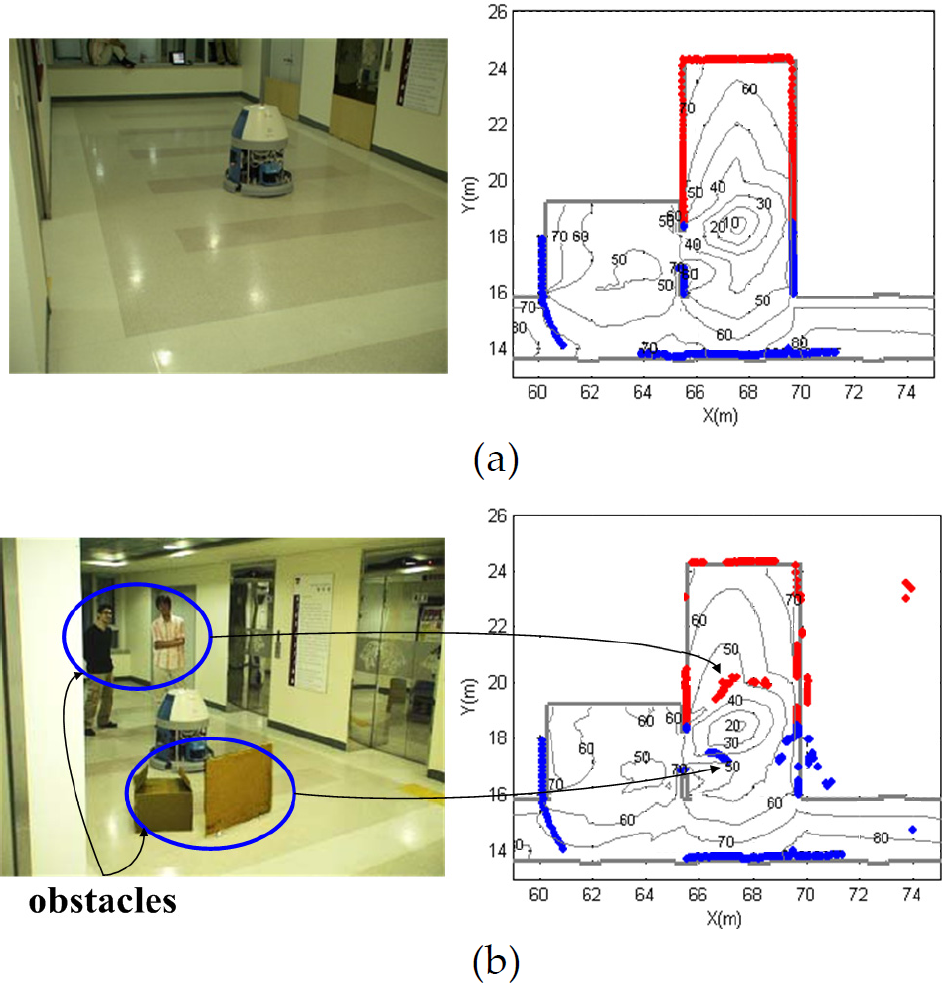
The experiments with the proposed observation likelihood model are conducted in a large building, which is shown in Fig. 7. Fig. 7(a) shows the target workspace. The environment contains some difficulties: a mirror-like surface around the elevator hall, which is located around x=64m∼70m and a stair, which is an open space. Fig. 7(b) shows the environment as a grid map with a grid resolution 10cm. Fig. 8 shows a two wheeled differential drive mobile robot. The robot is equipped with two SICK laser scanners in the front and rear. The laser range finder scans 180° with 1° angular resolution and the maximum range was set to 9m.

Experimental environments and its grid map. (a) Target workspace, (b) Grid map.
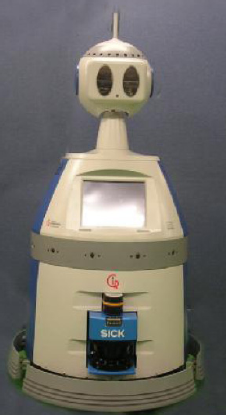
A mobile robot used for experiments.
Fig. 9 shows a localization result using the proposed matching error. Fig. 9 shows contour of the matching error on the left side and probability distribution on the right side. Fig. 9(a) shows first sampling result in which the samples are randomly distributed. After the first update, the samples are converged to a region in which the matching error is smaller than 60% as shown in Fig. 8(b). After 3 steps of sensor update, the samples converge to the 10% region as shown in Fig. 8(d). The experiment showed that the samples converged to the real robot pose after iterations. The samples did not converge excessively when the saturation was used. In addition, a designer can monitor the localization result intuitively using the matching error. For example, the map-matching result can be clearly monitored quantitatively by drawing the matching error contour.

Convergence of samples by MCL. (a) Initial sampling, (b) Sample distribution after 1st sensor data update, (c) Sample distribution after 2nd sensor data update, (d) Sample distribution after 3rd sensor data updates.
Fig. 10 shows the matching error contour under the different corruption ratios due to obstacles. A corruption ratio is a percent of corrupted sensor readings, where the range error is greater than m. As shown in Fig. 10, the contour shape does not change greatly even when obstacles block the sensor. Therefore, the convergence property is still maintained, even though absolute accuracy was decreased.
Matching error contour from corruption of sensor data by obstacles. (a) Corruption ratio 0%, (b) Corruption ratio 30%.
Fig. 11(a) shows the measured matching error that was monitored when the robot moved in the experimental environment for about 200s. A navigation experiment was conducted in the environment shown in Fig. 7 and the localizer successfully tracked the robot pose. This means that the localization status was localizer success during the experiment.

Matching error history during a navigation. (a) without median filter, (b) with median filter.
Even though the status of the localizer is localizer success, the matching error is non-zero due to various error sources. Fig. 11(a) shows the matching error which exceeds the threshold h instantaneously, and those instants are denoted by red-circle. False alarms occurred 6 times. This result implies that the localizer estimation result might return a localizer failure, which is a wrong estimation result without the median filter. Fig. 11(b) shows the matching error with the median filer. As shown in Fig. 11(b), outlier values are filtered out using the median filter. Therefore, the result of the localizer status estimation was always successful without any false alarms.
As shown in Fig. 12, there are two different floors in our experimental environment: one is cased with marble and the other one is cased with rubber tile. Sometimes, two wheels of the robot are stuck at the boundary of two different surfaces. As a result, the robot cannot move forward, even though the control input is pure translational motion.
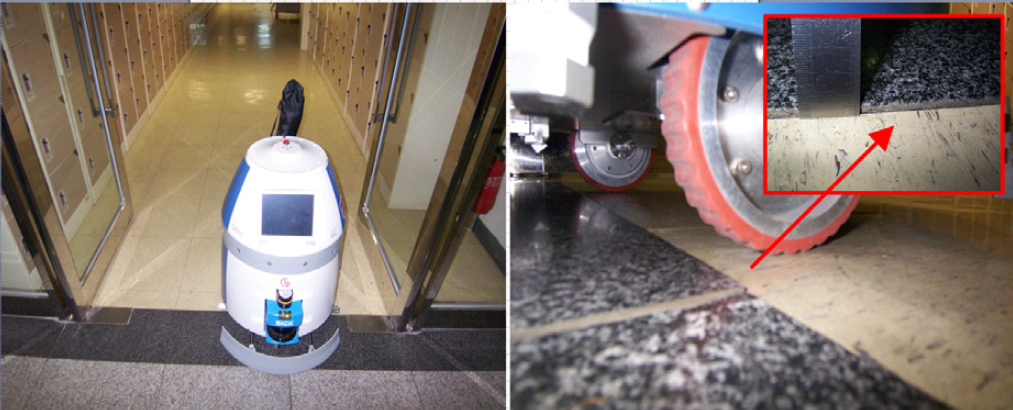
Wheel slippage situation due to uneven floor condition.
Fig. 13 shows grid map and scanned image before the active wheels are stuck over the floor. As shown in Fig. 13, the scanned image (denoted by blue dots) and the grid map (denoted by black dots) matches sufficiently. This fact implies that the localizer successfully tracked the robot's pose.

Grid map and scanned image obtained with laser scanner.
Fig. 14 shows localization failure case by abrupt wheel slippage. Even though the mobile robot cannot move to forward due to the wheel slippage, the MCL samples move forward from the real robot pose by the motion model. As a result, the localizer failed to track the robot pose because there were no samples anymore at the real robot pose.
Localization failure.
Fig. 15 shows the matching error history. Localizer failed to track the robot pose at 870s due to abrupt wheel slippage. As shown in Fig. 15, the matching error exceeds threshold h, which is represented as red circles. As a result of the estimation, localization status is switched to localizer failure. The semi-global localization is carried out after 870s.

Matching error history at localization failure 870s.
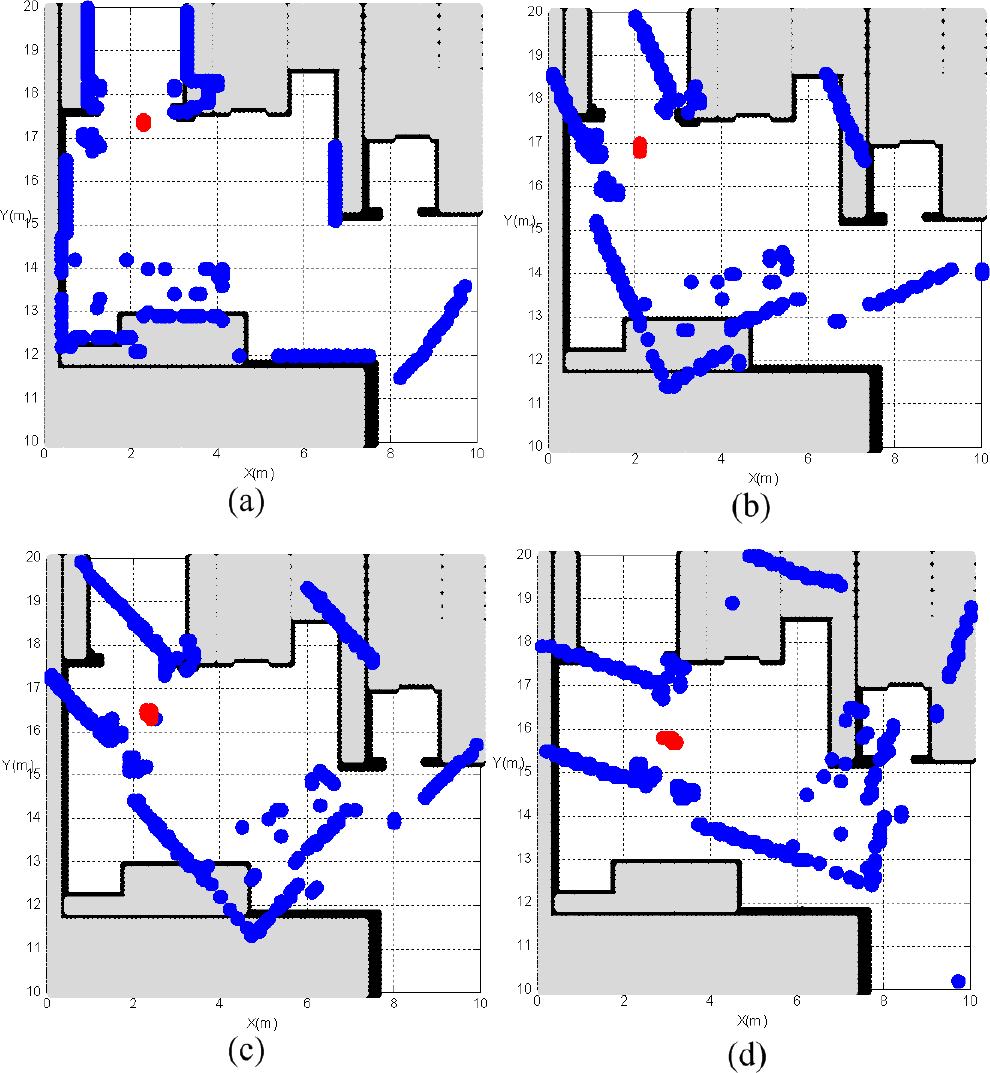
Fig. 16(c) shows that the localizer starts the semi-global localization because the matching error exceeded threshold h by the wheel slippage. As shown in Fig. 16(c), the sampling region is spread over the reachable region after slippage at (2, 17). The localizer recovers from the localization failure after 20s. The area of the reachable region after slippage was about 2.6m2. If we adopt conventional global localization instead of the proposed semi-global localization scheme, the samples should be spread over the whole workspace. The area of whole workspace is about 1539 m2. The computational cost is proportional to the number of samples. If the uniform sample density is assumed, the number of samples is proportional to the area of sample distribution. The required sample size for the successfully global localization in the given environments is about 5,000 ∼ 10,000 samples. However, the samples size for the semi-global localization is 300 samples. It is advantageous to use the proposed semi-global localization because it is computationally efficient than the conventional global localization.

Semi-global localization.
Three practical issues of a reliable localization scheme were addressed and then our solutions were presented. By using the proposed analysis and design, a practical and reliable localization solution was developed. The presented approaches were successfully experimented in real environments. Recognition of the localization status greatly improves practical performance, even though the presented matching error concept is quite simple. The contributions of this paper are as follows:
Using the proposed structural observation likelihood model design scheme, inexperienced researchers have guidelines for designing an observation likelihood model. The proposed scheme to identify the localizer status is useful in practical environments. The semi-global localization is a computationally efficient recovery scheme from localization failure.
Footnotes
6. Acknowledgment
This research was supported in part by the MKE(The Ministry of Knowledge Economy), Korea, under the National Robotics Research Center for Autonomous Navigation Technology support program supervised by the NIPA(National FT Industry Promotion Agency). This research was also supported by Basic Science Research Program and Mid-career Researcher Program through the NRF grant funded by the MEST. This research was also supported by a Korea University Grant.