
Abstract
Selecting welfare-enhancing projects necessitates determining the present value of cash flows from a public policy perspective. For an oil-exporting economy, the domestic energy transition often implies displacing oil from domestic consumption. Economic dependence on oil affects the public discount rate for oil price-related cash flows in two opposite ways: On the one hand, it renders the economy more volatile, which lowers the risk-free discount rate; on the other hand, it increases the correlation between consumption and the oil price, which results in a higher risk premium. To study these opposite forces, we first derive the public discount rate for an oil price-related investment project. Our framework considers economic uncertainty, an oil price-related risk premium, and allows for valuing oil at its opportunity cost. We illustrate our methodology using data from a panel of 26 oil-exporting countries. The results indicate that a risk-free discount rate of 3.1% is appropriate for our panel. However, to discount oil price-related cash flows, a risk premium of 1.4% needs to be added to the risk-free rate, which yields a risk-adjusted real discount rate of 4.5%. We find significant disparities between country-specific public discount rates. Additionally, for each country, we assess the present value of reducing domestic oil consumption by a barrel per day from 2023 to 2040, breaking down the different effects. Oil-exporting countries can use our estimates for making investment or policy decisions.
Keywords
Introduction
The domestic energy transition of an oil-exporting economy often implies investing in projects that displace oil from domestic consumption. This can, for instance, be a project that enhances energy efficiency in an oil-consuming sector or develops renewables capacity displacing oil in the power sector. At the same time, most oil-exporting economies pursue economic diversification and industrial development policies, which ultimately leads to less dependence 1 on oil revenues.
In oil-dependent economies, oil exports represent a significant share of the GDP and government revenues. For instance, in the third quarter of 2022 oil revenues accounted for 75.9% of Saudi Arabia's total government revenues (SAMA, 2022); the International Monetary Fund (IMF) estimates that in 2022 oil revenues made up 95.1% and 54.7% of total government revenues in Iraq and the United Arab Emirates, respectively (IMF, 2022, 2023).
In this context, selecting welfare-enhancing projects requires understanding the extent to which economic dependence on oil impacts the present value of oil price-related cash flows from a public policy perspective. This raises the issue of using public discount rates that capture both the risk of the cash flows and the characteristics of the oil-exporting economy considered.
Dependence on oil impacts the public discount rate for valuing oil price-related cash flows in two opposite directions. On the one hand, the dependence on oil exports and the substantial share of oil in the gross domestic product (GDP) render the economy more sensitive to the oil price. As a result, due to the fluctuations in the oil price, dependence on oil increases the volatility of the economy, which, through a precautionary effect, lowers the risk-free discount rate, 2 resulting in a higher valuation for future cash flows. On the other hand, economic reliance on oil also leads to a higher correlation between private or government consumption and the price of oil. This results in a higher risk premium, implying a lower valuation for future cash flows. In this paper, we investigate how the combination of these two antagonistic effects impacts the risk-adjusted discount rate. This begs a set of related questions: Which effect holds greater significance in shaping the public discount rate for oil price-related public investment projects? What is the magnitude of the risk premium? Does the size of the effects vary significantly between oil-dependent economies?
The risk-free discount rate refers here to the public discount rate used for valuing cash flows that are not correlated with per-capita consumption. From a public perspective, calculating the present value of cash flows correlated with per-capita consumption requires adding a risk premium to the risk-free discount rate.
Our study commences with an overview of how a public discount rate can be derived for a project aiming to save barrels of oil consumed domestically, breaking it down into three distinct components: the wealth effect, the precautionary effect, and the risk premium. Moreover, it recognizes that the barrel of oil freed from domestic use must be valued at its opportunity cost rather than at the prevailing international market price. Karanfil and Pierru (2021) show that, for an oil-exporting country, the opportunity cost of domestic oil consumption can be influenced by numerous factors, including the market share of the country's oil exports, domestic oil pricing schemes, and a variety of constraints 3 faced by its oil sector.
For instance: production quotas, logistical constraints, international sanctions, commercial obligations, or the need to finance imports through oil export revenues.
We use recent data from a panel of 26 oil-exporting countries and show that a risk-free discount rate of 3.1% can be employed in these countries if country-specific characteristics are overlooked. We show that governments should apply a distinct discount rate when evaluating cash flows correlated with aggregate consumption. Upon considering the inherent risk associated with oil price-related cash flows, we find that the risk-free rate needs to be adjusted upward by adding, on average, a risk premium of 1.4%, which yields a risk-adjusted real discount rate of 4.5%.
Our results, however, indicate that there is a considerable disparity between country-specific discount rates. Based on this finding, we investigate the factors that can affect the public discount rates in oil-exporting countries and analyze their correlation with macroeconomic indicators such as the level of reliance on oil or the degree of export diversification. Furthermore, for various oil-exporting countries, using our calculated risk-free discount rates, risk premia, and opportunity costs, we estimate the present value of the cash flows arising from reducing domestic consumption by a barrel of oil per day over the period spanning from 2023 to 2040.
Using incorrect discount rates can lead to mistaken public policy decisions, compromising policymakers' ability to make accurate choices in resource allocation and to select efficient investment projects. With the ongoing endeavors of oil-exporting countries to transition their energy systems and diversify their economies, it is essential to comprehend the factors influencing public discount rates. By discussing the elements that impact the public valuation of oil price-related cash flows and providing numerical illustrations, this paper generates tangible insights applicable to public policymaking in these countries.
The next section briefly documents the literature and discusses the disparities observed in the current discounting practices among governments and international institutions. Section 3 presents the data and discusses counterintuitive patterns observed. Section 4 outlines our methodological approach to valuing oil price-related cash flows from a public perspective. Section 5 provides empirical insights and estimates. Section 6 concludes.
According to public economics, an investment project can be undertaken if the reduction in welfare due to the foregone current consumption is more than compensated by the expected increase in welfare due to the future benefits of that investment. Properly discounting future costs and benefits is critical to assessing investment projects' net present values from a public perspective.
Many studies have attempted to address public decision-making in an intertemporal or in-tergenerational context. In The Economics of Welfare, Pigou put forth the idea that "the State should protect the interests of the future in some degree against the effects of our irrational discounting and of our preference for ourselves over our descendants." (Pigou, 1932, p.29). According to this statement, to act as protectors of the interests of future generations, governments must use a "rational" public rate to discount streams of costs and benefits of new investment projects.
Although economists have since made progress on both the theory and the empirical estimation of public discount rates, the question of which values to choose remains debated in both academic and governmental circles. Figure 1 presents the discount rates utilized by multilateral institutions and governments across a range of selected countries. It indicates that there exists significant heterogeneity in the discount rates used. This disparity can be attributed to several factors, such as differences in country-specific macroeconomic factors, time horizons, and the perceived level of risk associated with the project's outcomes. For example, the selection of the discount rate may rely on the characteristics of the sector or industry concerned, considering the project's economic, environmental, and societal impacts.
Figure 1 also suggests that compared to national governments, multilateral institutions focusing on development employ a social discount rate 4 that is relatively high, which implies those institutions assign less weight to benefits and costs that arise in the distant future. This approach tends to prioritize projects that yield immediate or near-term benefits. This preference for projects with earlier benefits can be attributed to an urgent need to increase infrastructure investment and overcome existing constraints.
Throughout the paper, we employ the terms "social discount rate" and "public discount rate" interchangeably.
The literature exploring the determination of public discount rates provides various perspectives. 5 Factors such as social preferences, intra- and intergenerational equity, and uncertainty are commonly emphasized, particularly in areas such as infrastructure planning, economic diversification, energy policy, and climate change mitigation and adaptation. One perspective centers on the valuation of private investments displaced by government programs, while another focuses on consumers' relative preferences regarding current income compared to future income. To cite some examples, Stern (2016) indicates that climate change impact models rely on two problematic assumptions: that people will be wealthier in the future and that future lives are less important than current lives. The first assumption ignores the risks and disruptions that climate change poses to future livelihoods and well-being, while the second assumption is discriminatory and difficult to defend. In accordance with this observation, due to the irreversibility and uncertainty associated with climate change impacts, Weitzman (2010) shows that a lower discount rate, significantly below 6%, which is approximately the global average after-tax real rate of return on capital, should be used.
We refer to Campos et al. (2015) for a comprehensive review of the research on social discount rates.
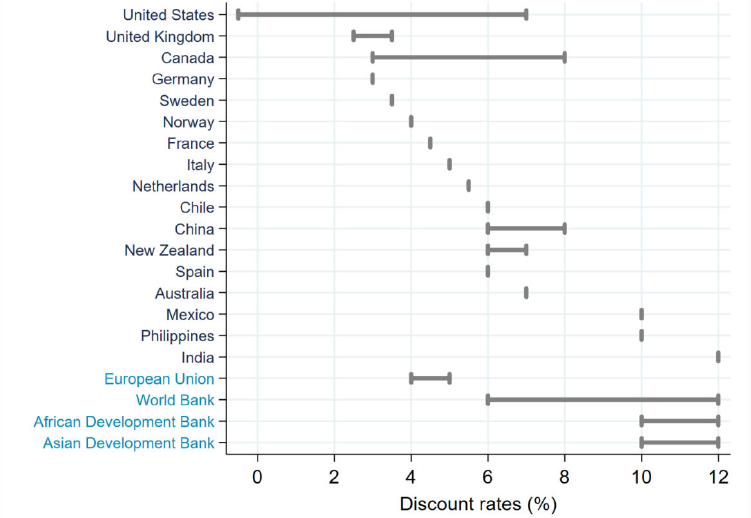
Discount rates used by international institutions and governments in selected countries
The literature stresses the necessity of using a discount rate that incorporates both the uncertainty relating to the whole economy and the risk associated with the future outcomes of a given investment. This is particularly true for public decision-making in oil-exporting countries where a substantial portion of the country's income is tied to volatile oil revenues. The reliance on such revenues carries a social cost, emphasizing the need to incorporate a risk premium when assessing the value of energy-related public investment projects (Pierru and Matar, 2014). In a framework that focuses on maximizing society's utility from consumption, the modified Ramsey rule provides a useful framework for determining the appropriate discount rate. According to this rule, the discount rate equals the sum of a risk-free rate (i.e., the minimum rate of return required for an investment with zero risk) and a risk premium that accounts for the risk generated by the investment for the economy. The modified Ramsey rule allows for the adjustment of discount rates according to the specific attributes of each project, recognizing that not all investments carry the same level of risk. Within this context, several studies have conducted estimations of country-specific social discount rates for the purpose of evaluating public projects (see, among others, Moore et al. (2020), Pierru and Matar (2014) and Schad and John (2012)).
Finally, when it comes to promoting societal welfare across generations, the question of how to optimally allocate resources brings up the notion of opportunity cost. Broadly speaking, opportunity cost represents the value that society assigns to the most favorable alternative that is foregone or rejected. While earlier literature (e.g., Little and Mirrlees (1974), Squire and Van der Tak (1975)) presumed that border prices accurately reflect the relevant opportunity costs for goods involved in international trade, subsequent research challenges this view and suggests that market distortions lead to opportunity costs deviating from observed prices (e.g., Hamilton and Clemens (1999), Karannl and Pierru (2021)). Building upon these insights, our analysis integrates both the opportunity cost approach and the public discounting framework.
We consider gross consumption per capita as our main variable of interest. Data covering the period from 1999 to 2020 are obtained from the World Bank and are given by the sum of household final consumption expenditure and general government final consumption expenditure. 6 We also use Brent crude oil price data from the U.S. Energy Information Administration. All data are yearly and in real US$ terms. 7 Our sample comprises 26 emerging and developing oil-exporting countries. In line with World Bank (2018), we consider the countries whose crude oil and natural gas exports account for at least 20% of their total exports. 8
General government final consumption expenditure includes all current government expenditures for the purchases of goods and services, which comprises employee compensation as well. It also includes spending on national defense and security, with the exclusion of military expenditures classified under government capital formation.
While per capita gross consumption is expressed in 2015 US$, Brent prices are in 2022 US$. The results are not affected by the difference in the base year, as we are considering the growth rates of both variables.
In this categorization, World Bank (2018) uses the average export shares from 2012 to 2014. Based on the availability of data from the World Bank, the 26 countries that satisfy this condition and are included in the analysis are Algeria, Angola, Azerbaijan, Bahrain, Bolivia, Brunei Darussalam, Cameroon, Chad, Colombia, Ecuador, Equatorial Guinea, Gabon, Ghana, Iran, Iraq, Kazakhstan, Kuwait, Malaysia, Nigeria, Oman, Qatar, the Republic of Congo, Russia, Saudi Arabia, Sudan, and the United Arab Emirates.
As will be explained subsequently, when determining public discount rates for a given country, the evolution of the country's economy is captured through the changes in per-capita consumption. We could be tempted to presume that economic growth would mechanically increase per-capita consumption. It is, however, not necessarily the case for countries where expatriate workers represent a significant proportion of the total population. In those countries, when the economy experiences growth, it often triggers a surge in the number of expatriate workers and subsequently leads to an increase in population. This, despite the growing economy, could, paradoxically, lead to a decrease in the per capita consumption growth rate. Conversely, an economic contraction can lead to a decrease in population (as a result of the departure of expatriate workers returning to their countries of origin), creating a positive per capita consumption growth rate. In our analysis, this circumstance is of particular significance due to the dissimilar behavior and consumption patterns between foreign residents and citizens of these countries. Firstly, foreign residents typically have short-term employment agreements, with a considerable proportion of them being low skilled and earning comparatively less than nationals. Secondly, their primary objective is often to maximize the remittances they send back home, since many have left their families in their countries of origin. Among the countries considered in our study, the Gulf Cooperation Council (GCC) member states (Bahrain, Kuwait, Oman, Qatar, Saudi Arabia, and the United Arab Emirates) are particularly concerned with this statistical issue. As an illustration, Figure A.l in Appendix A gives the evolution of both the total population and the Emirati citizens in the United Arab Emirates. Despite the significant impact of the global financial-economic crisis of 2008, the Emirati economy managed to grow from 2005 to 2010 (with an average yearly real GDP growth rate of 3.3%). In the same period, the economic growth was accompanied by a rapid influx of expatriate workers. As a result, the population more than doubled in the same period, which led to a steep fall in per capita consumption. To mitigate this potential bias, we exclusively include citizens (individuals holding the nationality of the country) when computing the consumption growth rate (defined as the logarithmic change in per capita consumption). We adopt this methodology for all GCC countries. 9 The data obtained, which are utilized in the current study, are depicted in Figure 2. 10
We express our gratitude to Christian Gollier for discussions on this question and for confirming that considering solely the citizens in GCC countries to calculate per-capita consumption is a reasonable fix. This approach, which has been selected because numerically it better reflects the actual evolution of those economies, does not presume that policymakers disregard the welfare of expatriate workers.
We use data from national statistical offices as well as multilateral institutions (World Bank and United Nations Global Migration databases) to estimate the number of citizens in each GCC country.
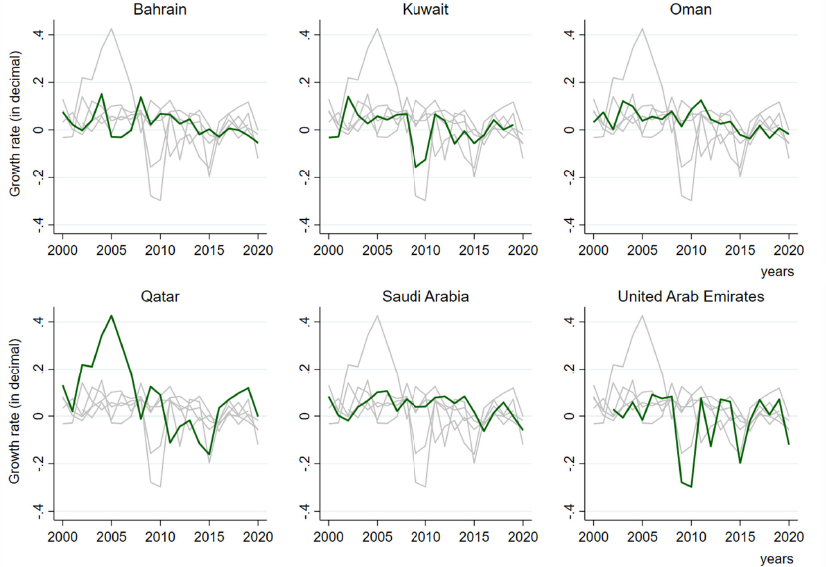
Growth rates of real gross consumption per capita in GCC countries
Figure 2 shows that the growth rates in the GCC countries exhibit significant volatility. Certain countries have experienced notably pronounced fluctuations in the past two decades. For example, the Dubai debt crisis caused by a real estate bust in 2009 plunged the United Arab Emirates into a severe financial and economic crisis. In the subsequent sections, we return to this volatility issue and show how it affects discount rate estimates.
The Ramsey Rule and the Opportunity Cost of Oil
Using the right discount rate value is key since discounting may strongly impact the valuation of investments with a long lifetime, like those related to energy transition, such as the projects considered here.
We begin our analysis by considering a standard social welfare function for an oil-exporting economy that is written as:

where CO and Ct are current and future per capita gross consumption levels, respectively. δ is a constant rate of pure time preference, i.e., the discount rate measuring the weight placed on the utility (U(.)) of future consumption. A higher value indicates less importance is given to future utility. In this paper, in line with the bulk of the literature on public economics, 11 we take δ = 0.
Although there has been a prolonged discussion surrounding the value of S (which is out of the scope of our paper), there is a general tendency in public economics literature to consider S = 0. In his seminal paper, Ramsey makes the same assumption and claims "it is assumed that we do not discount later enjoyments in comparison with earlier ones, a practice which is ethically indefensible and arises merely from the weakness of the imagination." (Ramsey, 1928, p. 543). Ramsey's recommendation to treat the utility of different generations equally is widely adopted (e.g., Solow, 1974; Weitzman, 2010; Collier, 2008, 2013a).
We consider an investment project that is small compared to the size of the economy. The project, which costs I per capita, aims to reduce domestic oil demand and export the oil that is freed from domestic consumption. The project is assumed to generate q barrels per year during T years on a per capita basis. Each barrel made available in year t will be sold at the international price Pt.
The cash flows generated by the project must be calculated based on the opportunity cost of a barrel of oil for the domestic economy. Karannl and Pierru (2021) show that the opportunity cost of oil equals the marginal revenue generated by the export of an additional barrel and is given by a fraction (γt) of the international price of oil. The authors show that in an oil-exporting country, when the oil consumed domestically has a fixed administered price, 12 the opportunity cost of oil is given by:
Karanfil and Pierru (2021) determine opportunity cost formulas for different sets of assumptions. We here only present the formula derived when domestic oil prices are set by the government, a common practice in oil-exporting countries.

where εx, t is the price elasticity of international demand for the country's exports. By a simple algebra, εx, t can be written as:

where εd, t and εs, t denote the price elasticity of global demand and other producers' supply, respectively, ρ represents the country's share in the global oil market. As εx, t < 0, we have γt < 1. Also, from Eqs. (2) and (3),
The project is considered profitable if it enhances the welfare in the country:

As in Gollier (2013b), by using first-order Taylor approximation and denoting the derivative of the utility function by U', the above condition becomes:
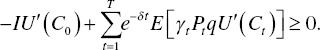
One way to express this is:

Assume for now that the cash flow of the project is certain, i.e., the opportunity cost of oil γt Pt is known. Then, the project has a positive net present value (NPV) if:

where the discount factor e−rt is given by the expected marginal rate of substitution between current and future consumption, i.e.,

We now consider the utility function of a representative agent that is increasing and concave:

Here α is the constant elasticity of marginal utility of consumption or the relative aversion to intertemporal inequality of consumption. Throughout the paper, we refer to α as the relative risk aversion. It is supposed to be positive and different from 1. Note, however, that when α = 1, Eq. (8) becomes U(Ct) = In(Ct).
If we suppose that there is no uncertainty about future consumption, using Eq. (8) in Eq. (7), we can get:

where μt is the average growth rate of consumption with
Determining the appropriate value for the coefficient of relative risk aversion has been a subject of ongoing debate. Estimates of α in use in macroeconomics and public finance applications usually range from 1 to 4. There is no specific study addressing the value of α for oil-exporting countries, but a value of 2 has often been used in the economic literature or recommended for public decision-making purposes (Pierru and Matar, 2014). Therefore, in this study, we adopt a value of α = 2, while also examining the sensitivity of our findings to α = 1 and α = 3.
4.2. Extending the Ramsey Rule with Economic Uncertainty
For long-term decision-making in the public sector, coping with uncertainty and asset or investment riskiness is a critical challenge. To take into account the effect of uncertainty, in line with the literature (see, for example, Cherbonnier and Gollier, 2022), we begin by making the assumption that consumption follows a geometric Brownian motion 13 and its growth rate (g) has a constant mean μ and standard deviation σ. Using Eq. (8), we can derive the expected marginal utility at date t as follows:
In evaluating commodity-based investment projects, it is a common practice to assume that the commodity price follows a geometric Brownian motion (Pindyck, 2001).

Now we can use the Arrow-Pratt approximation 14 to write:
Note that for this approximation to hold, the growth rate of consumption needs to be normally distributed. See Gollier (2013a) for a proof.

Combining Eqs. (7), (10) and (11), we obtain an extended Ramsey rule:

The risk-free discount rate (rf) in Eq. (12) should be applied when evaluating a project that carries no risk to the economy. From Eq. (12), the risk-free discount rate results from two opposing factors. The first factor is the wealth effect (αμ), which is determined by the expected rate of consumption growth multiplied by the relative risk aversion. When future consumption is anticipated to be higher, the need for current investment decreases, resulting in a higher discount rate. Essentially, there is no need to overinvest in favor of an already-promising future. The second factor, the precautionary effect
The uncertainty of consumption is particularly striking in the case of economies that are highly dependent on oil export revenues. The GCC countries' real per capita consumption growth rates, shown in Figure 2, have an average standard deviation of 0.083. To provide a point of comparison, during the same period from 1999 to 2020, the standard deviation of the same variable is 0.014 for both OECD countries and the USA, while it is slightly higher at 0.016 for the European Union. The high value of σ observed for oil-exporting economies is primarily caused by their dependence on the oil price (since gross consumption is often constrained by volatile oil revenues). This dependence, therefore, amplifies the precautionary effect and fosters a greater inclination towards investing, lowering the risk-free discount rate.
4.3. Introducing the Oil Price-Related Risk Premium
The social discount rate obtained in Eq. (12) can be used to evaluate safe projects. However, when a project's cash flows affect the aggregate risk borne by the economy, a risk premium has to be incorporated into the discount rate. This will occur in an oil-exporting economy when a new project generates cash flows that are a function of the international oil price. Undertaking such a project increases (or decreases) the exposure of the whole economy to the fluctuations of the oil price. Let us illustrate this point.
Suppose now that the project has a risky cash flow. In other words, the opportunity cost of oil in t is uncertain. Eq. (6) becomes:

where

If the risk carried by the cash flow γtPtq is independent of the aggregate risk of the economy, applying Eq. (14) leads to

In this scenario, there is no risk premium, and we obtain the risk-free discount rate specified in Eq. (12). Nevertheless, it is improbable for the assumption of independence between consumption and cash flow, as stated in the Arrow-Lind theorem (Arrow and Lind, 1970), to hold true in the case under examination here. This is because gross consumption in oil-exporting countries is likely to exhibit a correlation with oil prices. When a positive correlation exists, the project implementation leads to a higher level of overall risk. As a result, the project carries a positive risk premium. Consequently, the certainty equivalent of the future cash flow is given by 15 :
See Gollier (2013a) for a derivation of a similar equation.

Here, π (β) - αβσ2 is the risk premium of the project with
ß can be obtained by regressing the growth rate of the oil price against the growth rate of aggregate consumption. It measures the inverse of the elasticity of aggregate consumption with respect to oil cash flows. A parallel can be drawn between the consumption ß derived here and the market ß derived with the capital asset pricing model (CAPM) to value assets from a market perspective. The risk premium then depends on the correlation between asset returns and the (diversified) market portfolio. The CAPM determines the cost of equity of a company at the market equilibrium, and the company discounts free cash flows at its weighted average cost of capital.
From Eq. (16), it follows that when the risk premium is positive (i.e., ß > 0), the certainty equivalent of the cash flow decreases exponentially with t. Additionally, assuming that the elasticity of the country's oil exports remains constant (see Karanfil and Pierru, 2021), it can be shown that the fraction γ of the international oil price has no effect on the project's ß. In other words, the risk premium is independent of the value of γ.
Finally, using Eqs. (13) and (16), the project's net present value is written as:

where ra is the risk-adjusted discount rate.
Undertaking the project increases welfare if the project's net present value (as described by Eq. (17)) is positive. 17 Using Eq. (12), we write:
Note that this condition for the project to increase welfare remains the same if all cash flows are expressed in total rather than per capita terms.

Eq. (18) can also be written as follows:

From Eq. (18), a high level of uncertainty generates a precautionary saving motive and reduces the risk-free discount rate. On the other hand, from Eq. (19), if the consumption ß is larger than
In this section, we provide illustrative examples specific to oil-exporting countries, building upon our previous analysis of deriving discount rates for public investment projects that consider economic uncertainty, oil price-related risks, and the opportunity cost of oil. Since our methodology described above requires that the per capita real gross consumption growth rate follows a normal distribution, we first test for normality for the countries in our sample. The results of the Jarque-Bera test presented in Table 1 reject the normality of the distribution for eight out of 26 oil exporters. Therefore, unless otherwise stated, we continue our analysis in this section with the remaining 18 countries. 18
Although the question of why some countries' consumption growths have normal distribution whereas others do not is interesting from an empirical perspective, it falls outside the scope of this paper.
The countries listed in Table 1 exhibit an average standard deviation of 0.065 in gross consumption per capita, which is approximately five times higher than the average standard deviation observed in OECD countries (as discussed in Section 4.2). In the context of public policy in oil-exporting countries, such a substantial difference emphasizes the significance of uncertainty and the inherent risk associated with oil price fluctuations.
Summary statistics and normality test results for per capita real gross consumption growth rate
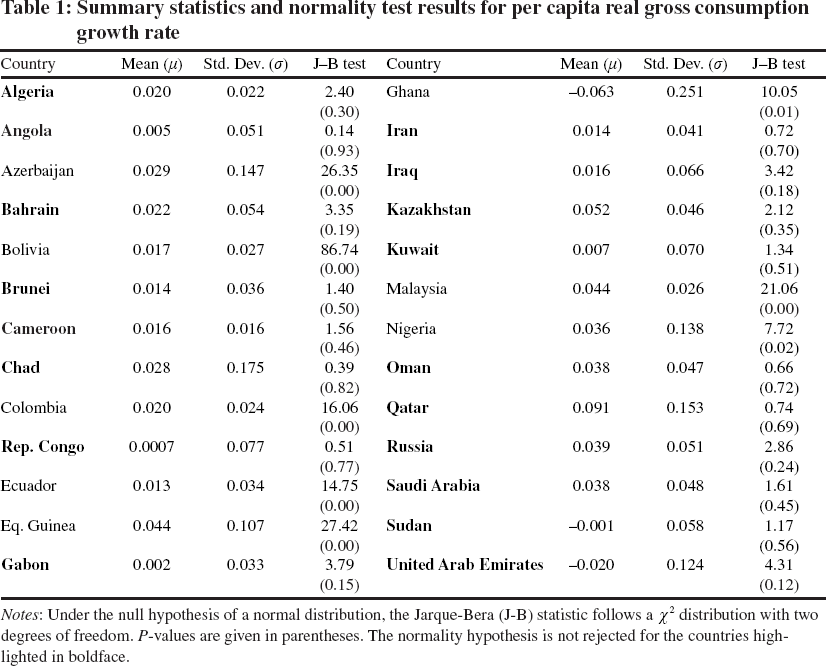
Notes: Under the null hypothesis of a normal distribution, the Jarque-Bera (J-B) statistic follows a x2 distribution with two degrees of freedom. P-values are given in parentheses. The normality hypothesis is not rejected for the countries highlighted in boldface.
5.1. Pooled and Country-Specific Risk-Free Discount Rates
We initially investigate the risk-free discount rate as outlined in Eq. (12). This can be done by utilizing cross-section or individual country-level data. To start, we focus on a cross-section framework. The distribution of yearly growth rates of per capita gross consumption is plotted in Figure 3, revealing a normal distribution.
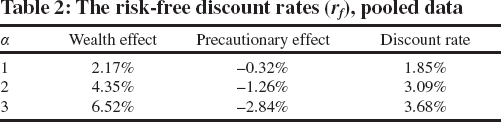
Using our pooled data, the obtained values for the risk-free discount rate, along with a breakdown of the wealth and precautionary effects, are presented in Table 2. 19 Note that the expected consumption growth rate and its variance are calculated using historical per capita consumption data (1999-2020). In other words, in our numerical illustrations, we assume that, in the future, consumption will exhibit similar characteristics as observed in the past. For a relative risk aversion of 2, we find a risk-free discount rate of 3.1% in real terms for our panel of oil-exporting countries. However, the cross-section approach ignores country-specific characteristics and assumes a complete homogeneity for the discount rate. Although our sample consists of emerging and developing oil-exporting countries and has some degree of homogeneity, there is still a need to calculate discount rates at the country level as consumption characteristics (mean and variance) in each country are likely to present differences, yielding different wealth and precautionary effects.
We conduct a set of unit root tests, including cross-sectional dependence tests, to verify the statistical properties of the series. All unreported results are available upon request.
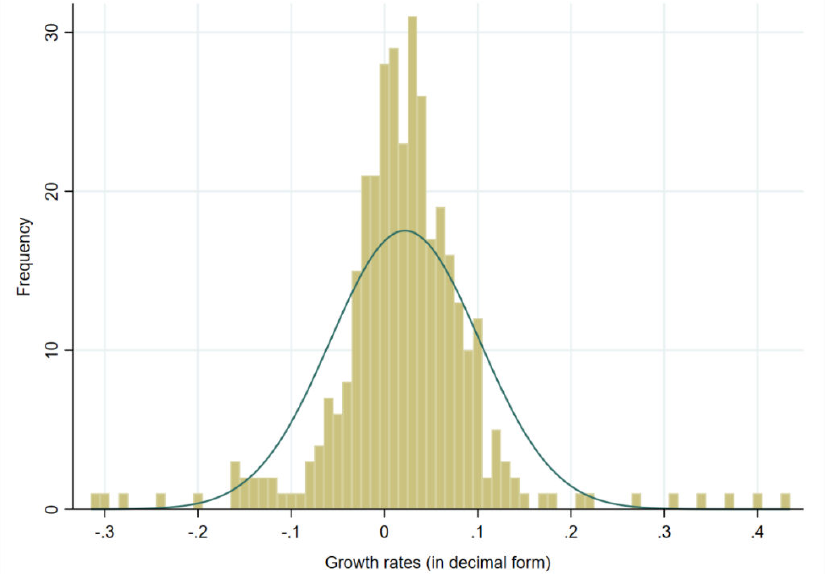
Frequency of gross consumption per capita (pooled data) for countries normally distributed
The risk-free discount rates (rf), pooled data
We now use the values reported in Table 1 to calibrate the risk-free discount rate for each country. The results given in Figure 4 suggest a significant disparity exists between the country-spe-cific risk-free discount rates. Note that the mean value of discount rates across countries is 3.14%, a value close to the one calculated for the combined sample, as reported in Table 2.
Qatar exhibits a significantly elevated discount rate of 13%. Similarly, countries like Russia, Saudi Arabia, and Oman have relatively high discount rates, hovering around 7%. These higher rates can be attributed to the rapid and steady growth in per capita consumption, which amplifies the wealth effect and diminishes the precautionary effect in absolute terms. Given that higher discount rates reduce the NPV of future cash flows, in these countries, choosing a risk-free discount rate that is too low (compared to the values depicted in Figure 4) may result in implementing safe public investment projects that would otherwise be deemed non-valuable. Conversely, in the case of the United Arab Emirates, we observe an unrealistically low, negative discount rate. This is attributable to the aforementioned financial and real estate crisis experienced by the country in 2009 and 2010, which had an impact on both the mean and standard deviation of consumption growth. 20
Excluding the two years of economic contraction from the analysis, the per capita gross consumption in the United Arab Emirates exhibits a standard deviation of 0.085 and a mean of 0.012. These figures correspond to a positive risk-free discount rate of 0.85%, with a wealth effect of 2.3% and a precautionary effect of -1.45%.
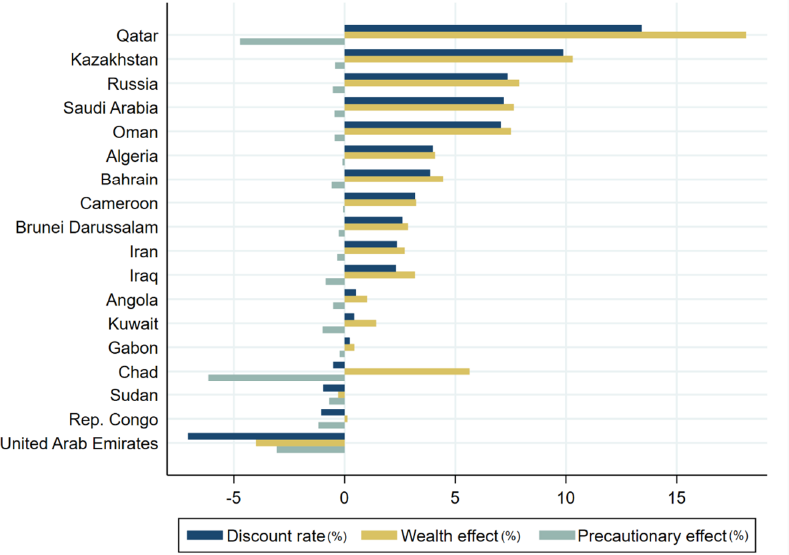
Risk-free discount rates for oil exporters
5.2. Calculating the Oil-Price Risk Premium
The discount rates calculated in the previous section should be applied to projects whose cash flows are not correlated with consumption. However, as mentioned earlier, this is likely not the case for oil price-related projects. OPEC's published statistics for its member nations reveal that in 2021, Saudi Arabia's oil exports accounted for a quarter of its GDP and over 70% of its total exports. Likewise, approximately 80% of Kuwait's export revenues are derived from oil. For economies highly dependent on oil revenues, these figures raise the question of the magnitude of the risk premium associated with the crude oil price. Indeed, as shown in Figure B.l in Appendix B, oil prices and consumption levels are significantly correlated for most of the oil-exporting countries. A corollary of this observation is that macroeconomic risks are impacted when projects changing oil exports are undertaken.
Table 3 presents both the risk-free and risk-adjusted discount rates we calculate for 18 countries (in real terms). We also provide in Figure 5(a) a scatter plot of the risk-free discount rates against the risk-adjusted discount rates and in Figure 5(b) the risk premium (i.e., π(ß)). In every country except Sudan, the relationship between the growth rates of per capita gross consumption and oil prices shows a positive covariance yielding a positive ß (see Table 4). This indicates a positive risk premium, averaging 1.4% in our panel. 21 As the covariance between gross consumption and oil prices increases, the corresponding risk premium that needs to be taken into account also rises. In this case, the implementation of any oil price-related public project would increase the overall risk associated with aggregate consumption, and variations in the project's cash flows amplify economic fluctuations. Under these circumstances, when evaluating the expected cash flows of oil price-related investments, it becomes necessary for decision-makers to utilize a risk-adjusted discount rate, which exceeds the risk-free discount rate.
In a study focusing on Saudi Arabia, Pierra and Matar (2014) used real per capita gross consumption data over the period from 1987 to 2010 and found that for a relative risk aversion coefficient of 2, the risk premium falls within the range of 1.27% to 1.69%. For the same country, our results indicate a risk premium of 1.54%.
Calculated country-specific real public discount rates (in percent)
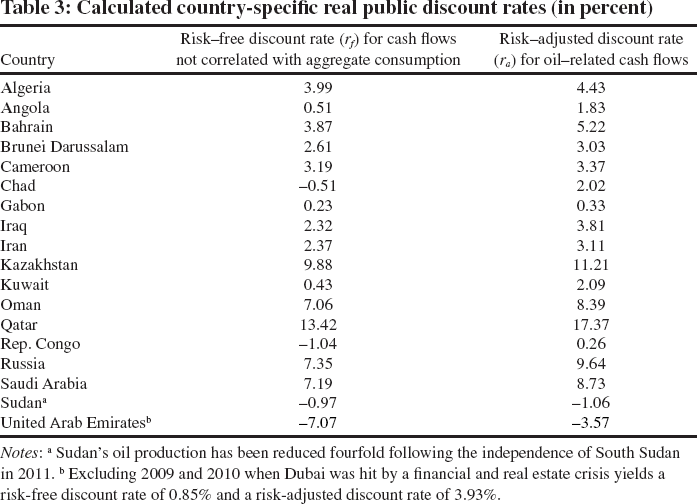
Notes:a Sudan's oil production has been reduced fourfold following the independence of South Sudan in 2011.b Excluding 2009 and 2010 when Dubai was hit by a financial and real estate crisis yields a risk-free discount rate of 0.85% and a risk-adjusted discount rate of 3.93%.
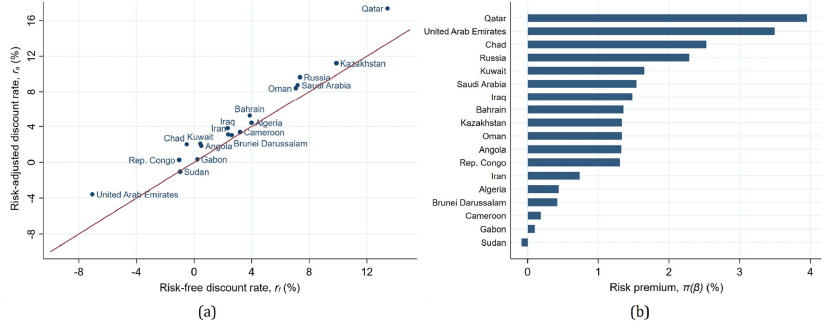
Risk-free versus risk-adjusted discount rates
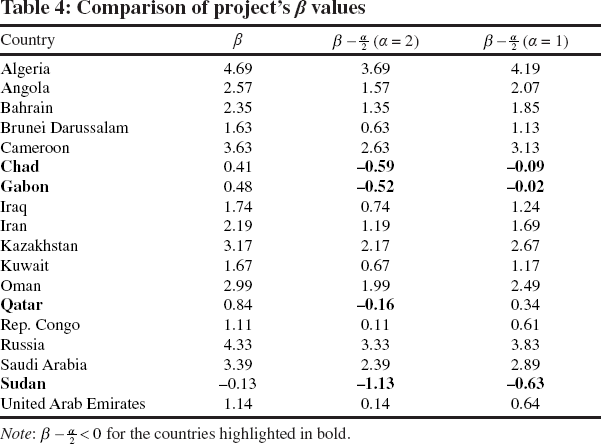
Table 4 presents the ß values computed for each country for α = 1 and α = 2. The average consumption ß is found to be 2.12, highlighting that per capita aggregate consumption strongly covaries with oil prices. Further, for all countries except Chad, Gabon, Qatar and Sudan,
Comparison of project's ß values
Note:
5.3. Is There a Link Between Economic Diversification and Discount Rates?
To gain a better understanding of the factors that can explain the above-described disparities in public discount rates, let us now consider two key indicators that measure a country's economic stability and resilience. 22 The first is the share of oil (and gas) revenues in national income. Oil revenues provide a major source of income that is used to fund public investments. However, reliance on oil revenues makes countries vulnerable to external shocks and fluctuations in global oil prices. The second indicator we consider is export diversification, which can help mitigate adverse terms of trade shocks, as it allows countries to spread economic risks across a broader range of products and markets.
In this section, illustrations are provided for the risk-adjusted discount rates. In unreported results, we find that our conclusions hold true if risk-free discount rates are used.
As Eq. (19) suggests, two conflicting factors come into play in determining the risk-adjusted discount rate. Firstly, a significant reliance on oil exports and a high share of oil in the GDP tend to make the economy more unstable, thereby reducing the risk-free public rate. However, this also results in a stronger connection between macroeconomic indicators and the price of oil, leading to an increase in the risk premium associated with oil prices, which is then added to the risk-free discount rate. Ultimately, the critical question is which of these effects takes precedence.
Figure 6 shows a scatter plot of the risk-adjusted discount rates and the average oil and gas revenues share in GDP over the period considered. It could suggest there is no correlation between the two. This apparent lack of correlation may be due to the fact that other factors, such as the composition of the GDP or the structure of exports, may impact the value of the discount rate.
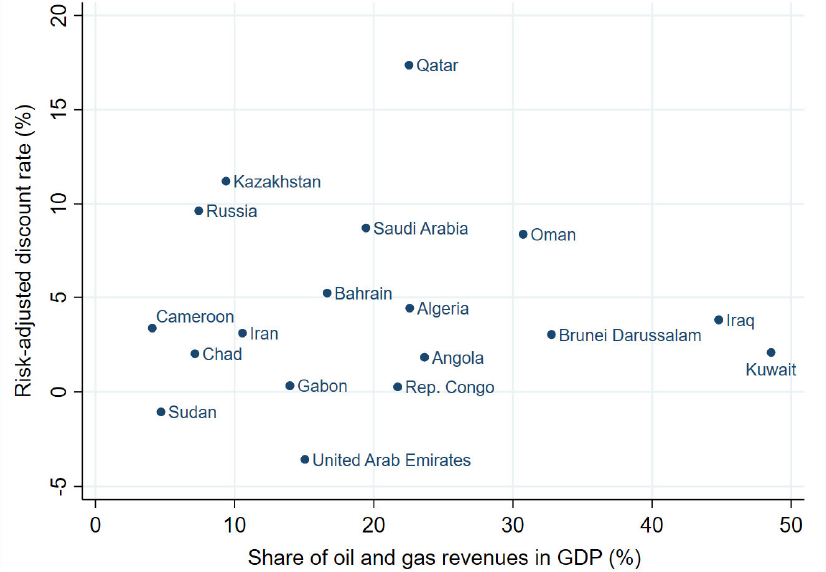
Share of oil and gas revenues against risk-adjusted discount rate
In this vein, let us examine if export diversification impacts the value of the risk-adjusted discount rate. Figure 7 shows that less export diversification (more export concentration) tends to result in lower public discount rates.
Most oil-exporting countries rely on a small number of export products for a large portion of their total exports. In a recent study, Karanfil and Omgba (2023) showed that the impact of the Coronavirus pandemic on oil-exporting countries was less severe for those with a higher level of export diversification. Indeed, poorly diversified economies, regardless of their specific export portfolios, are generally unable to offset a decline in revenue from one product by increasing revenues from other exports. As a consequence, a lack of export diversification increases countries' vulnerability and volatility in future aggregate consumption, leading to an elevated precautionary effect that ultimately lowers the public discount rates.
5.4. Short- and Long-Term Effects of Combining the Risk Premium and the Opportunity Cost
The above observations beg the following question: How do our results materially impact the public valuation of future oil price-related cash flows?
Based on the framework described in Section 4.3, we can define a risk premium coefficient (φt) as follows:

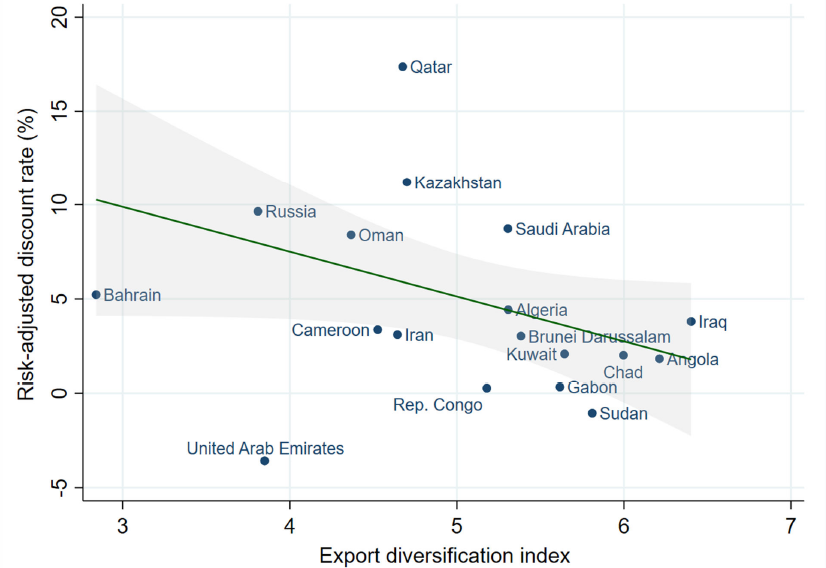
Export diversification against risk-adjusted discount rate
Then, the risk premium in year t amounts to the fraction φt of the risky cash flow. In our case here, the certainty equivalent of a cash flow from one barrel of oil (q = 1) in year t is given by
See Karanfil and Pierru (2021) and Almutairi et al. (2023) where the elasticity values considered are from Caldara et al. (2019).
As per Eqs. (2) and (3) countries with larger market shares experience a lower opportunity cost of oil. For countries with a very small market share, the opportunity cost aligns with the international price of oil. For other countries, over the long ran, the opportunity cost moves closer to the international price, primarily due to the influence of higher elasticities. The last two columns of Table 5 indicate that, on average, the certainty equivalent of one barrel of oil, valued at its opportunity cost, amounts to 85% of the international price in the short ran (one year). However, as the risk premium increases over time, the average certainty equivalent diminishes even further to 73% when evaluating a project with a 20-year lifespan. Based on these findings, accounting for the risk premium and the opportunity cost can substantially reduce the profitability of oil price-related projects.
Certainty equivalent of the cash flow generated by exporting a barrel (expressed as a percentage of the oil price)
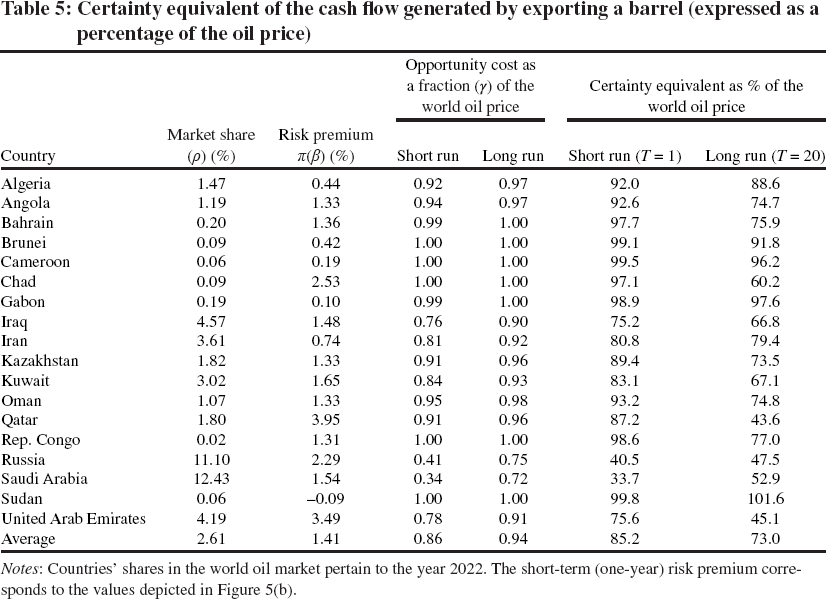
Notes: Countries' shares in the world oil market pertain to the year 2022. The short-term (one-year) risk premium corresponds to the values depicted in Figure 5(b).
5.5. Quantifying the Three Effects Through a Scenario-Based Analysis
Our final analysis in this paper provides a numerical illustration of our framework, which involves a public investment project in an oil-exporting country aimed at saving a barrel of oil per day from domestic consumption, subsequently sold in the global market. Using the risk-adjusted discount rates (as computed in Section 5.2 and depicted in Figure 5(a)), the opportunity cost of oil (as given in Table 5), and considering the period from 2023 to 2040, we can compute the present value of the cash flows generated by exporting one barrel of oil per day as
For each country in our sample, Figure 8 presents the projected cumulative cash flows over the 2023-2040 period. Considering that the oil is sold at the world price projected by the STEPS, the undiscounted cumulative cash flows amount to US$577 thousand by 2040 for every country. To break down the different effects identified in this paper, we will successively deduct the reduction in revenues due to the opportunity cost, the risk premium, and the risk-free discount rate. The red bars show the impact of opportunity costs on cash flows based on international price
The cumulative undiscounted cash flow is equal to the sum of the opportunity cost effect, the risk premium effect, the risk-free discount rate effect, and the present value, since we have:
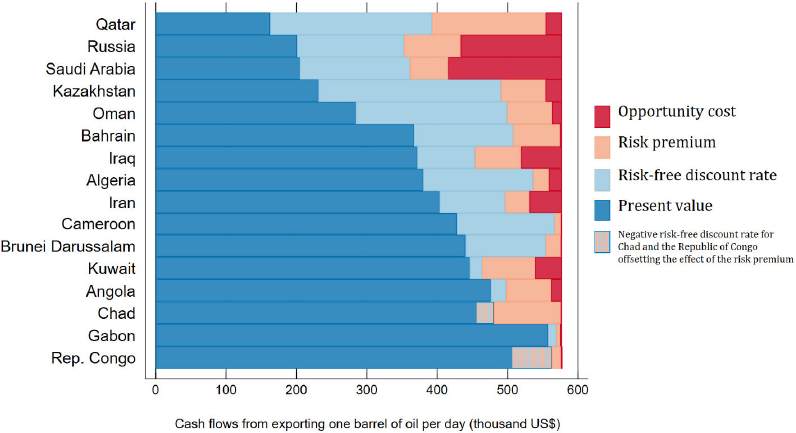
Breakdown of the effects of the opportunity cost, risk premium, and risk-free discount rate on the value of exporting a barrel of oil per day from 2023 to 2040.
In this paper, we estimate public discount rates for energy transition-related projects that displace oil from domestic consumption. For each country, the present value calculated above can also be used to inform public decision-making regarding the development of new oil production capacity. From a public perspective, an oil field development project would be profitable if, on a barrel-per-day basis, the calculated present value exceeds the sum of the investment cost required to build the corresponding production capacity and the discounted operating expenses incurred when producing over the period considered.
In this paper, we study discounting and valuation of investment projects from the perspective of public decision-making in oil-exporting countries. Economic dependence on oil introduces contrasting influences on the public discount rate for oil price-related cash flows. It both increases overall economic volatility, which decreases the risk-free discount rate, and raises the correlation between aggregate consumption and the oil price, resulting in a higher risk premium. To investigate these opposing forces and their impact on the valuation of oil price-related cash flows, our analysis incorporates three key components. These components encompass the consideration of economic uncertainty, quantified by the variance of gross consumption, an oil price-related risk premium, measured by the covariance between the growth rates of consumption and oil price, and the assessment of the opportunity cost of oil, which is determined as an incremental revenue.
For our panel of oil-exporting countries, we find that a risk-free discount rate of 3.1% can be applied to cash flows that exhibit no correlation with gross consumption. Except for Sudan, the growth rates of per-capita consumption and oil price exhibit a positive covariance, resulting in a positive risk premium. On average, this risk premium amounts to 1.4%. These values result in a risk-adjusted real discount rate of 4.5% for the panel.
Significant differences in discount rates are observed among countries. Our analysis reveals that the absence of export diversification amplifies the volatility of aggregate consumption. This results in an increased need for precautionary saving, which, in turn, reduces the risk-free public discount rate.
The consumption ß of investment projects displacing oil from domestic consumption is significantly high for the majority of countries, with an average value of 2.12. For all countries except Chad, Gabon, Qatar, and Sudan, the risk premium exceeds the precautionary effect.
For each country in our panel, we determine the present value of exporting a barrel of oil per day from 2023 to 2040, disentangling the various effects at play. We showed that, on average, the individual impacts of the opportunity cost, risk premium, and riskless discount rate account for 6%, 10.5%, and 18.5% of the cumulative undiscounted cash flows, respectively. The cumulative impact of these three effects results in a present value that is 35% lower compared to the undiscounted sum of cash flows, with a higher impact for GCC countries.
Our estimates are especially useful to policymakers in oil-rich countries considering investment projects or policies freeing oil from domestic consumption or using oil as an input. They enable governments to perform more accurate cost-benefit analyses, ensuring that decisions made enhance welfare and economic development. This is especially critical for oil-exporting countries pursuing domestic energy transitions and industrial development.
Footnotes
Acknowledgments
We thank Christian Gollier, the attendees of the joint KAPS ARC-OIES workshop held in Oxford in December 2022, the attendees of the 44th IAEE International Conference held in Riyadh in February 2023, and the anonymous referees for their comments and suggestions. The views expressed in this paper are our own and do not necessarily reflect those of KAPS ARC.
Considering Expatriate Workers in Population
Further Insights on the Consumption-Oil Price Relationship
Figure B.l. demonstrates that the per capita gross consumption of all GCC countries is correlated with oil prices. Examining the GCC panel in Figure B.2. reveals a stronger correlation when the annual growth rate of oil prices falls within the range of 10% to 30%. However, it is observed that consumption exhibits more resistance to downward changes. A decline in per capita consumption is only evident in the event of a significant drop in oil prices exceeding 40%. The regression analysis needs to be interpreted with caution as the pooled regression does not capture heterogeneous (country-specific) effects.
References
Supplementary Material
Please find the following supplemental material available below.
For Open Access articles published under a Creative Commons License, all supplemental material carries the same license as the article it is associated with.
For non-Open Access articles published, all supplemental material carries a non-exclusive license, and permission requests for re-use of supplemental material or any part of supplemental material shall be sent directly to the copyright owner as specified in the copyright notice associated with the article.