
Abstract
During the last years, European intraday power markets have gained importance for balancing forecast errors due to the rising volumes of intermittent renewable generation. However, compared to day-ahead markets, the drivers for the intraday price process are still sparsely researched. In this paper, we propose a modelling strategy for the location, shape and scale parameters of the return distribution in intraday markets, based on fundamental variables. We consider wind and solar forecasts and their intraday updates, outages, price information and a novel measure for the shape of the merit-order, derived from spot auction curves as explanatory variables. We validate our modelling by simulating price paths and compare the probabilistic forecasting performance of our model to benchmark models in a forecasting study for the German market. The approach yields significant improvements in the forecasting performance, especially in the tails of the distribution. At the same time, we are able to derive the contribution of the driving variables. We find that, apart from the first lag of the price changes, none of our fundamental variables have explanatory power for the expected value of the intraday returns. This implies weak-form market efficiency as renewable forecast changes and outage information seems to be priced in by the market. We find that the volatility is driven by the merit-order regime, the time to delivery and the closure of cross-border order books. The tail of the distribution is mainly influenced by past price differences and trading activity. Our approach is directly transferable to other continuous intraday markets in Europe.
Keywords
1. Introduction
Intraday power markets gained significant importance throughout the past few years, most visible in sharply increased trading volumes. In the European power market structure, they provide traders, asset owners and marketers of intermittent Renewable Energy Sources (RES) the opportunity to balance forecast errors arising after the day-ahead auction until five minutes before the beginning of the delivery period (Koch and Hirth, 2019). Increasingly, this balancing action is taken over by algorithmic trading strategies, for which reliable short-term price and volatility forecasts are necessary. At the same time, our results shed light on the influence of idiosyncratic features of intraday markets such as Single IntraDay Coupling (SIDC) on the price process and are thus valuable for policy makers concerned with short-term markets.
The recent and still sparse literature on probabilistic forecasting in intraday markets (Janke and Steinke, 2019; Narajewski and Ziel, 2020a; Uniejewski et al., 2019; Cramer et al., 2022) and the markets’ driving fundamentals has, so far, focused on modelling the impact of renewable forecast (Ziel, 2017; Kath, 2019; Pape et al., 2016; Gürtler and Paulsen, 2018; Balardy, 2022) and forecast errors (Ziel, 2017; Kulakov and Ziel, 2020; Kuppelwieser and Wozabal, 2021). A different strand of literature emerged around modelling of the merit-order effect for price changes and price elasticity (Kiesel and Paraschiv, 2017; Kremer et al., 2021, 2020; Kulakov and Ziel, 2019; Balardy, 2022). To the best knowledge of the authors, only Narajewski and Ziel (2020b) and Baule and Naumann (2021) focus on modelling the volatility in intraday markets. This paper aims to generalize the above research by investigating the fundamental drivers of the location, scale and shape parameters of the intraday price return distribution. We use the Generalized Additive Models for Location, Shape and Scale (GAMLSS) framework to model the distribution moments in a parametric and explainable fashion. Our contribution is thus two-fold: We are able to significantly improve forecasting performance compared to benchmarks and qualitatively analyze the impact of fundamental drivers for the distribution moments. While this paper focuses on the German intraday market, our methodology is transferable to any continuous intraday market such as France, Great Britain, Spain or Turkey.
This paper builds on the work of Narajewski and Ziel (2020b) to develop a simulation-based probabilistic forecasting model for the path of the five-minute-volume-weighted price
We study in more detail the distribution assumption for
One natural starting point to improve the models is adding intra-daily updated forecasts for wind and solar generation to reflect the information set available to market participants better. High forecast updates indicate that market participants with RES assets need to solve larger positions in the intraday market. Capturing this effect aims at improving the modelling of the location and volatility of
A measure for the intraday price elasticity is derived from the day-ahead auction curves, which are used as proxy for the intraday merit-order and included in the modelling of the volatility (Kulakov and Ziel, 2019, 2020). This is motivated by Kremer et al. (2021, 2020), who show that the price impact of forecast errors depends on whether the market is in a flat or steep merit-order ’regime’ and the work of Balardy (2022), who shows that the intraday bid-ask spread can be explained by the price elasticity derived from the day-ahead auction curves. Additionally, the predictive power of the day-ahead level of outages and the change in planned and unplanned outages between day-ahead and intraday is tested.
As in Narajewski and Ziel (2020b), we utilize the GAMLSS framework for parameter estimation. However, we allow for a more flexible parameter training approach utilizing an automatic variable selection for all distribution moments by utilising the adaptive Least Absolute Shrinkage and Selection Operator (LASSO) estimation technique for the GAMLSS model as well. This procedure was similarly used in Ziel (2021) in the context of the M5 forecasting competition.
The extended models are tested in a forecasting study and compared to the benchmark models. We evaluate the probabilistic forecasting performance by utilizing established probabilistic scoring rules and calibration measures. Statistical significance is evaluated by the widely used Diebold-Mariano (DM)-test (Narajewski and Ziel, 2020b; Ziel and Berk, 2019; Nowotarski and Weron, 2018; Diebold and Mariano, 2002). In our forecasting study, the GAMLSS-based model assuming Johnson’s
The presented models and methodology are also of interest to practitioners in intraday markets. Path-based forecasts allow to price short-term asset flexibility using Monte-Carlo option valuation. Additionally, the explicit modelling of the volatility provides a starting point to introduce time-varying volatility to stochastic optimization models for market making, position solving and sequential bidding (von Luckner et al., 2017; Glas et al., 2020; Aïd et al., 2016; Kath and Ziel, 2020; Kraft et al., 2023).
The remainder of this paper is structured as follows: Section 2 gives a short introduction to the structure of the German short-term power markets. Section 3 presents the data preparation of the intraday trade data, the forecast and outage data sets and the transformation of the day-ahead auction curves and related assumptions. Also, some exploratory data analysis is carried out in this Section. Section 4 introduces the used models. The forecasting study design and scoring rules are discussed in Section 5. Finally, Sections 6 and 7 present the results and conclude this paper.
2. Structure of the German Power Market
This section briefly introduces the relevant structure of the German power market. As we work with data from the day-ahead auction and the intraday market, the description focuses on these markets. Generally, denote the delivery day as
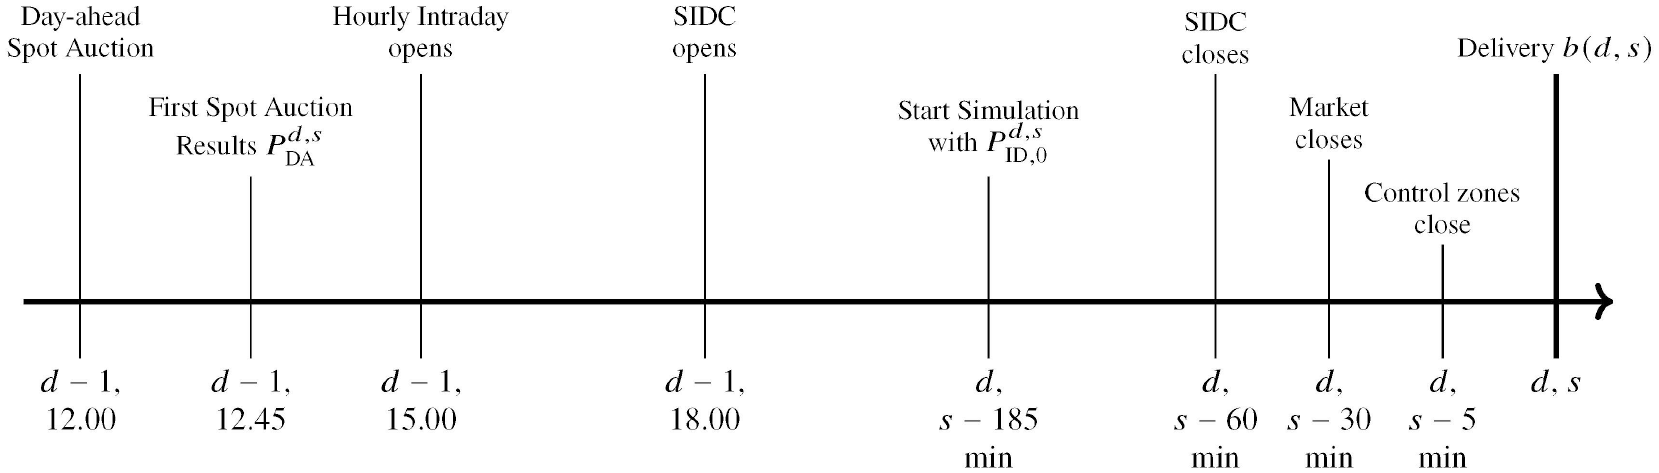
Daily procedure in the German short-term power markets (based on EPEX SPOT SE, 2018; Narajewski and Ziel, 2020b; Nordpool SE, 2018).
The spot market is organized as a pay-as-cleared auction. The order book closes on
The intraday market is structured as continuous pay-as-bid auction similar to financial markets. However, contrary to equity or currency markets, the individual trading sessions of the intraday electricity markets are not part of a larger process, as the intraday trading session ends with the physical delivery of power. Hence, trading sessions for the same delivery period on different delivery days might be driven by fundamentally different circumstances and need to be viewed separately. Trading starts at 15:00, 15:30, 16:00 on
3. Data and Exploratory Analysis
3.1 Intraday Trade Data
On the intraday market, trading happens continuously. Hence, the transactions are irregularly spaced and need to be aggregated. The following paragraphs and Figure 2 give a brief overview of the aggregation. A detailed description can be found in Appendix A.1. Trade data is obtained from EPEX SPOT SE (2020c). The data consists of all hourly trades on the continuous intraday market between January 1st, 2016 and July 31st, 2020.
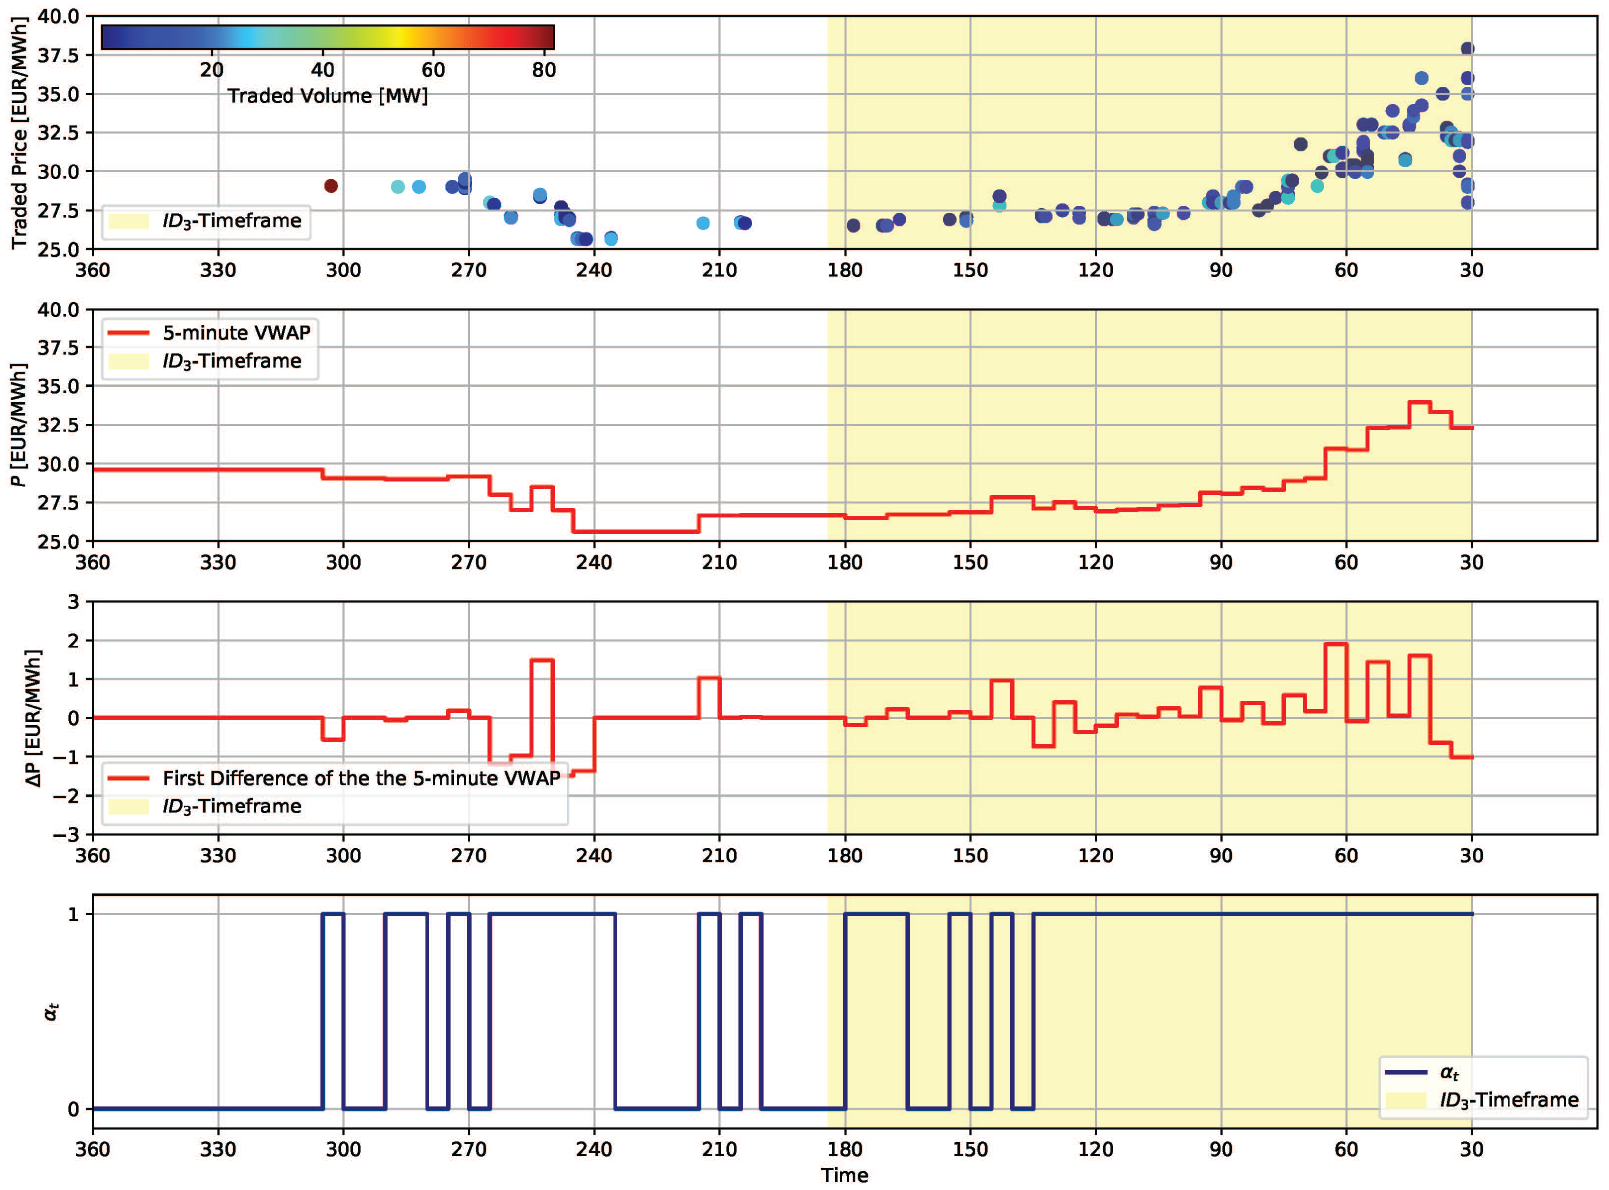
Overview of the data preparation. The first figure shows the raw trade data. The color refers to the traded volume. Below, the 5 -minute Volume-Weighted Average Price (VWAP)
For each delivery period
Figure 3 shows the relationship between the share of no-trade events, i.e. 5 -minute intervals where
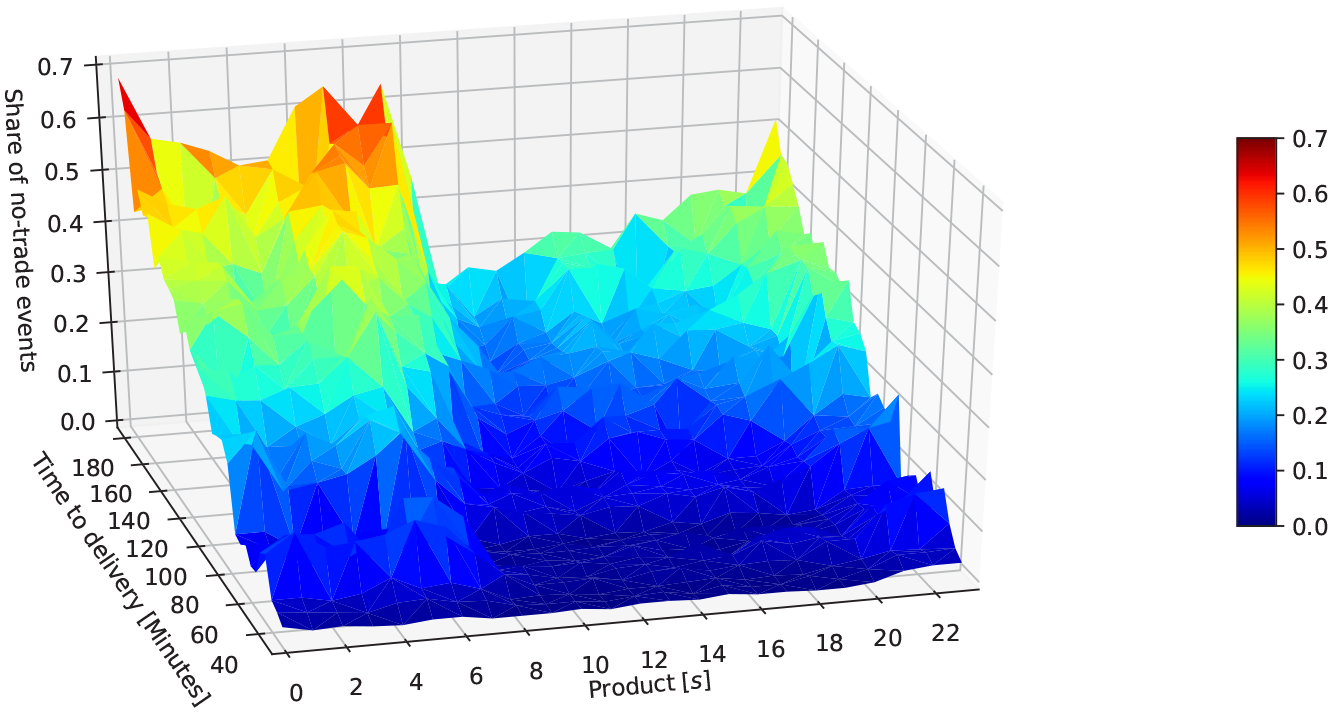
Share of no-trade events over time to delivery and delivery hour for the initial oneyear training set from January 1st to December 31st, 2016. Colour corresponds to the
Summary statistics for
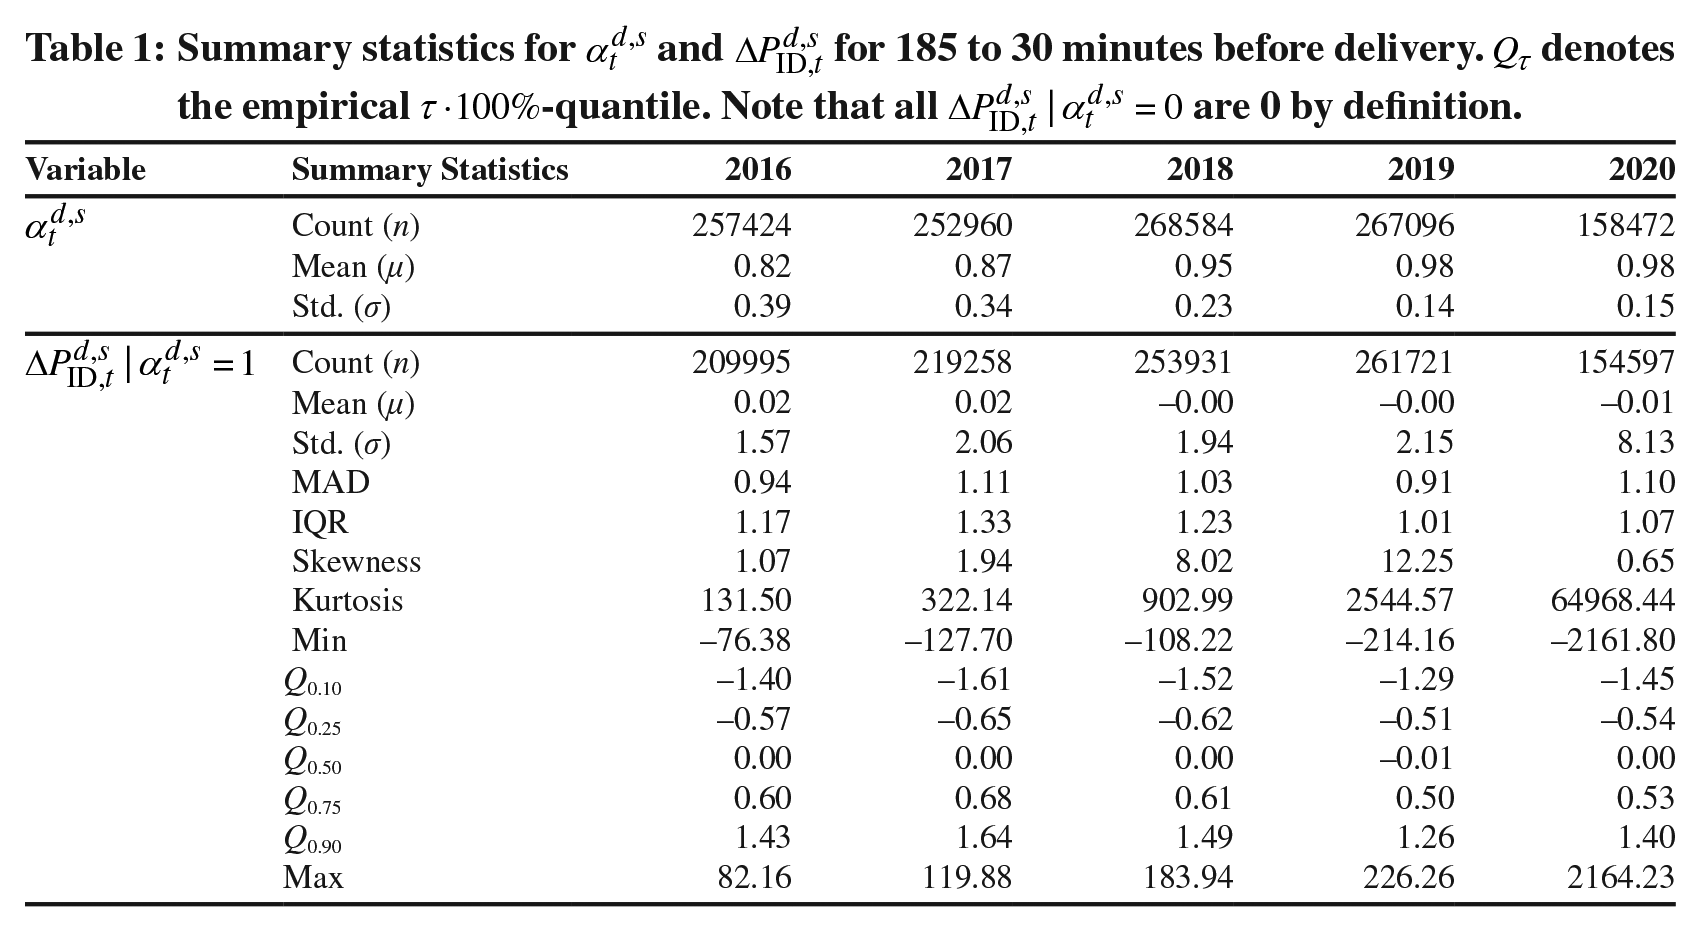
The mean and median values of
Figure 5 plots histograms for
The relationship between the realized variance and the time to delivery in the initial training data is shown in Figure 4. The volatility increases slightly until 60 minutes before the start of the delivery and rises sharply between 60 and 30 minutes before the start the delivery. Here, we note three levels of time-varying behaviour: first, across the full data set, volatility is increasing. Second, within each day, the volatility moves with the peak/off-peak hours. Third, within each trading session, volatility increases towards the end of the trading session.
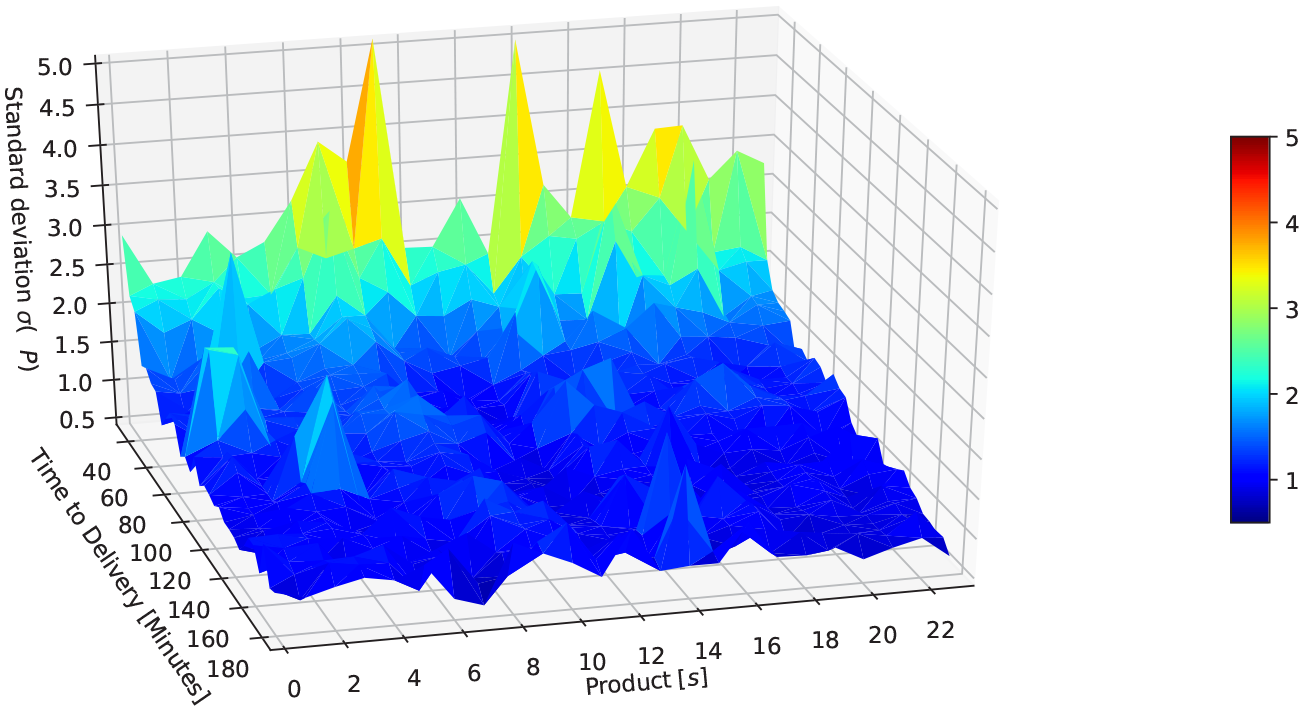
Volatility development over time to delivery and delivery hour for the initial training one-year set from January 1st to December 31st, 2016. Colour corresponds to the
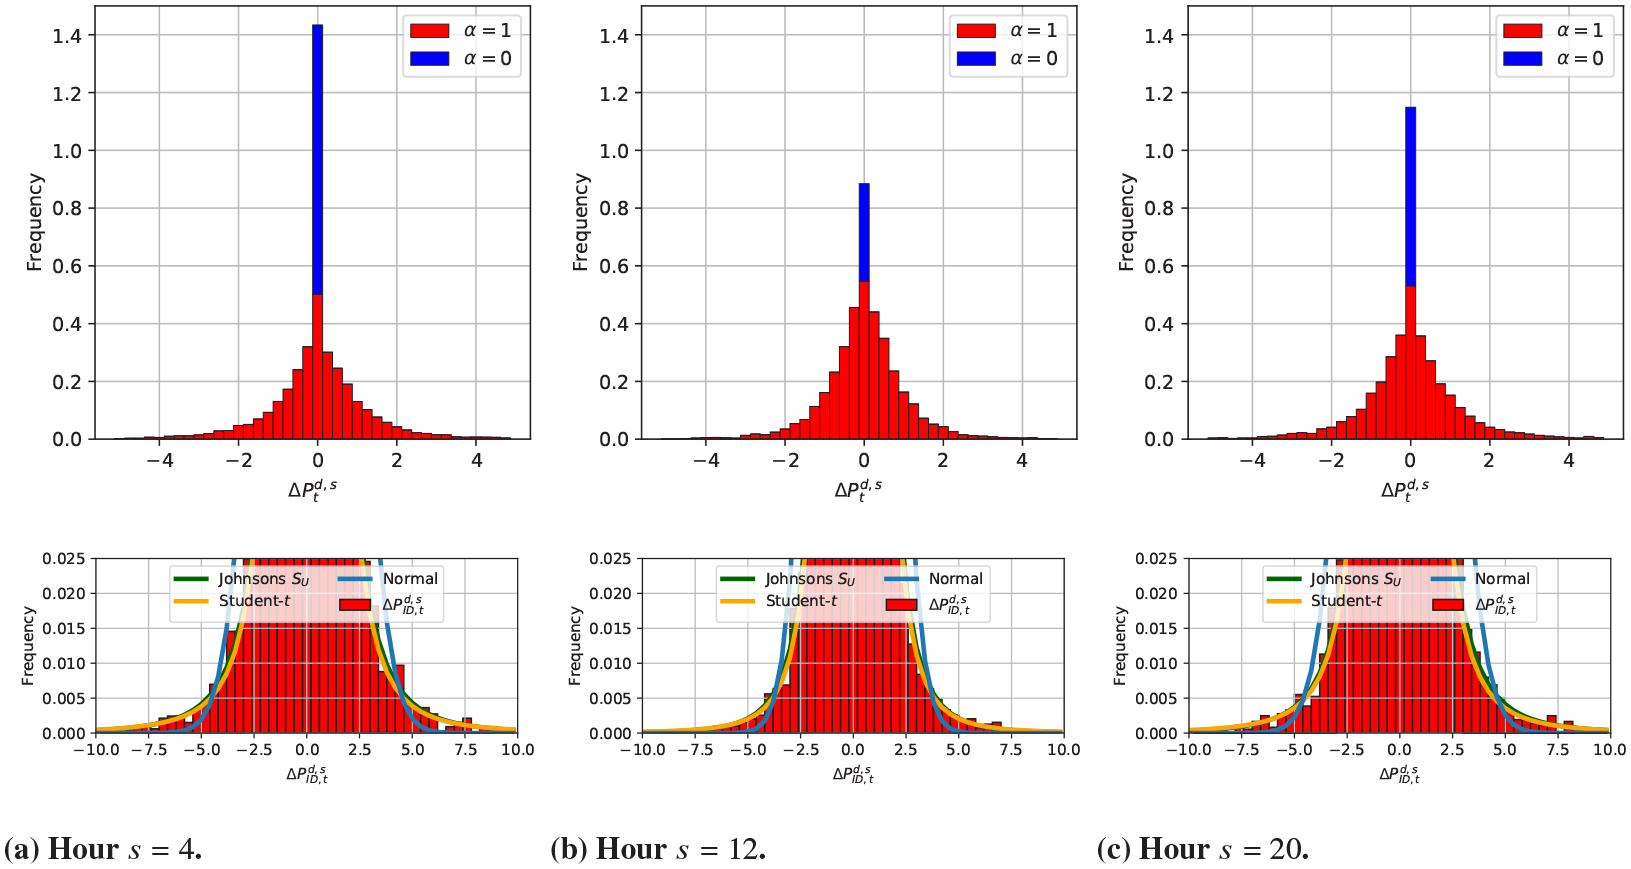
Histograms of
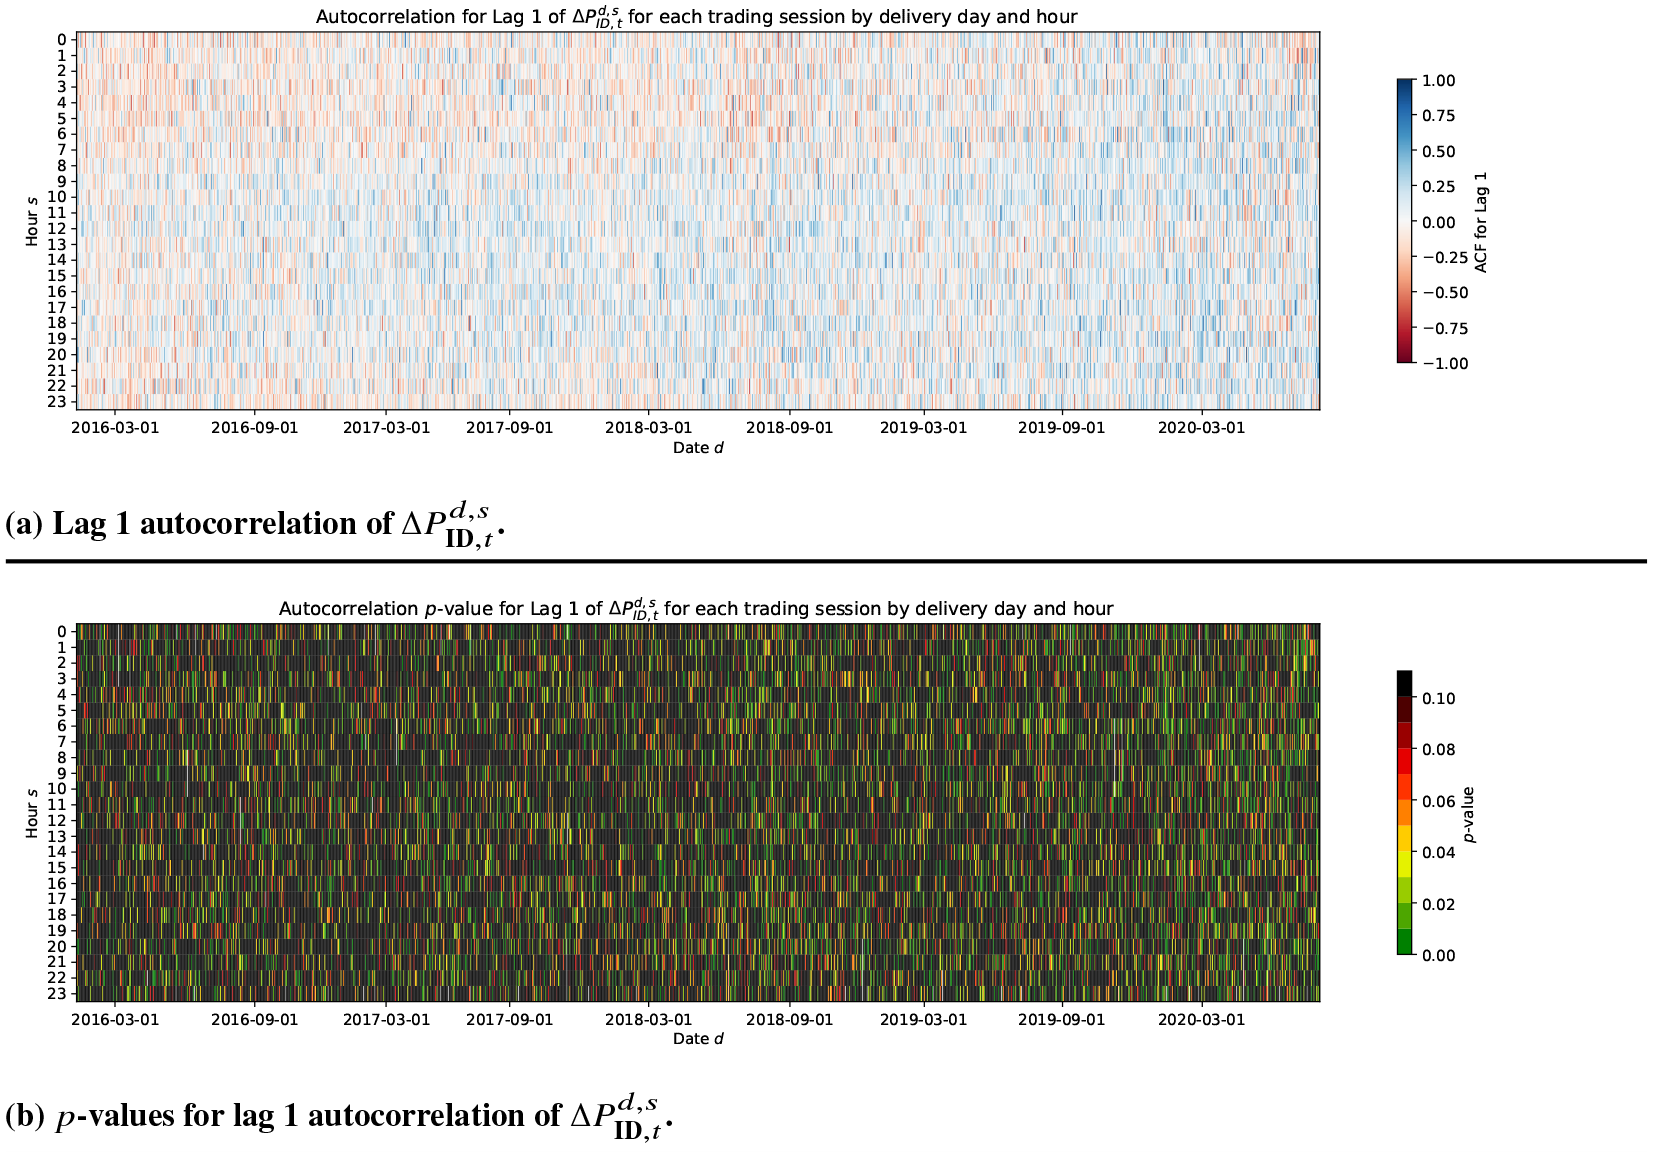
Autocorrelation of
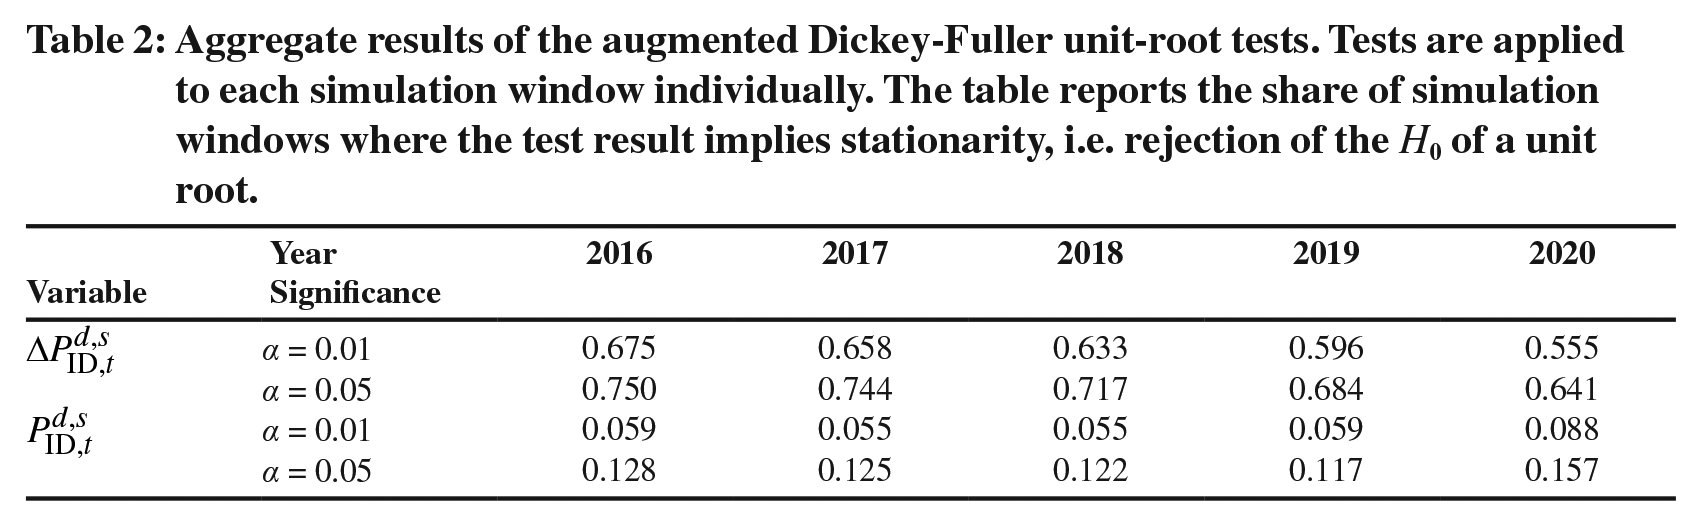
To analyze the stationarity properties of the differenced and un-differenced price series, we apply the augmented Dickey-Fuller test to each simulation window individually and report aggregate results in Table 2. For the majority of the trading windows, we find stationarity of the price differences and unit-root behaviour in the prices. We note though, that due to the heteroskedasticity present in the individual trading windows, the underlying assumptions of the ADF-test might be violated. Together with the results of Löhndorf and Wozabal (2022), who aggregate trades in the intraday market on a 1-hour grid and report similar results for the ADF-test at the
Aggregate results of the augmented Dickey-Fuller unit-root tests. Tests are applied to each simulation window individually. The table reports the share of simulation windows where the test result implies stationarity, i.e. rejection of the
3.2 Renewables Forecasts and Outages
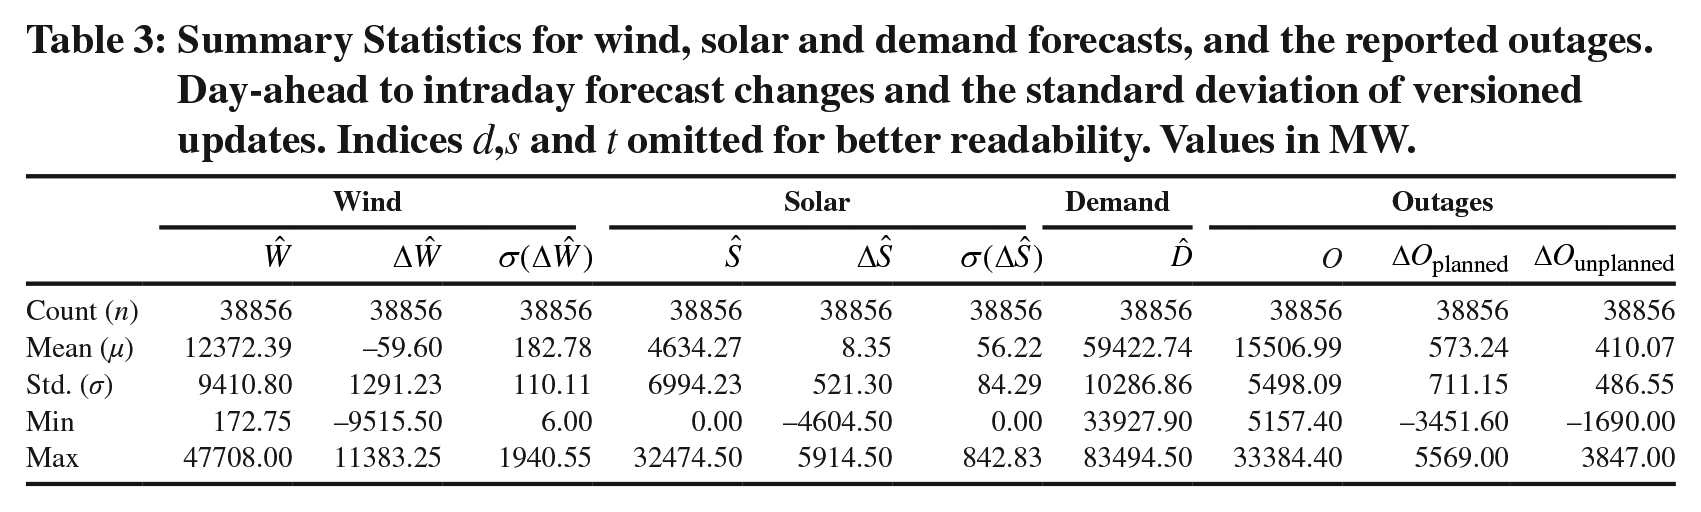
Intra-daily updated renewable production forecasts used in this paper are provided by Statkraft Markets and generated by energy & meteo systems GmbH (2020). Day-ahead demand / system load forecasts are obtained from ENTSO-E (2021). The forecasts have a 15-minute delivery period resolution and denote the expected produced power by all assets of the respective technology in Germany in MW. Forecasts are sampled to hourly frequency using a simple arithmetic average. A new update is available every hour. The first forecast version is issued several days before the delivery day, the latest version usually after the end of the delivery period due to ex-post updates. Let
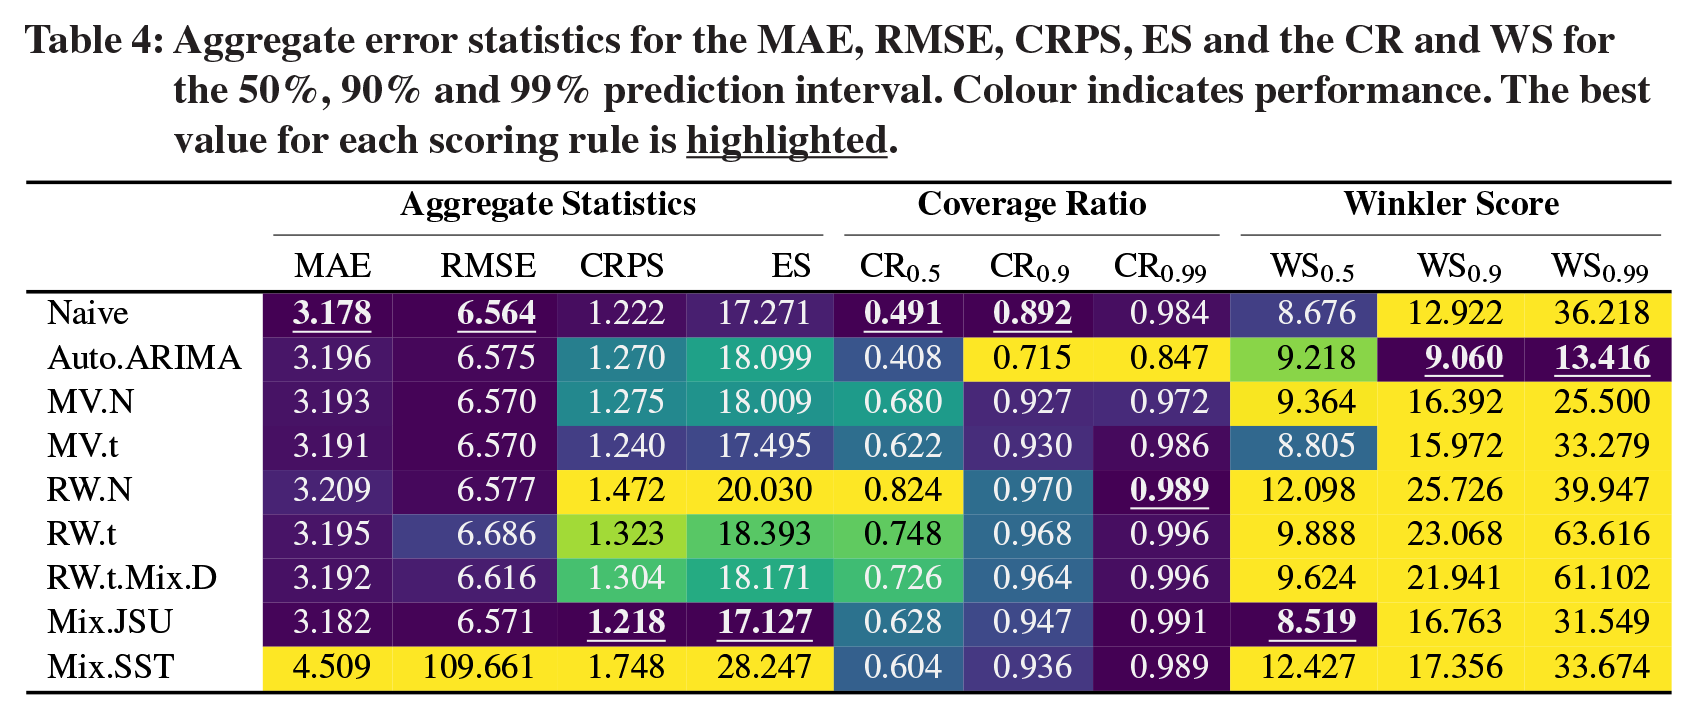
Forecasts for demand are not updated as regularly, hence intraday-updates are not considered in this paper. We denote demand forecasts as
An initial analysis showed that individual forecast updates immediately before the start of the simulation carries little predictive power for the whole simulation period of three hours. Therefore, the forecast updates are aggregated. We consider two aggregated measures for forecast changes: first, the aggregated change between the production forecasts at the day-ahead stage and the production forecasts at the start of the simulation. Second, we employ the volatility of all forecast changes between the day-ahead stage and the production forecasts at the start of the simulation. Let us generally define the change between two forecast versions
The day-ahead to simulation forecast update is defined as:
The standard deviation of the forecast updates should reflect the uncertainty about the weather situation. Highly volatile forecast updates are mirrored to starkly changing positions in renewable energy asset portfolios and should thus exercise an influence on the volatility of the price process due to quickly changing demand and supply. Let

be the set of all forecast versions received between the day-ahead auction and the start of the simulation. The difference between two consecutive forecast versions
Analogously,
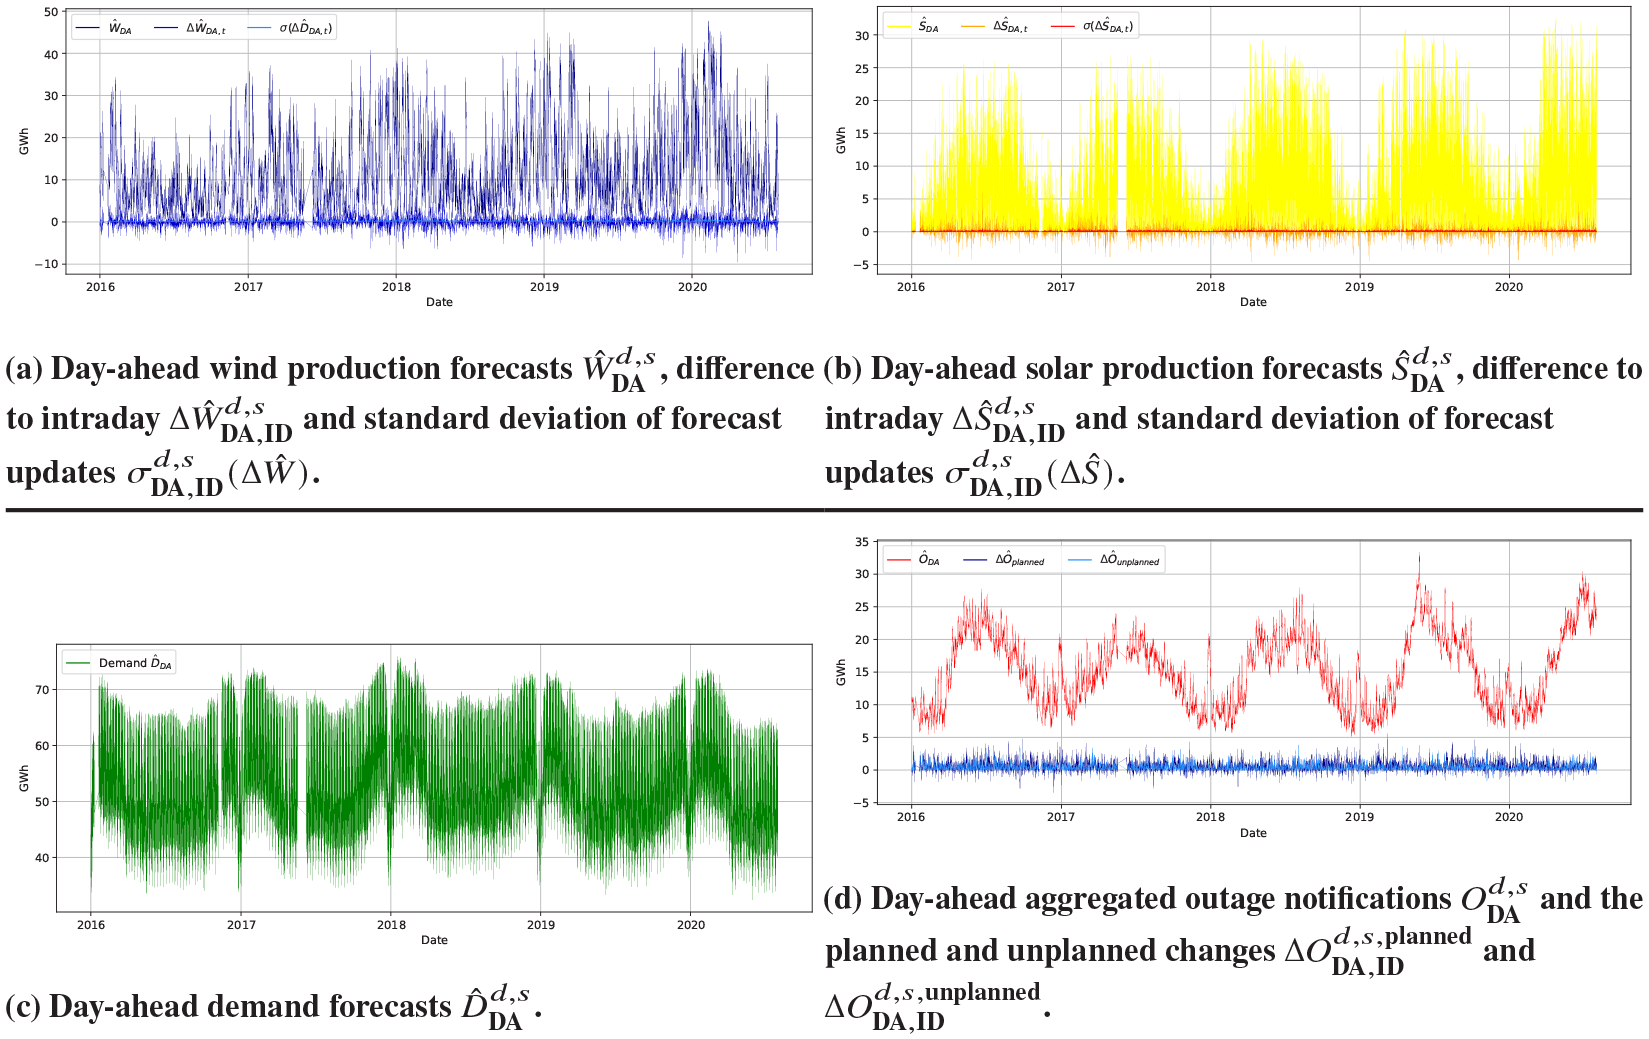
Day-ahead RES production forecasts, forecast updates and their standard deviation and the aggregated outage notifications.
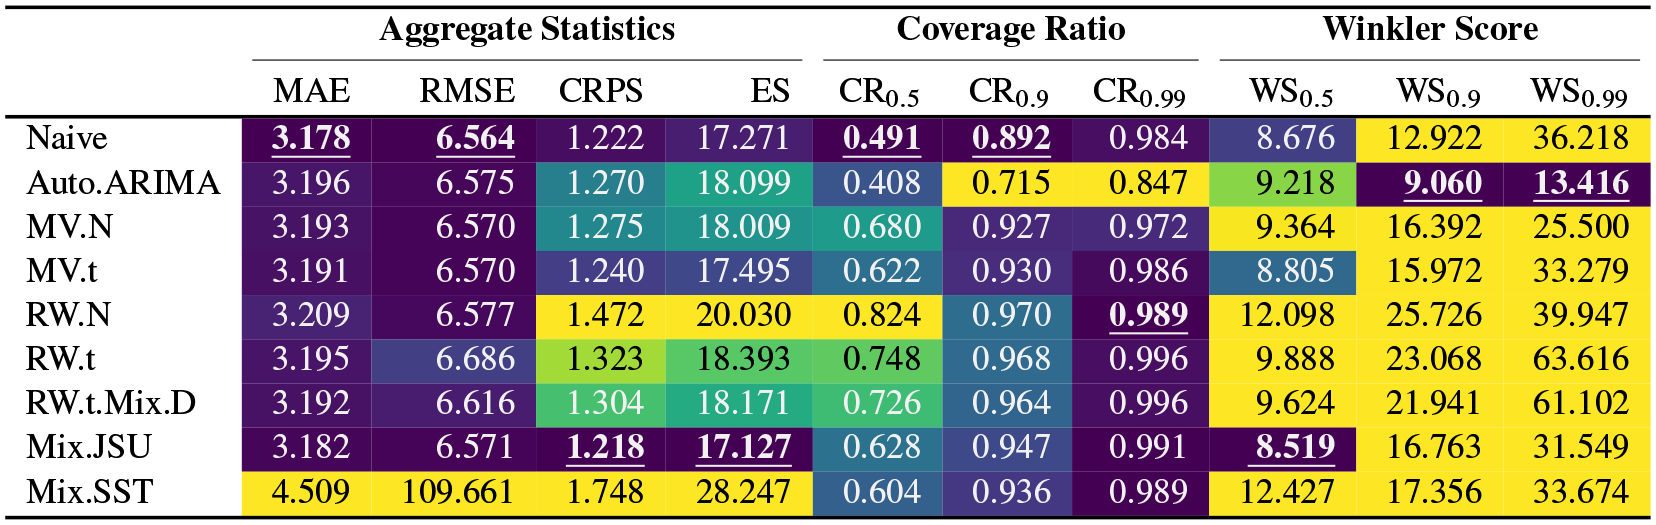
Under the Regulation on wholesale Energy Market Integrity and Transparency (REMIT), market participants are required to report non-availabilities of their assets and make this information available to all other market participants in order to avoid insider trading. In practice, this obligation is fulfilled by market participants by submitting non-availability messages to an inside information platform (European Commission, 2011; Lazarczyk and Le Coq, 2018; Agency for the Cooperation of Energy Regulators (ACER), 2020). We retrieve unavailability messages from the European Energy Exchange (EEX) AG (2020) market transparency platform for all non-availabilities regarding the delivery periods between January 1st, 2016 and July 31st, 2020. A non-availability message is defined by the date of publication, beginning and end of the non-availability, the type of non-availability, i.e. whether it has been planned or unplanned, the fuel type of the unavailable asset as well as the unavailable capacity in MW. The outage messages are aggregated to the total non-available generation capacity for the delivery period
Summary Statistics for wind, solar and demand forecasts, and the reported outages. Day-ahead to intraday forecast changes and the standard deviation of versioned updates. Indices
Aggregate error statistics for the MAE, RMSE, CRPS, ES and the CR and WS for the
3.3 Spot Auction Curves and Elasticity
The impact of forecast errors on
There are different methods to model the merit-order used in practice and academia. Fundamental methods as developed by Pape et al. (2016); Gürtler and Paulsen (2018); Beran et al. (2019) are complex, data-intensive and rely heavily on assumptions. For this reason, Kremer et al. (2021, 2020) develop an econometric model based on He et al. (2013) by fitting the relationship between demand forecasts and day-ahead prices to an exponential function. This yields an analytically traceable function, whose slope can easily be calculated as the first derivative. This paper develops a further method to derive the slope of the merit-order by using the day-ahead auction curves as a proxy for the supply stack. This approach is based on Balardy (2022) and Kulakov and Ziel (2020) and has three advantages compared to the approach of He et al. (2013): First, the auction curves combine all market and availability information available on
However, it is also important to discuss the drawbacks attached to modelling the intraday merit-order based on day-ahead information in general and attached to the auction curves especially. First, the available generation capacity can (and due to RES will) change between
The intuition behind the transformation of the auction curves is outlined in detail in Kulakov and Ziel (2019) and Coulon et al. (2014), so here only a brief introduction is given. Figure 8a shows that the demand curve at the day-ahead auction is elastic, which is at odds with the common assumption of few price elastic consumers of electricity, especially at short notice (Knaut and Paulus, 2016; Coulon et al., 2014). However, producers and consumers have the chance to sell/purchase their energy not only on the spot auction, but also in the OTC and derivative markets. In addition, there might be market participants that own both assets on the supply and demand side. Thus, arbitrage opportunities between the two markets arise that can be used by the trader. Coulon et al. (2014) and Kulakov and Ziel (2019) consider this effect by flipping the elasticity from the demand curve to the supply curve, hence obtaining a perfectly inelastic (vertical) demand curve and an elastic supply curve to incorporate those effects. The core idea here is that, at the day-ahead auction, placing a buy order for a volume
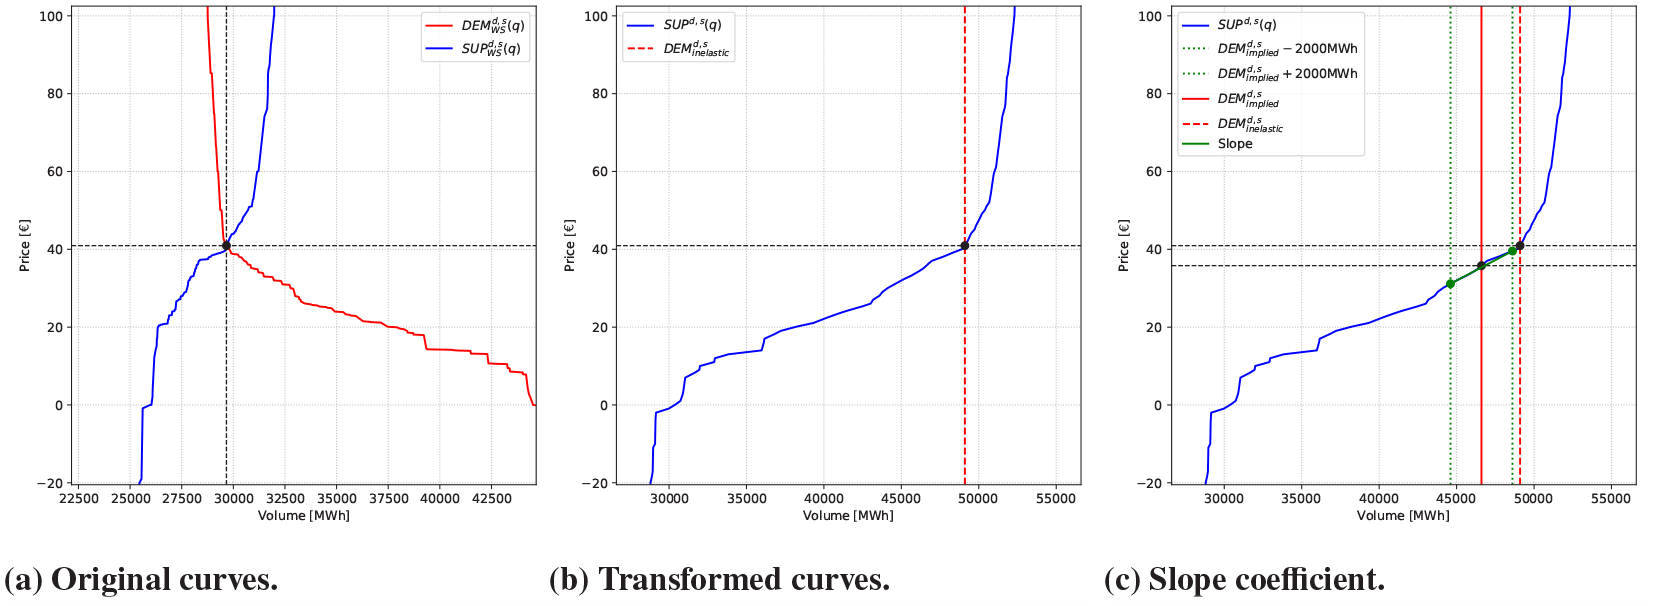
Transformed auction curves for June 1, delivery hour
Figure 8 shows the supply and demand curves from the spot auction for the delivery day June 1st, 2017 for hour

As the curves are monotonic,
Under the assumptions that the merit-order does not change significantly between dayahead and intraday and that the transformed supply curve is a reasonable proxy for the merit-order, the the implied intraday demand and the slope coefficient for the merit-order can be derived. The first assumption is implicitly already made by Kremer et al. (2021, 2020). The second assumption is discussed above. The last known 5-minute-interval-VWAP before the start of the simulation is

where
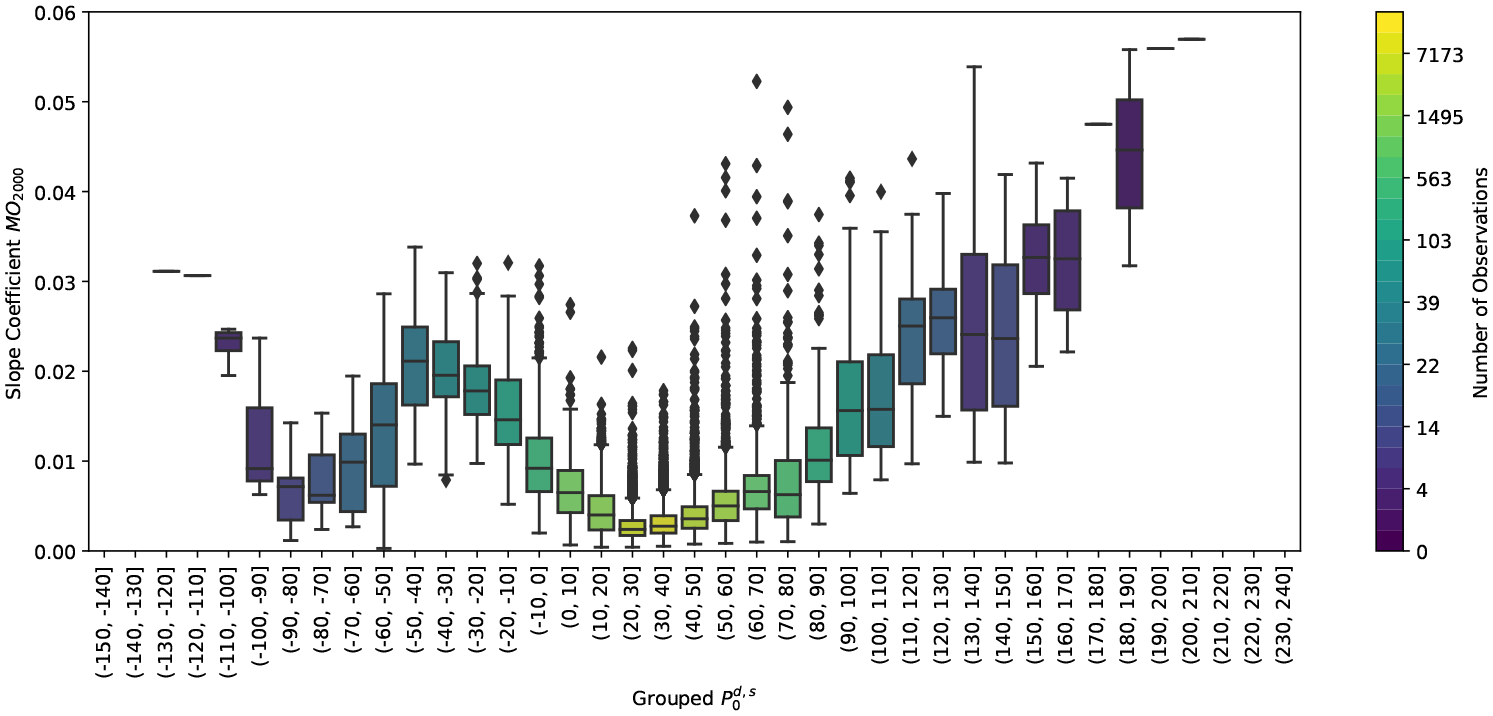
Boxplots for the merit-order slope
4. Electricity Price Models
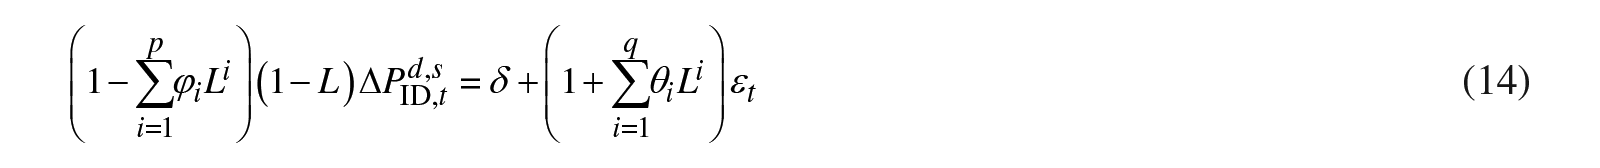
Recall from the introduction that the price differences

with the Dirac distribution
Model the probability
Model the distribution
This introduces a dependence structure between the parameters of
4.1 Logistic regression model for
The binary variable

for the Bernoulli variable

where

where
Here, the logit function for
where
4.2 GAMLSS Framework
This chapter briefly introduces the GAMLSS-framework used to model

The GAMLSS is an extension of the Generalized Additive Models (GAM) introduced by Hastie and Tibshirani (1987, 1990). It allows to model not only the expected value of the variable

where each of the distribution parameters can be a smooth function of the explanatory variables. We denote as

For each

where


We use
Ziel and Muniain (2021) extend the GAMLSS framework to allow for regularized LASSO estimation. As with the logistic model, we employ the BIC to select the optimal shrinkage parameter
with the weights vector
Let us now relate the abstract notation
For each distribution parameter
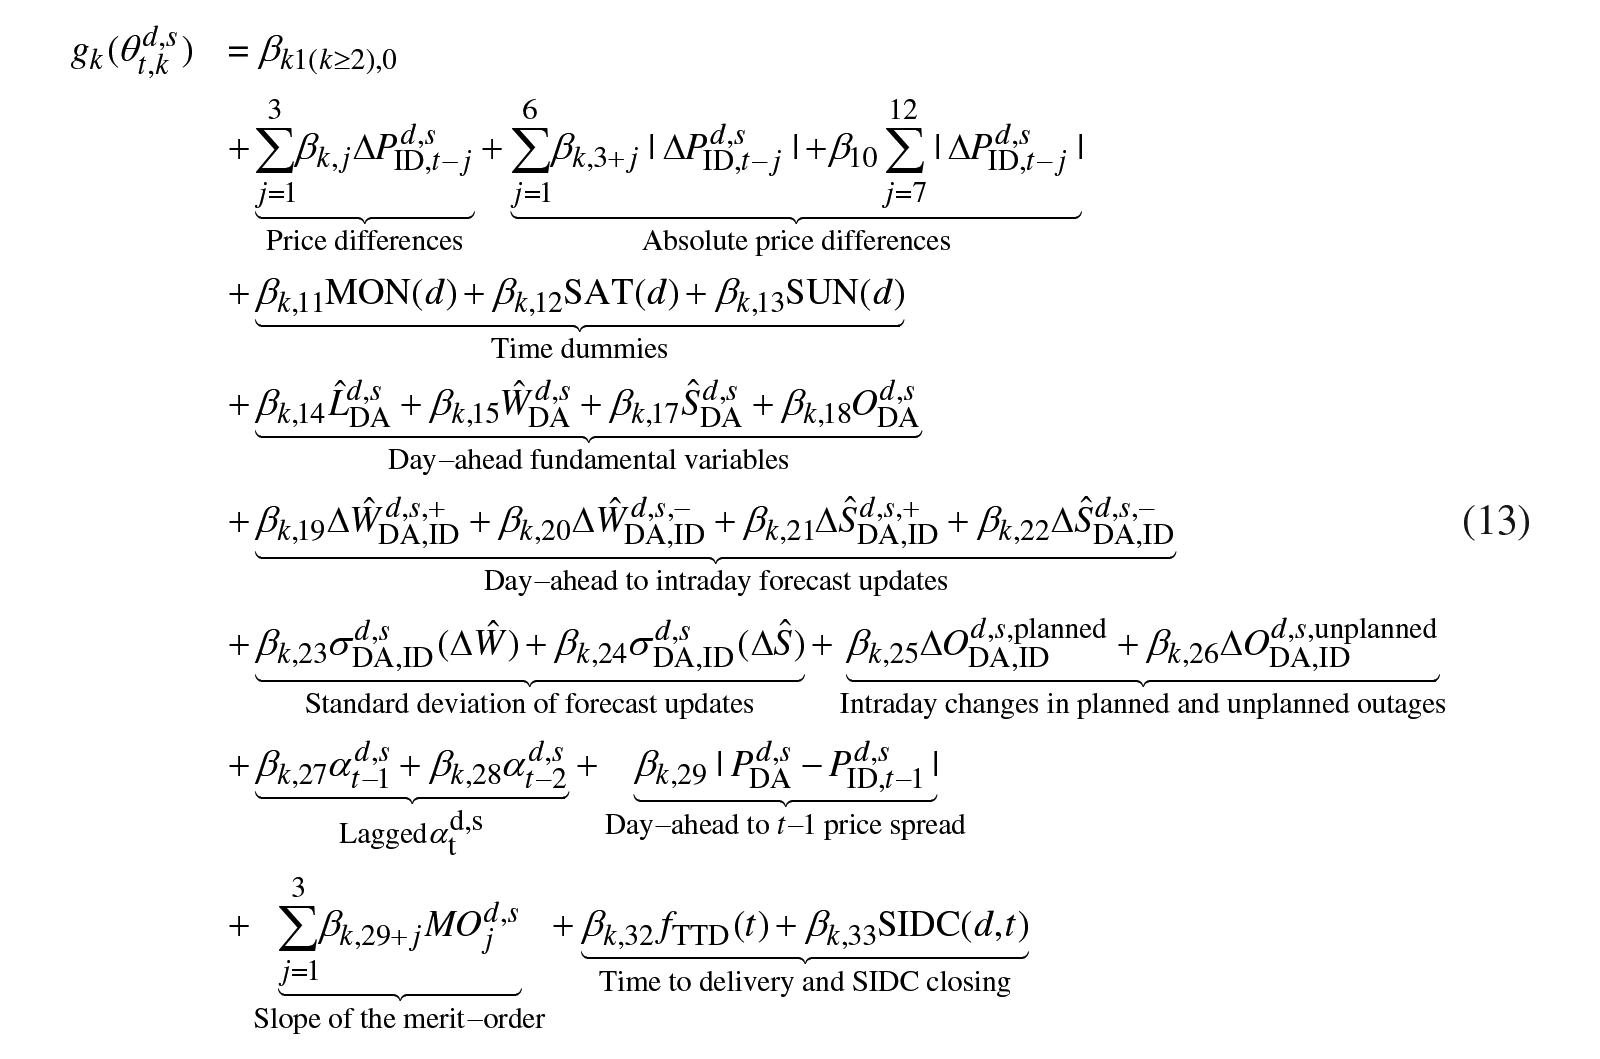
for
4.3 Benchmark Models
Lastly, some simple benchmark models are introduced. Even though the main focus of this paper is on modelling the volatility and its influencing factors, simple benchmarks can serve as a valuable comparison to identify potential areas for model improvement. As our study shares the conceptual set-up with Narajewski and Ziel (2020b), it is natural to employ similar benchmark models. Additionally, we compare our approach to classical time series methods such as AutoRegressive Integrated Moving Average (ARIMA) models. The following section introduces these models in more detail.
Narajewski and Ziel (2020b) introduce six simple benchmark models to evaluate the value-added by more complex models, briefly described in the following. For the exact specification we refer the reader to their work.
The
For
The
The closeness of intraday electricity markets to traditional equity markets invites the use of classical time series models as benchmark. However, some attention to the unique time-structure of the intraday market is necessary: As already noted in Section 2, for all delivery periods
The classic
is an
5. Forecasting Study and Evaluation
5.1 Study Design and Simulation Algorithm
We employ the well-known rolling window forecasting study design, which is common in energy price forecasting (see e.g. Ziel et al., 2015; Gianfreda and Bunn, 2018; Nowotarski and Weron, 2018; Janke and Steinke, 2019; Uniejewski et al., 2019; Narajewski and Ziel, 2020b). This setting reduces the impact of structural breaks within the data and ensures a robust setting for the comparison of predictive performance using the DM-test (Diebold and Mariano, 2002; Diebold, 2015). The scheme is visualized in Figure 10. We train one model for each delivery hour on 365 days of in-sample data and issue forecasts for the next delivery. Subsequently, the training data set is shifted forward by one day, the models are re-trained for each delivery hour and forecasts are issued for the next day and henceforth. Keeping the length of the training set constant we thus move through the test set. Our full data set ranges from January 2016 to August 2020, holding in total
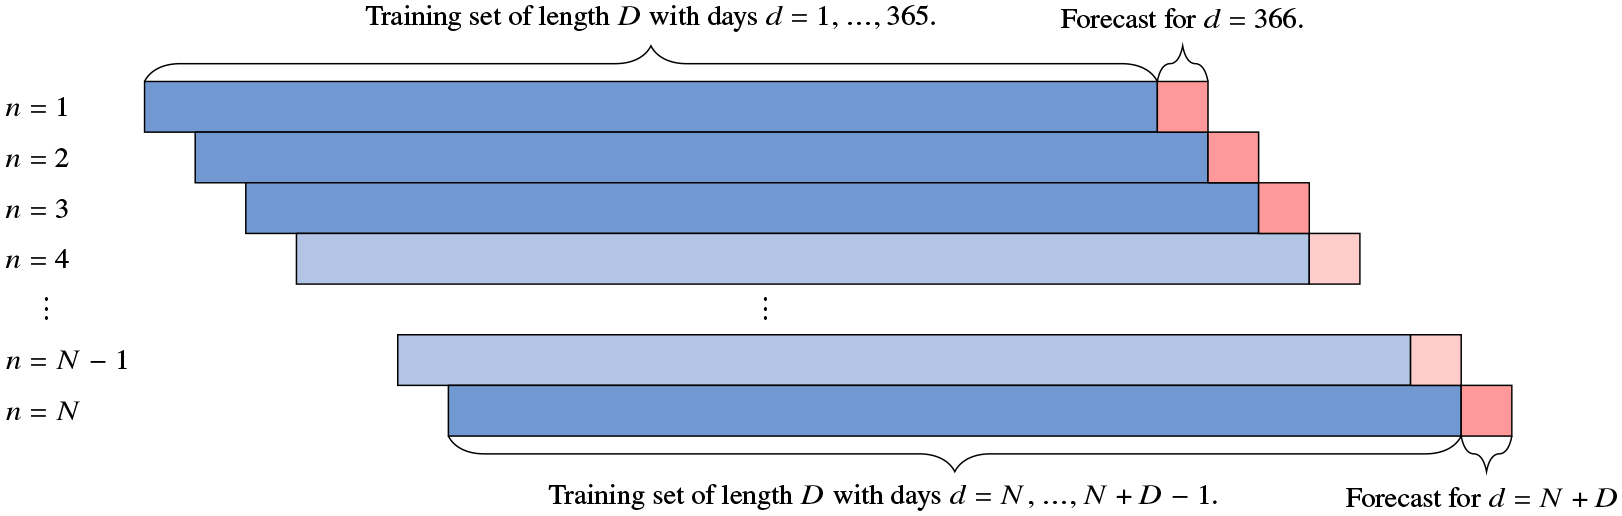
Structure of the rolling window forecasting study. Blue denotes in-sample data, red denotes the out-of-sample forecast.
Forecasts are issued for all delivery hours

The algorithm is visualized in Figure 11. The estimates for
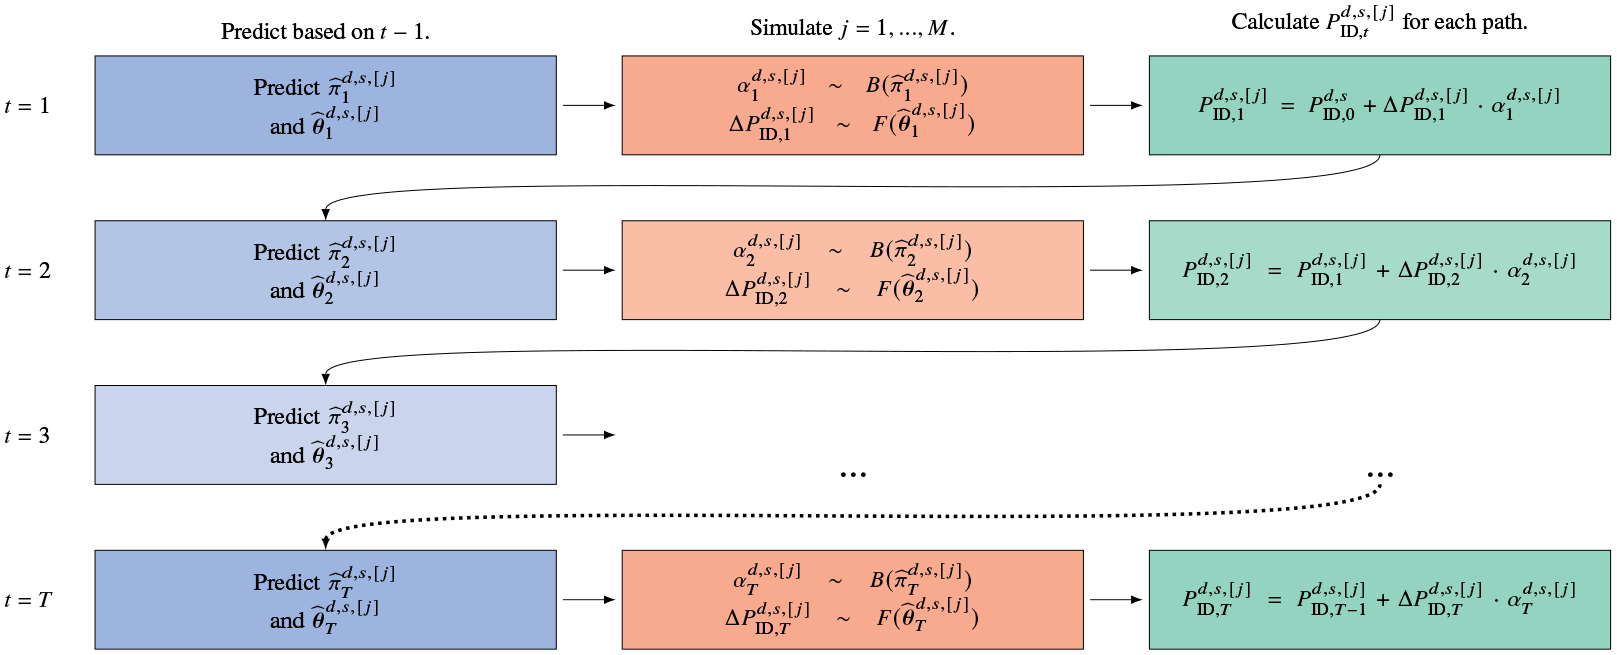
Simulation Algorithm. After
5.2 Forecast Evaluation
The mean and median trajectory are evaluated using the Root Mean Squared Error (RMSE) and Mean Absolute Error (MAE) respectively. For the probabilistic evaluation of the generated scenarios the Energy Score (ES), Continuously Ranked Probability Score (CRPS) and the empirical coverage ratio are used. Additionally, the Winkler-Score (WS) is used to evaluate the coverage of an
Formally, the RMSE and MAE are defined as:

and:

For an
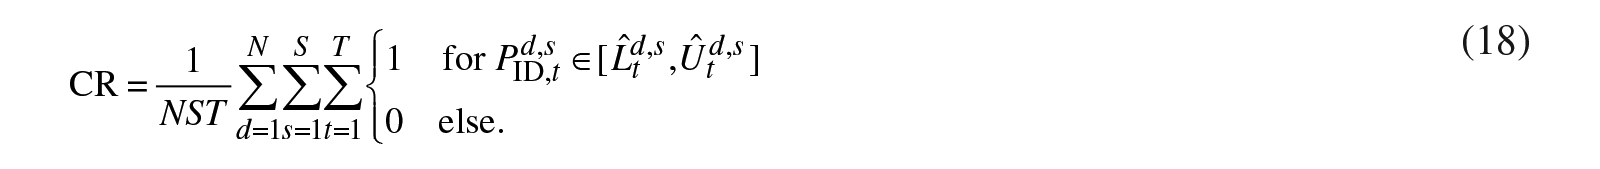
The
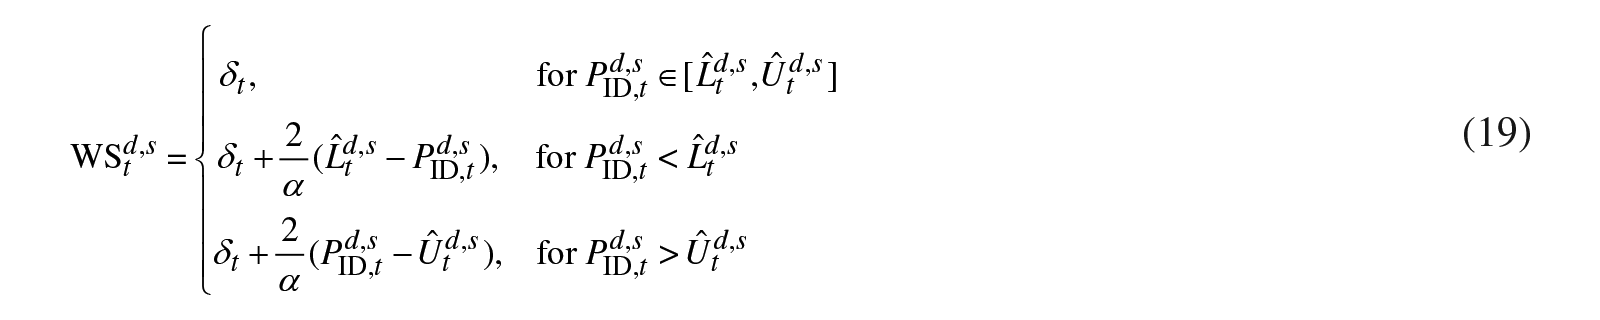
and aggregated as:

For both, CR and WS, the upper and lower bounds of the
The CRPS (see e.g. Gneiting and Raftery, 2007;Nowotarski andWeron, 2018) is approximated by thePinball-Score (PB)

for a dense equidistant grid of probabilities

The overall CRPS is calculated by the average:

The pinball loss is also used to evaluate the performance of different models in specific quantile levels. For this reason, the PB is aggregated as follows:

To measure the quality of the generated paths, Narajewski and Ziel (2020b) propose the ES. It is a generalization of the CRPS for two dimensions. Thereby, not only the approximation of the marginal distribution is evaluated, but also the generated multivariate distribution (Gneiting and Raftery, 2007; Ziel and Berk, 2019):

The average yields the overall energy score for each model:

The aforementioned measures provide insight in the accuracy of different forecasting models. To evaluate the statistical significance of the difference in forecast accuracy of two models

For example, for the ES and the Naive model, the loss vector
We test the loss differential series for stationarity using the augmented Dickey-Fuller (ADF) test (Dickey and Fuller, 1979, 1981) and reject the
6. Results
The following chapter presents the results of the forecasting study. It is split into two parts: First, we show the error metrics for the out-of-sample analysis. Additionally, we show the in-sample coefficients for the model using Johnson’s
6.1 Out-of-sample Analysis: Forecasting Performance on Test Data
First, the aggregate error statistics will be presented, followed by the scoring rules considering the marginal fit relative to the time to delivery and the quantile range
The
Figure 12 shows the ES relative to the delivery hours
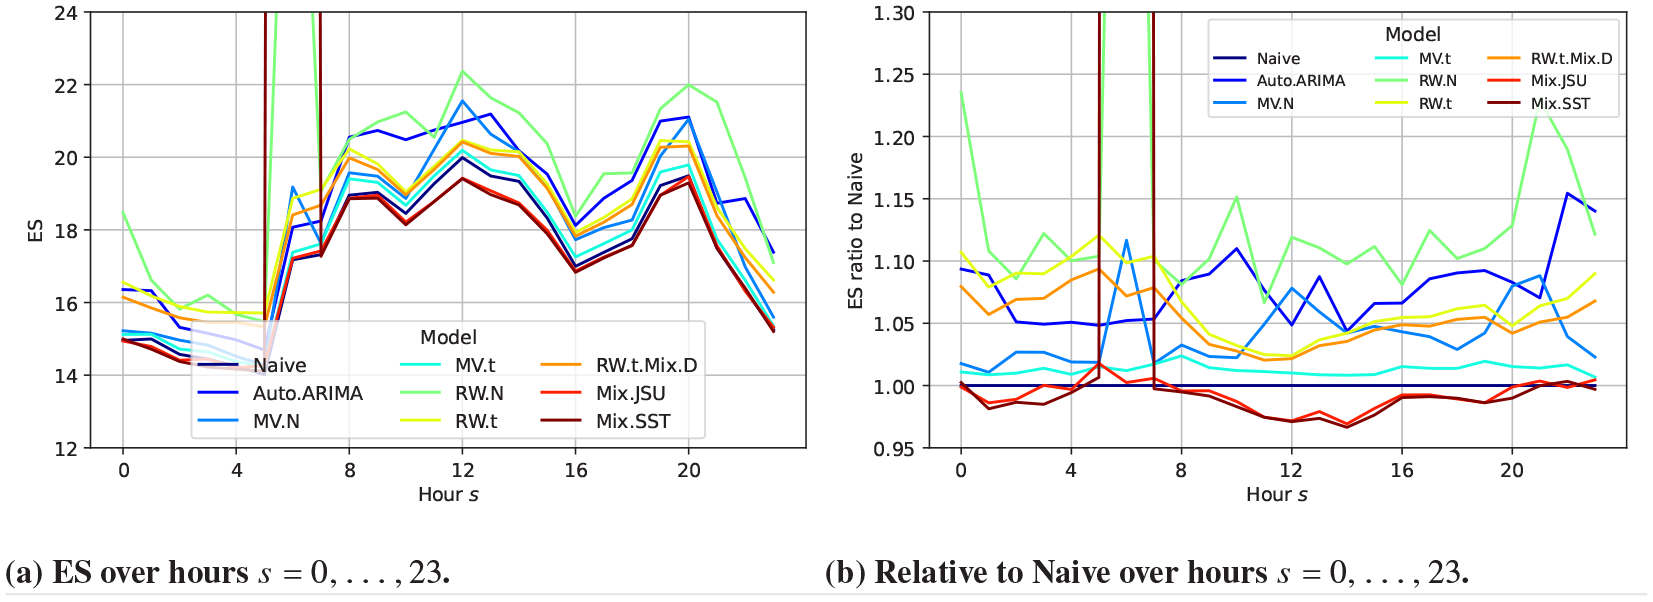
Plot (a) shows the ES and (b) its ratio to Naive over the delivery hours
The PB over
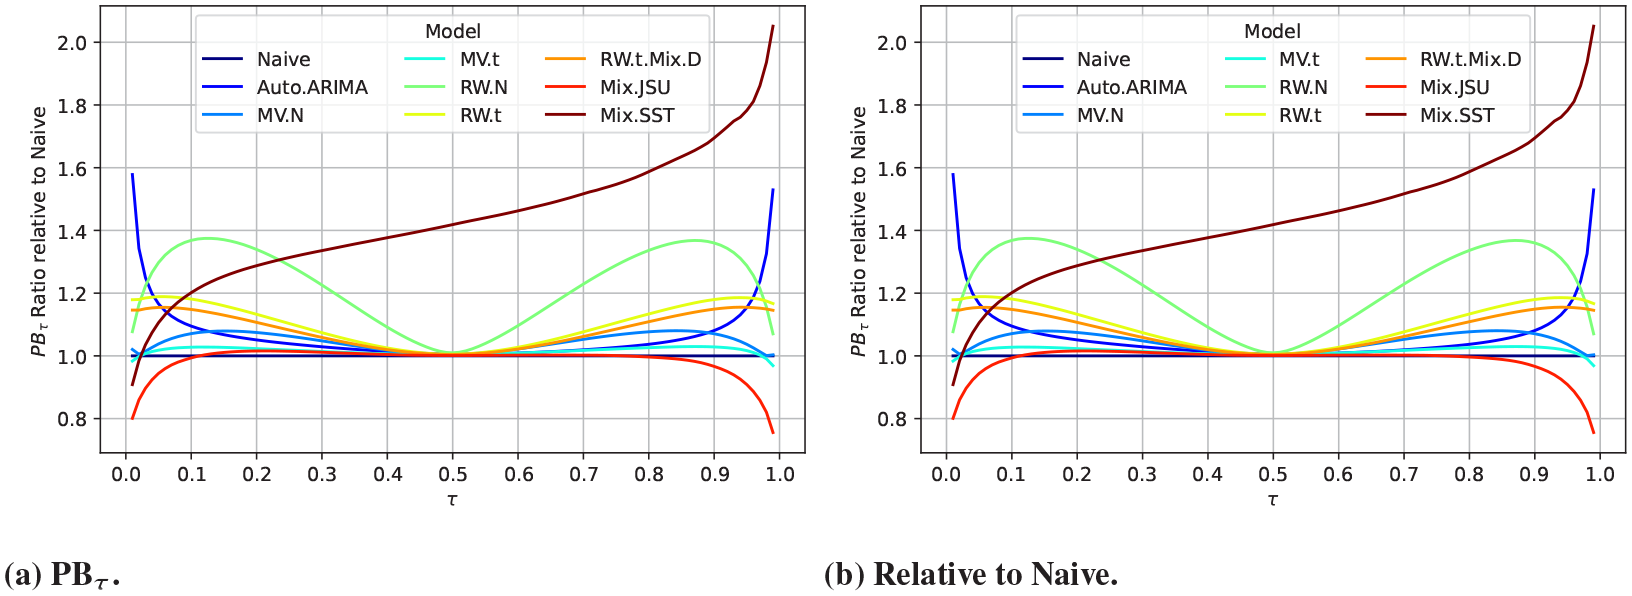
Plot (a) shows the
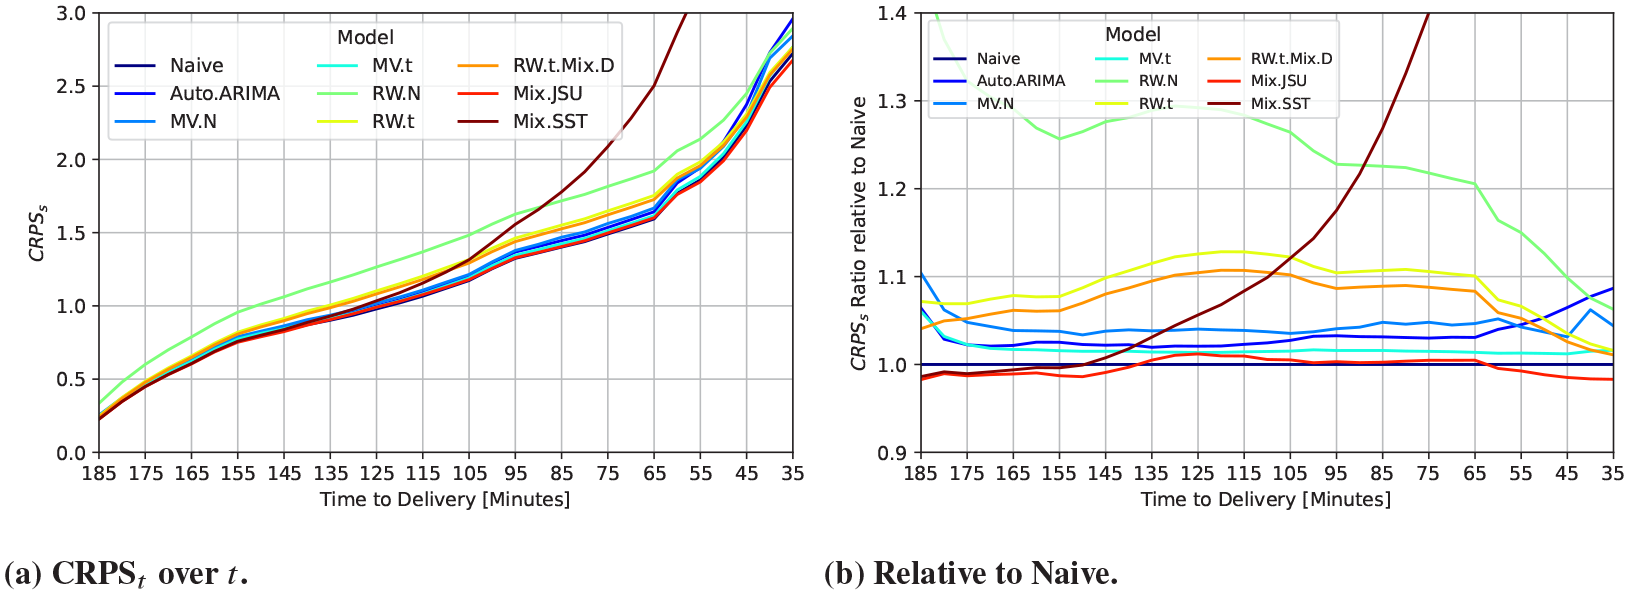
Plot (a) shows the CRPS and (b) its ratio to Naive over the time to delivery.
only from the trading session of interest, before the start of the simulation, as market behaviour changes throughout the session.
The results are largely confirmed as statistically significant by the Diebold-Mariano-Test. Figure 15 shows the
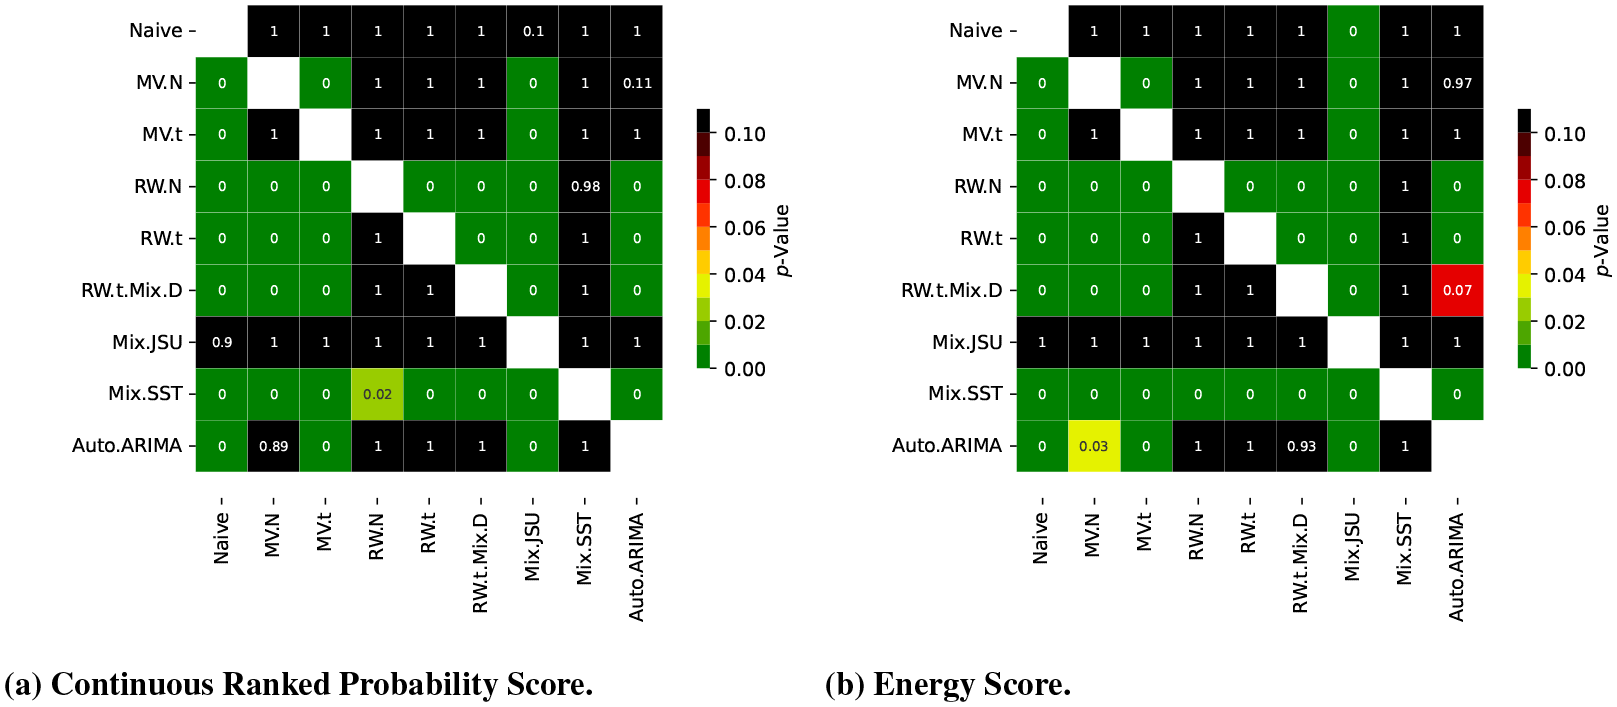
Pairwise
6.2 In-sample Analysis: Estimated Coefficients and their Development
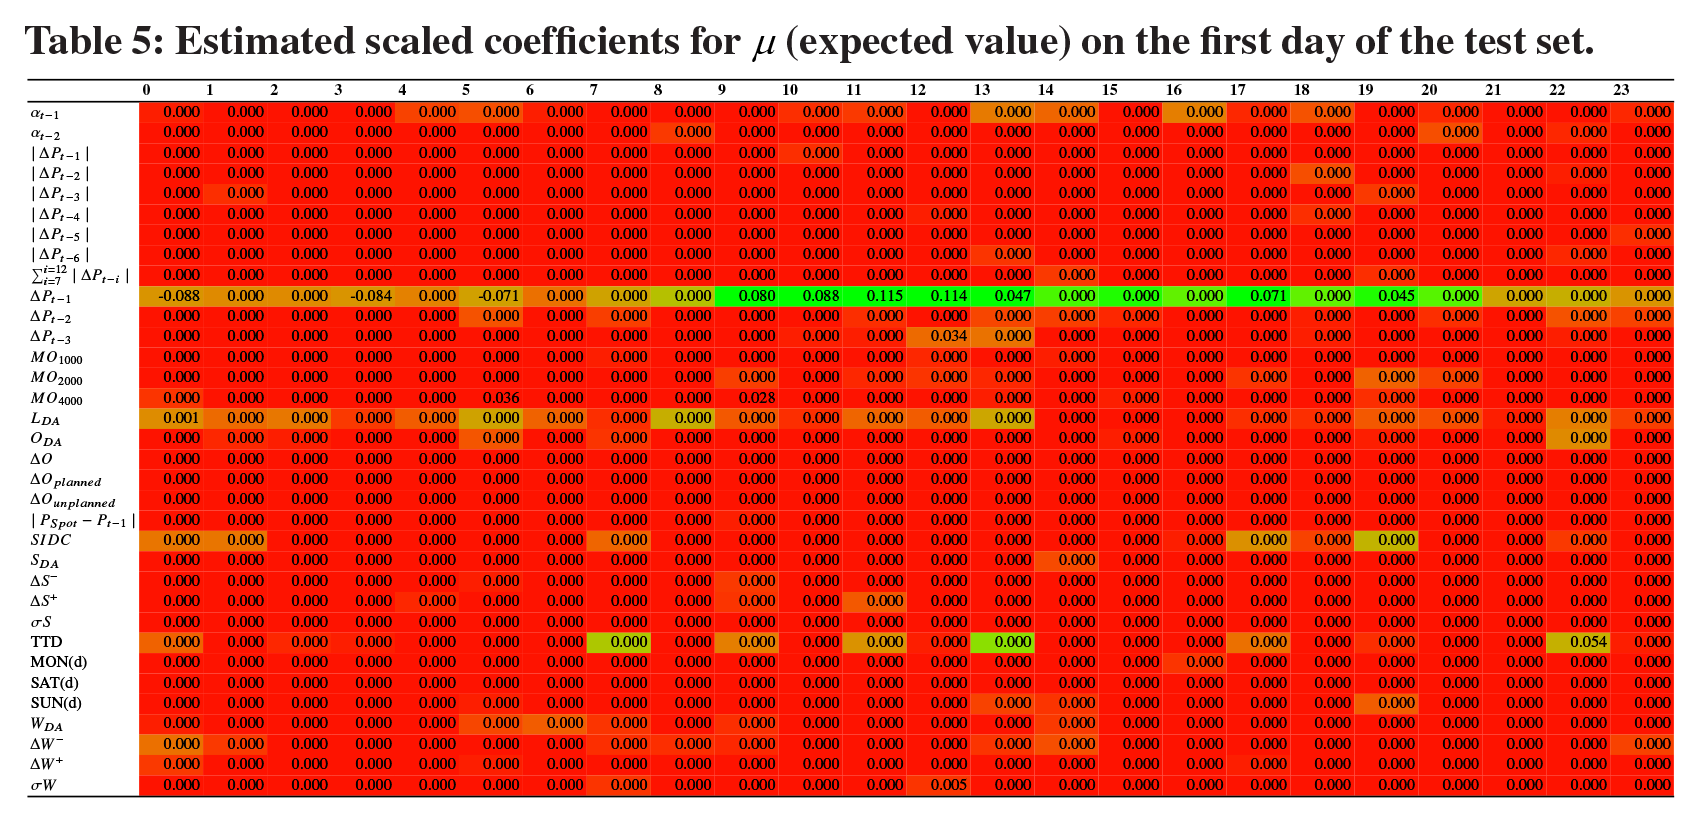
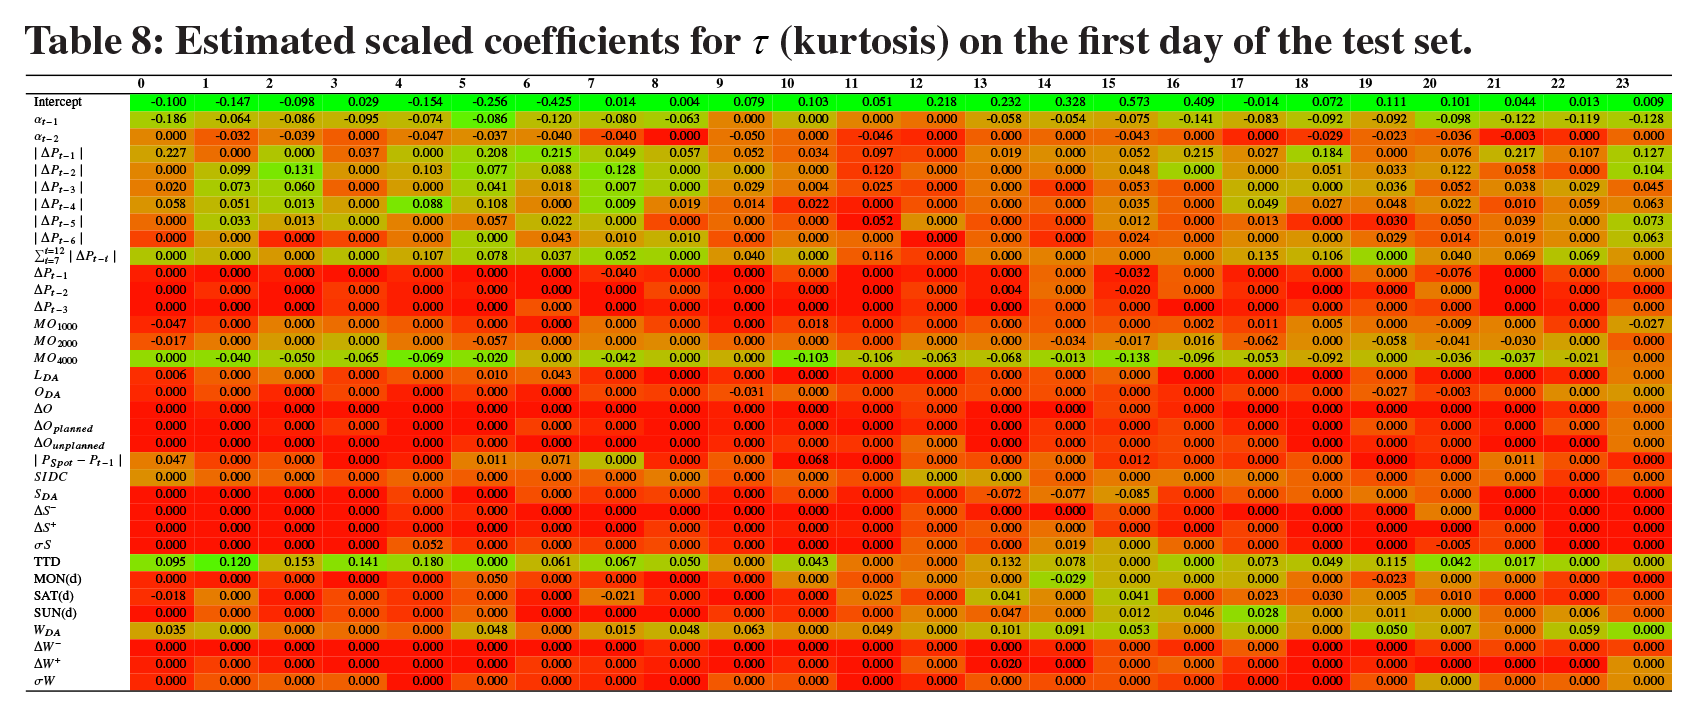
Given the strong probabilistic forecasting performance of the Mix.JSU we turn to an in-sample analysis of the estimated coefficients. Compared to black-box deep learning algorithms, the parametric GAMLSS framework used in this paper allows for explainable machine learning by quantitatively and qualitatively analysing the estimated coefficients. Hence, we can gain further insight in the driving variables for all distribution parameters. Tables 5 to 8 present the estimated scaled coefficients for
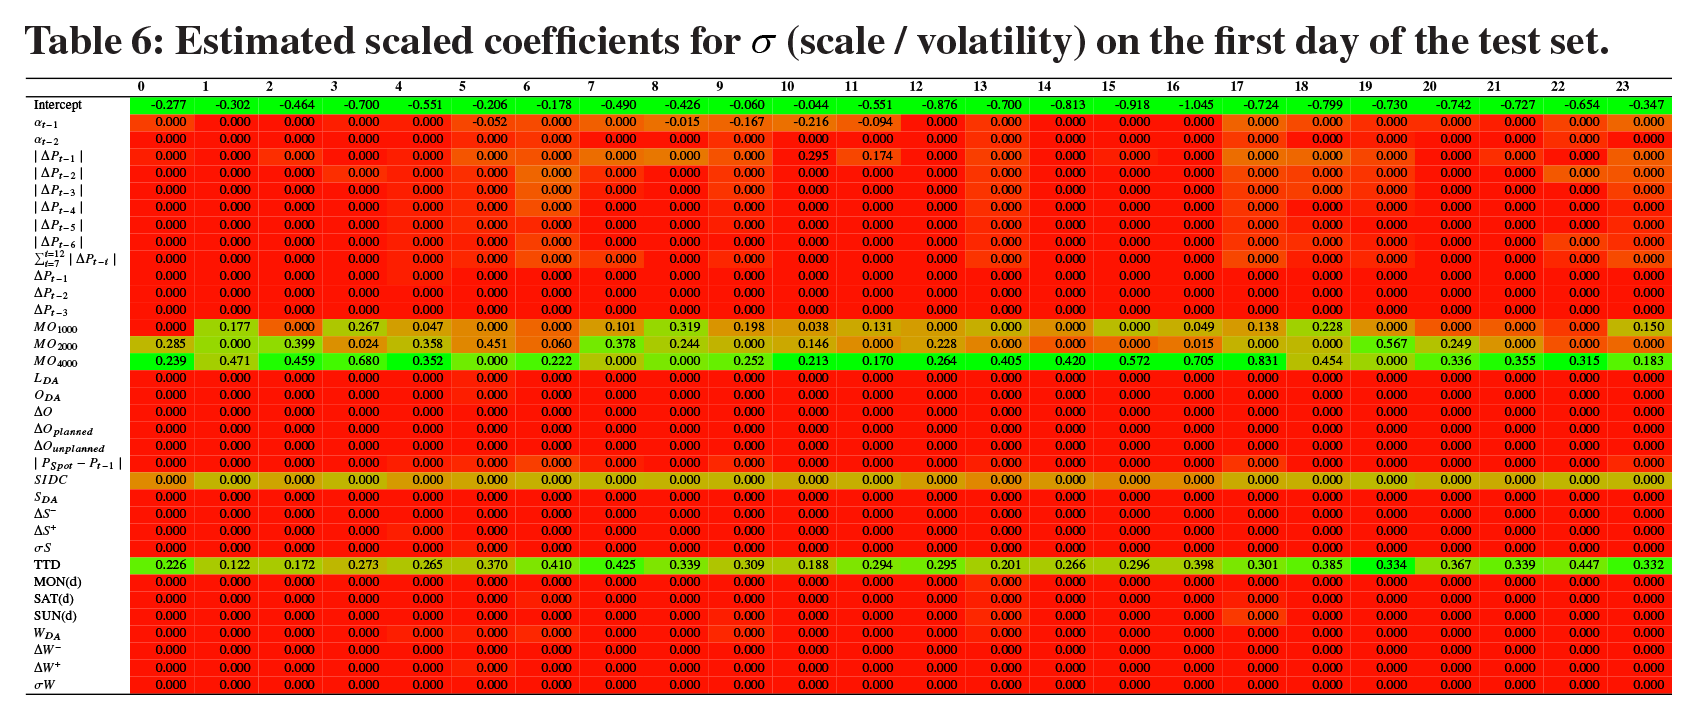
Estimated scaled coefficients for
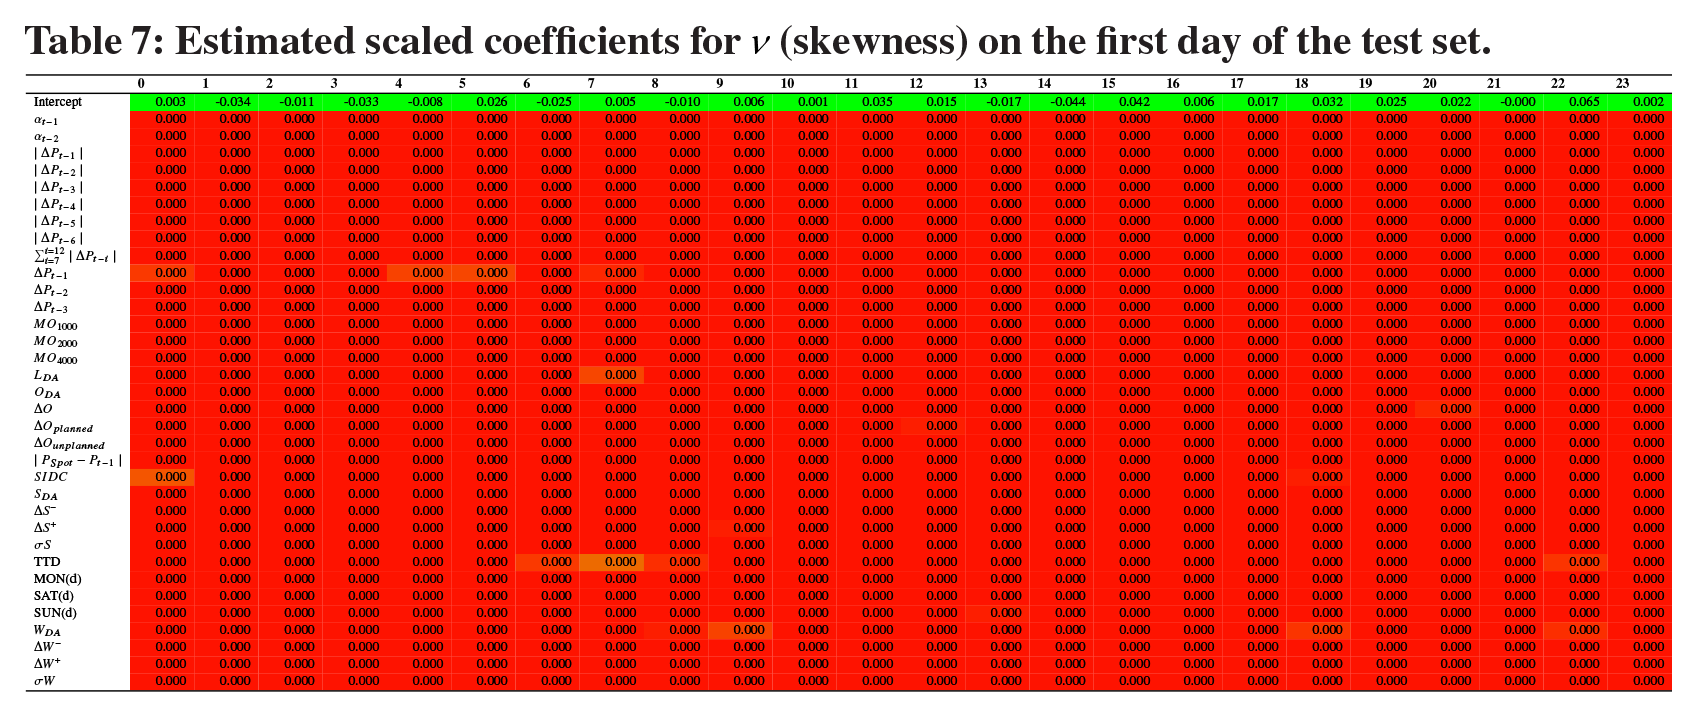
Estimated scaled coefficients for
Estimated scaled coefficients for
Estimated scaled coefficients for
For
For the volatility
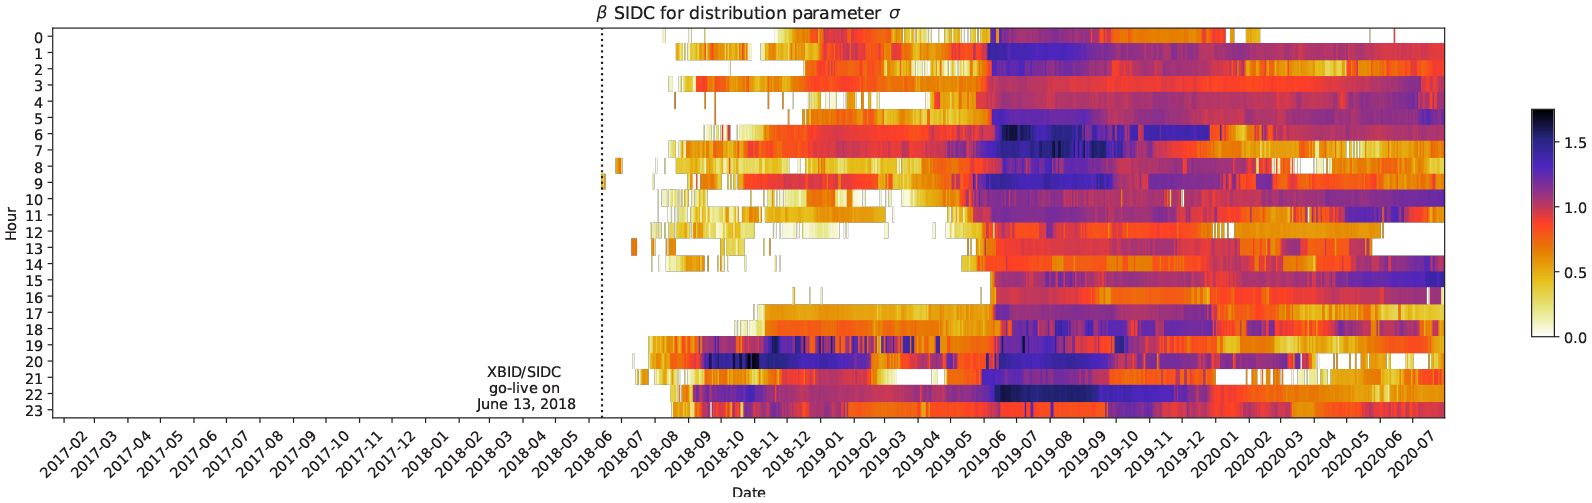
Estimated coefficients for the SIDC dummy across the test set.
For the skewness parameter
Lastly, we turn to Table 8 giving the estimated coefficients for the kurtosis parameter
7. Discussion and Conclusion
This paper develops a simulation-based forecasting model for the intraday price process in the last three hours of each product’s trading window. We expand the key work of Narajewski and Ziel (2020b) in four dimensions by (i) investigating distributions with potential skewness and modelling all moments explicitly, (ii) adding intra-daily forecast updates and (iii) a novel measure for the merit-order slope, derived from day-ahead auction curves, and (iv) employing a regularized estimation using the GAMLSS-LASSO for all distribution moments.
Our results are two-fold: First, we show that the proposed method is able to generate high quality ensembles for the intraday markets, whose predictive performance is significantly better than benchmark models such as random walk or ARIMA-type processes on a wide range of probabilistic scoring rules. The improvement in accuracy is especially distinct in the tails of the predictive distribution. Thus, our results can be applied directly to trading problems as proposed by Serafin et al. (2022) or plugged into any optimization method relying on accurate sampling methods. Second, the GAMLSS framework’s explicit traceability and the regularized estimation allows to draw conclusions on the impact of explanatory variables. Qualitatively, our results for the expected value of the intraday return distribution imply weak-form efficient markets, as the inclusion of additional variables does not improve the prediction of the expected value significantly. Additionally, we find evidence for a merit-order effect in the volatility and kurtosis of the return distribution. A steep merit-order regime leads to higher volatility and heavier tails. What is more, we find that the volatility rises with decreasing time to delivery and jumps with the closure of the pan-European order book sharing (SIDC). On the other hand, the kurtosis is driven by trading-related variables such as trade events and lagged prices. We find however, that the skewness is close to zero for all hours, and that none of the analyzed variables show predictive power.
This paper’s result opens several new research strings: the models used can be improved by the inclusion of cross-product effects and neighbouring products as additional input variables. However, due to the structure of intraday markets with parallel and overlapping trading sessions, this task is non-trivial. A second interesting research avenue is the relationship between trading volume, liquidity and volatility in intraday markets. Further research is also needed to better understand the impact of fundamental variables for modelling the volatility, kurtosis and skewness of the distribution of intraday price returns. The influence of the merit-order shape as explanatory variable for the volatility warrants further research into its modelling for short-term markets.
Footnotes
Appendix A
Appendix B
Acknowledgements
This paper is based on research conducted during a joint project of Simon Hirsch and Statkraft Trading GmbH. Simon Hirsch is grateful to Statkraft, especially Patrick Otto, Dr. Konstantin Wiegandt and Dr. Daniel Gruhlke for the support received. The authors are grateful to energy & meteo systems GmbH for providing the forecasts used in the paper. The views and opinions expressed in this paper are the author’s own and do not reflect the views of Statkraft Trading GmbH or energy & meteo systems GmbH. The authors are grateful to helpful discussions at the 30. GEE Doctoral Workshop and at the International Ruhr Energy Conference (INREC) 2022.
Data Statement
Due to the commercial nature of production forecasts the dataset remains confidential and cannot be shared.
Declaration of Interest
Simon Hirsch is employed by Statkraft Trading GmbH. The authors declare no conflict of interest.
Notes
References
Supplementary Material
Please find the following supplemental material available below.
For Open Access articles published under a Creative Commons License, all supplemental material carries the same license as the article it is associated with.
For non-Open Access articles published, all supplemental material carries a non-exclusive license, and permission requests for re-use of supplemental material or any part of supplemental material shall be sent directly to the copyright owner as specified in the copyright notice associated with the article.