
Abstract
Using the difference-in-differences method combined with the propensity score matching, this study identifies the causal relationship between high-speed rail (HSR) and energy productivity in China. Furthermore, we investigate the mechanism through which HSR affects energy productivity, as well as the heterogeneity of the impact across quantiles and distances. The results show that HSR connection contributes to the improvement of energy productivity. This finding is consolidated after a potential endogeneity problem is addressed using the instrumental variable method and a variety of potential confounders are controlled through a series of robustness checks. On average, the marginal impact of HSR on energy productivity is approximately 9%. Moreover, HSR connection cannot be completely substituted by traditional railway and aviation in improving energy productivity. The heterogeneity analysis suggests that the positive energy productivity effect of HSR gradually decreases with an increasing distance to the nearest HSR station. In addition, HSR network accessibility has a significant positive effect on energy productivity, while technological innovation mediates the relationship between HSR development and energy productivity. We propose that to achieve the long-term improvement of energy productivity, policymakers should comprehensively consider both transit-oriented development and ecology-oriented development modes.
Keywords
1. Introduction
The effects of high-speed rail (HSR) on the economy and productivity have received substantial attention from economists. However, no consensus has been reached about whether HSR is conducive to economic and productivity growth, especially in developing countries. Some studies argue that investments in HSR transportation infrastructure have led to a redistribution of economic factors among different regions in Europe (Albalate and Bel, 2012; Puga, 2002; Rodríguez-Pose and Fratesi, 2004; Sánchez-Mateos and Givoni, 2012). Other studies suggest that an expanding HSR network has the potential to improve cities’ economic growth and productivity (Ryder, 2012; Ke et al., 2017).
Rail transport is more energy-efficient and emits less greenhouse gases (GHGs) than other transportation modes. For example, HSR can support environmentally sustainable development because the electric multiple unit needs electricity from a wide range of sources, including renewable energy, and uses less energy than other vehicles. This claim has verified by previous studies. Wee et al. (2005) demonstrated that on average, road transportation emits three times more GHGs than rail transportation. Janic (2011) showed that the substitution of short-haul aviation with HSR services can help to reduce GHG emissions. Lin et al. (2021a) also found that new HSR routes in China led to an annual reduction of 1.33% of GHG emissions in China’s transport sector. HSR operation can improve the electrification level, optimize the energy consumption structure of railway transport, reduce the dependence on oil, and thus mitigate carbon emissions (Jia et al., 2021).
Existing studies examine the economic and productivity effects of HSR, but rarely investigate the impacts of HSR on energy productivity. To the best of our knowledge, the following questions on the effectiveness of HSR operation remain unanswered: Does the Chinese HSR exert a significant effect on energy productivity? What magnitude is such an effect? What are the channels through which HSR affects energy productivity? What role does HSR network accessibility play in improving energy productivity?
To address these questions, the present study focuses on the causal effect that HSR exerts on energy productivity, as measured by the ratio of economic output to energy consumption. 1 Investigating the effect of the Chinese HSR connection on energy productivity is crucial for the following two reasons: On the one hand, ascertaining and quantifying the effect of HSR on energy productivity is vital as China is currently transforming from a coal-fired economy to a greener economy; on the other hand, the empirical results can provide some insight and guidance for future decision making regarding public infrastructure investment.
Under such backgrounds, taking China’s HSR operation as a natural experiment, this paper investigates whether HSR operation improves energy productivity and identifies the potential transmission channel, i.e., the technological innovation effect. Considering that HSR connections are unlikely to be randomly selected by the Chinese central government, an instrumental variable (IV) approach is adopted.
Using the difference-in-differences (DID) method combined with propensity score matching, we find that after a city operates HSR, on average, energy productivity can increase by approximately 9%. To address a potential endogeneity problem, historical information about rail rays in 1990 and courier stations during the Ming dynasty are used to establish IVs. We find that the IV estimates are consistent with baseline results. The heterogeneity analysis suggests that the positive impact of HSR on energy productivity gradually enhance with increasing quantiles. The results also indicate that HSR effectively improves the energy productivity of cities closer to HSR stations; however, significant decay effects emerge with increasing distance to the nearest HSR station. In addition, HSR network accessibility has a significant positive effect on energy productivity, while technological innovation mediates the relationship between HSR development and energy productivity.
Although a lot of previous studies have investigated the role of HSR in both economic growth (Atack, 2010; Chen and Hall, 2012; Qin, 2017; Shao et al., 2017; Donaldson, 2018) and environmental performance (Yang et al., 2018; Cheng et al., 2020; Sun et al., 2020a; Jia et al., 2021), this is the first study to explore the effect of HSR on energy productivity at China’s city level. To the best of our knowledge, the investigation of Chen (2021) is the most closely related to our work, who examined the impact of HSR on Chinese cities’ energy consumption rather than energy productivity using the DID method. However, our analytical framework and focus differ significantly from Chen (2021) and other existing studies at least in four aspects. First, the causal relationship between HSR and energy productivity remains unclear in previous literature. To clarify their relationship, the claim that HSR connection contributes to the improvement of energy productivity in China is verified. Besides, we also fully consider the potential endogenous problem using the IV method. Second, by manually collecting energy intensity data at the city level, energy consumption is measured using a bottom-up approach rather than a top-down approach, which is an essential strategy to calculate energy productivity. In contrast, based on the Defense Meteorological Satellite Program’s Operational Linescan System (DMSP/OLS) night-time light data, Chen (2021) obtained the data of city-level energy intensity by using the linear regression model without intercept to decompose provincial-level energy consumption to city-level one. However, because of the stochastic disturbance of the linear regression model and the precision of the downscaling of night-time light data, the estimation method of energy consumption in this paper is more accurate than that in previous literature. Third, the decay effect that HSR exerts on energy productivity and the substitutability of HSR and other transportation modes are investigated, which has not been addressed by previous studies. The findings of this study confirm that the positive energy productivity effect of HSR gradually decreases with increasing distance to the nearest HSR station from 2.1 km to 815.7 km. Furthermore, the effect of HSR connection on energy productivity cannot be completely substituted by traditional railway and aviation. Fourth, the role of HSR network accessibility measured through the social network analysis method is further investigated, and it is examined whether HSR affects energy productivity through technological innovation.
Information about how and to what extent HSR affects energy productivity is beneficial for both policymakers and practitioners to integrate transit-oriented development and ecology-oriented development modes. Policymakers should also fully use the diffusion effect of HSR to decrease a spatial inequality between cities with and without HSR stations. To achieve green transformation, the development of HSR should not only consider its pollution reduction effects, but also its energy productivity effects. Therefore, this study can provide some empirical references for the improvement of energy productivity via HSR network in other developing countries that are operating HSR.
The paper is structured as follows: Section 2 provides a literature review and pertinent hypotheses; Section 3 presents the methodology and data; Section 4 discusses the empirical results; Section 5 conducts the robustness checks and heterogeneity analysis; Section 6 identifies the potential mechanisms; Section 7 summarizes and concludes the paper.
2. Literature Review and Hypotheses
Many studies have focused on the regional economic effects of HSR in different countries. Prominent examples are the United States of America (Atack, 2010), the United Kingdom (Chen and Hall, 2012; Vickerman, 2018), China (Chen et al., 2016; Jia et al., 2017; Chen and Haynes, 2017; Qin, 2017; Shao et al., 2017; Liu and Zhang, 2018; Jin et al., 2020; Li et al., 2020a; Lin et al., 2021b), Korea (Kim et al., 2018), Japan (Hiramatsu, 2018; Li and Xu, 2018), and India (Donaldson, 2018). Redding and Turner (2015) recently conducted a survey of the theoretical and empirical literature on the relationship between transport infrastructure and the spatial organization of economic activities. Although the economic effects of HSR have been widely investigated before, how HSR affects energy productivity has received little attention. Especially for the case of developing countries, the effect of HSR on energy productivity requires further investigation.
Increasing economic output with developing low-energy and low-pollution transportation modes is important to realize sustainable development goals. This is especially true for HSR, which has less energy consumption compared with cars and aircraft (de Rus Mendoza, 2012). Dalla Chiara et al. (2017) compared the specific energy consumption of air transport with that of HSR transport and suggested that with the increasing length of the route, the energy gap between these two forms of transportation diminished. Cheng et al. (2020) used a hybrid input-output life cycle method to evaluate the multi-footprints of Beijing-Tianjin intercity HSR in China. Sun et al. (2020a) found that implementing HSR significantly improved China’s environmental efficiency. 2 Jia et al. (2021) confirmed that HSR development significantly reduced CO2 emissions in China. These studies provide some institutional backgrounds and theoretical supports for examining the effect of HSR on energy productivity.
Existing empirical studies find that wide difference exists in the measures of energy efficiency with the different stages of transportation construction (Feng and Wang, 2018; Lin and Chen, 2019). Besides, to obtain the robust estimates of the production frontier, a large sample of observations is required in productivity and efficiency measurement techniques (Tanaka and Managi, 2013). As an alternative measure of energy efficiency, energy productivity is defined as the ratio of economic output to energy consumption (Patterson, 1996; Dimitropoulos, 2007). Meanwhile, the determinants of energy productivity have been discussed broadly, e.g., research and development (R&D) activities (Fisher-Vanden et al., 2006), and technical changes (Wang and Wei, 2016; Yang et al., 2018; Li et al., 2021; Berhe et al., 2022). For instance, Atalla and Bean (2017) investigated the drivers of energy productivity in 39 countries during 1995–2009 and found that a higher income level and higher energy prices could lead to greater energy productivity improvements.
This paper focuses on the effect of China’s HSR connection on energy productivity. To address the potential mechanisms of how HSR affects energy productivity, Figure 1 illustrates both the direct and indirect channels through which these mechanisms function.
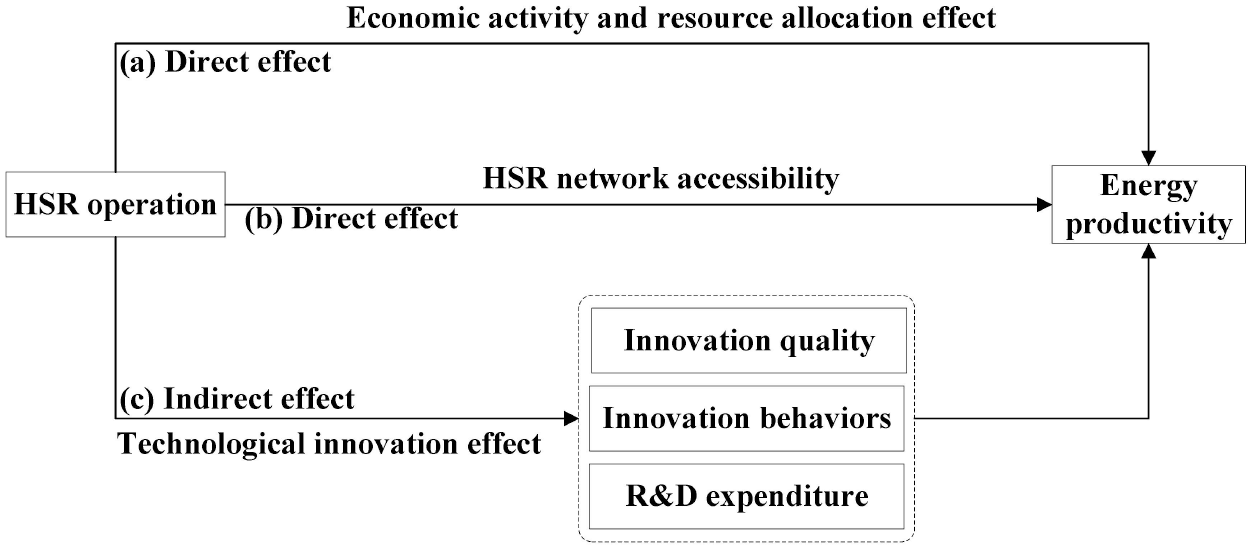
Potential channels through which HSR affects energy productivity
The top section of Figure 1 (a) presents the direct effect of HSR on energy productivity. In general, cooperation becomes closer and more frequent between cities connected by HSR, which saves time (leading to consumer surplus gains for passengers) and decreases transaction costs. Thus, the corresponding mechanism is that HSR stimulates economic growth and improves the efficiency of resource allocation. For example, Diao (2018) found that HSR increased economic growth by facilitating travel and interaction among cities. Li et al. (2020b) also documented that the opening of HSR exerted a significant positive effect on economic efficiency. Thereby, the following hypothesis is proposed:
The middle section of Figure 1 (b) presents the effect of HSR-induced accessibility on energy productivity. HSR connections expand the transportation network among cities and reduce the time costs of the flows of production factors. These connections also make it more convenient for developing cities to promote industrialization, urbanization, and information development through industrial transfer from developed cities. Since cities with HSR can attract more economic activities, which in turn affects energy productivity through industrial agglomeration and scale effects (Wu and Lin, 2021). This further accelerates the agglomeration of homogeneous industries in cities and promotes the professional division of labor. These effects also help cities along the HSR to optimize, reconstruct, and organize spatial structures. The industrial agglomeration can improve the specialized agglomeration of cities and thus effectively promote energy productivity. In addition, the advantages of HSR network accessibility can lead to massive investments in fixed assets (Diao, 2018). Thus, the following hypothesis is proposed:
Finally, the bottom section of Figure 1 (c) illustrates the technological innovation effect of HSR on energy productivity. Birol and Keppler (2000) highlighted the relationship between the improvement of energy efficiency and technological advancement, which has been supported by some existing studies on technical progress and technological innovation (Cagno et al., 2015; Wei et al., 2016). HSR operation also accelerates the accumulation of technological innovation resources in cities with HSR connection to improve technological innovation (Gao and Zheng, 2020). Thus, we infer that HSR can promote energy productivity through a positive technological innovation effect. The underlying logic is that HSR operation expedites the flows of green production factors to reduce the space-time distance between knowledge and technology transmission. Moreover, HSR operation can also further improve the allocation efficiency of technological innovation resources. Regarding the accumulation of human capital, a well-functioning infrastructure is vital for cities to attract talents, improve the efficiency of high-quality human resource allocation, and even achieve the high-quality growth of the local economy.
In addition, HSR operation accelerates the flows of technological innovation factors to drive the formation of technological innovation networks between cities. First, population mobility pattern is essential for the exchange of knowledge and technology between cities in a technological innovation network (Dong et al., 2020; Li et al., 2016). HSR connection is conducive to strengthening the exchange and cooperation of technological innovation activities between cities connected via HSR, and to promoting the technological innovation quality of HSR-connected cities. Second, HSR operation helps to strengthen technological innovation cooperation among cities and enhances their inclination to implement technological innovation behaviors. These behaviors increase the number of patent applications (Lin et al., 2021), especially for energy-saving patents, and strengthen intellectual property protection. Third, HSR operation is beneficial to expanding both the scale and scope of enterprise production to yield a market size effect (Ma et al., 2021) by sharing R&D costs and increasing the return on the assets of R&D activities. Thus, the third hypothesis is proposed:
3. Methodology and Data
3.1. Baseline Model
First, the impact of HSR on energy productivity is estimated using a DID strategy. In other words, two types of variation are combined: the time variation (i.e., before and after the start of HSR operation for an individual city) and the city variation (i.e., whether cities are connected to HSR stations or not). Furthermore, fixed effects are also introduced to control both time-invariant and time-variation observable city attributes that may be related to the implementation of HSR. The general form of the DID model is expressed as follows:

where epit represents energy productivity in city i in year t; hsrit denotes the treatment indicator, which is equal to one if city i operates HSR in year t (and for all subsequent years), and otherwise zero; xit is a vector of time-varying city characteristics, including gross domestic product (GDP) per capita, the share of foreign direct investment (FDI) in real GDP, the share of secondary industry value added in GDP, and environmental regulation; δi represents the city fixed effect, which captures unobservable heterogeneity; γt consists of the year fixed effect and controls for temporary shocks; εit is the error term; a0, α1, and α2 are coefficients to be estimated.
Two possible biases should be addressed by the DID estimator. The first may emerge if energy productivity trends (and levels) vary in both the treatment and control groups prior to the operation of HSR. The second may arise if HSR stations are chosen based on geographic, political, or socio-economic factors. In this regard, the propensity score matching (PSM) technique proposed by Rosenbaum and Rubin (1983) is employed. Based on this approach, treated cities can be combined with controlled cities (that have similar characteristics) to enable the reduction of potential bias. We will use the Mahalanobis distance matching (MDM) (Cochran and Rubin, 1973) to conduct robustness checks.
3.2. Verifying the Parallel Trend
A critical assumption of the DID method is the existence of parallel trends, implying that pre-intervention trends in energy productivity are identical between treatment (HSR cities) and control (non-HSR cities) groups. The DID estimates may be biased if parallel trends are not satisfied. This assumption can be verified according to Beck et al. (2010) and Yang et al. (2018), i.e., both the leads and lags of the initial connection dummy variable of HSR are incorporated. The reference year is 2008, which is the year when the first HSR line started operating, 3 and the sample includes only the data of the eight years after 2008. Thus, eight is adopted as the threshold for specifying the dummy variable, and the time window of this study is 16 years, including the eight years after the operation of HSR, and the eight years preceding its open. Thus, the following model is used to verify the parallel trend:

For HSR cities, the dummy variable hsrj is equal to one in the j-th year before the introduction of HSR (each j is negative), while hsrj is equal to one in the j-th year after the introduction of HSR (each j is positive), and otherwise hsrj is equal to zero. Specifically, assuming that oi is the initial year of HSR operation for city i, the dummy variable
3.3. Data and Variables
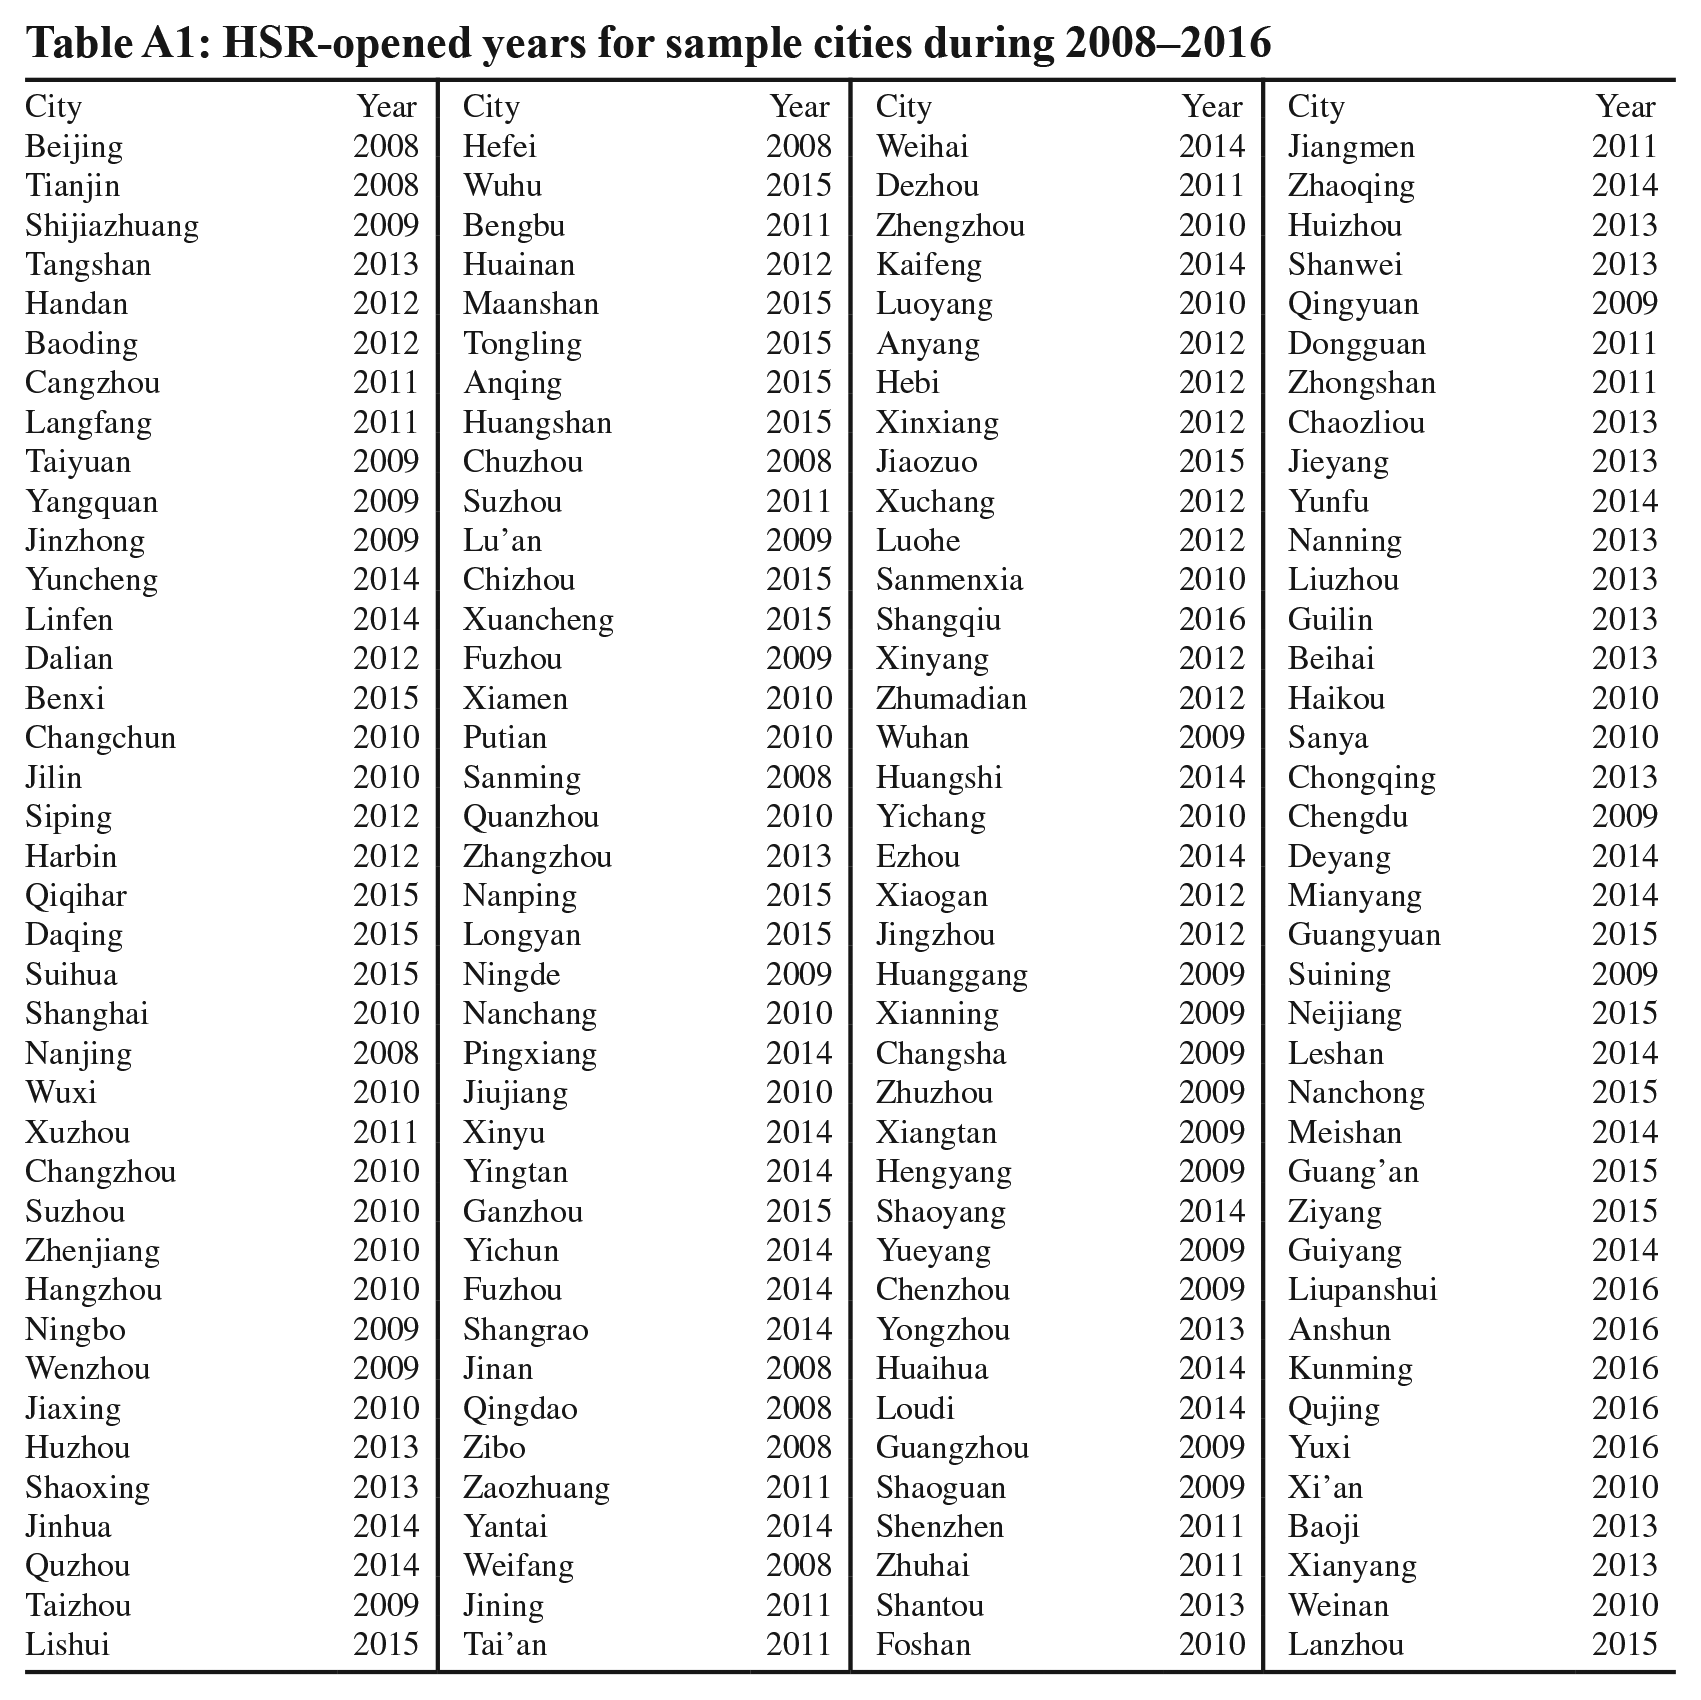
The HSR data are manually collected from a number of sources, such as the China Railway Yearbook (2004–2017) and the official website of the China Railway Corporation (12306.cn). HSR data are double-checked with a relevant Wikipedia website. 4 The HSR-opened years for the sample cities are presented in Appendix A.
The economic benefits of HSR operation have been empirically assessed by some existing studies (Zheng and Kahn, 2013; Baum-Snow et al., 2017; Ahlfeldt and Feddersen, 2018; Yao et al., 2019); however, an econometric approach for studying the relationship between HSR and energy productivity has not been developed to date. To estimate the energy productivity effect of HSR, in the baseline regression, we employ a single factor (i.e., GDP per unit energy consumption) rather than a total factor approach to measure energy productivity. This strategy is adopted for two reasons: First, GDP per unit energy consumption is consistent with China’s existing statistical caliber and energy-conservation and emission-reduction targets, and the corresponding results are more comparable and can provide specific policy implications; second, using a single factor approach to measure energy productivity can alleviate the potential endogeneity problem, to some extent (Sahu and Sharma, 2016). In a total factor productivity framework, for instance, labor force and capital stock may depend on unobserved productivity shocks. Therefore, if input choices and productivity are correlated, the obtained results may be biased.
Prefecture-level GDP and GDP index are collected from the China City Statistical Yearbook (2004–2017). GDP statistics are cross-checked against provincial statistical yearbooks to ensure the accuracy and consistency of economic output. GDP is deflated to the 2003 constant price. For robustness checks, the commonly-used DMSP/OLS night-time light data are employed to represent GDP (Chen and Nordhaus, 2011; Henderson et al., 2011; Michalopoulo and Papaioannou, 2018). In this study, the correlation coefficient of GDP and total night-time light data reaches 86.3%.
Since energy consumption matters in productivity growth (Murillo-Zamorano, 2005), its accurate measurement is also very important. Primary energy consumption at the city level is estimated using a bottom-up approach. Huang et al. (2018) were the first to present the data processing procedure in detail. They collected the energy intensity statistics data of 191 Chinese cities from 2003 to 2013 and derived the total primary energy consumption by multiplying GDP with energy intensity. Following Huang et al. (2018), the energy intensity statistics of an additional 57 cities were collected, and the study period is expanded to 2016. This generates a complete set of energy consumption data in China’s 248 prefecture-level cities from 2003 to 2016, which is the sample size in this study.
Furthermore, variables related to city characteristics, including real GDP per capita (pgdp), the proportion of FDI in GDP (sfdi), the proportion of secondary industry value added in GDP (sind), and environmental regulation (er) proxied by the SO2 removal rate, are obtained from the China City Statistical Yearbook (2004–2017). The reasons for control variables’ selection are as follows. First, economic development levels measured by GDP per capita in different cities generally correspond to heterogenous energy productivities. However, there is no consensus regarding the effect of economic growth on energy productivity (Sadorsky, 2013; Bhattacharya et al., 2020). Second, overseas capital represented by FDI provides some power and support for regional development, not only providing capital and technology for productivity improvements, but also promoting employment and GDP growth. However, conclusions about the impact of FDI on energy productivity are inconsistent. For example, Elliott et al. (2013) found a negative relationship between FDI inflows and energy intensity (reciprocal of energy productivity) using the city-level data of China, indicating that FDI had a positive impact on energy productivity. On the contrary, Adom and Amuakwa-Mensah (2016) suggested that FDI significantly decreased energy productivity. Given that, we introduce FDI into the regression model. Third, the change from low- to high-energy-efficiency industries can result in a corresponding increase in energy productivity (Elliott et al., 2017).
Besides, in order to effectively control environmental pollution, Chinese policymakers have made great efforts to reduce the energy consumption of different industries by optimizing and adjusting the industrial structure. Hence, changes in the industrial structure play an important role on energy intensity (Wu, 2012). Thus, we introduce industrial structure into the regression model. Finally, environmental regulation can stimulate firms to reduce the costs of pollution emissions by using more clean energy, facilitating energy efficiency improvement in the long run (Sun et al., 2020b). Therefore, we expect that environmental regulation exerts a positive impact on energy productivity. Following Huang and Hua (2018), we use the SO2 removal rate as a proxy for environmental regulation.
Descriptive statistics are summarized in Table 1. The treatment group consists of prefecture-level cities that opened HSR during 2003–2016, and the control group consists of ones without HSR. In the treatment group, the average energy productivity is approximately 1.478 (10000 CNY/tce, where CNY represents the Chinese Yuan, and tce represents tonne of standard coal equivalent). The average energy productivity of the control group is approximately 0.885 (10000 CNY/tce). A two-tailed t-test identifies a statistically significant variation in the mean values of city characteristics and energy productivity. Matching techniques are adopted to avoid the selection bias.
Descriptive statistics of various variables
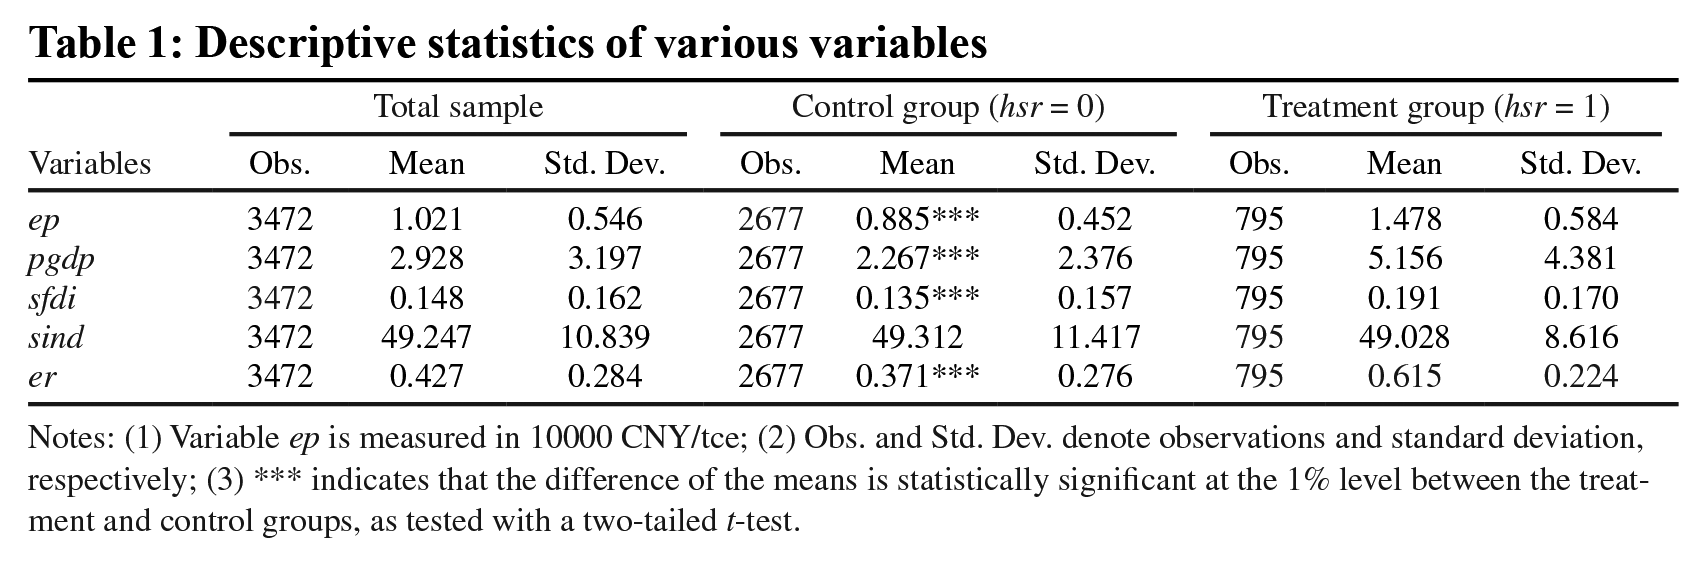
Notes: (1) Variable ep is measured in 10000 CNY/tce; (2) Obs. and Std. Dev. denote observations and standard deviation, respectively; (3) *** indicates that the difference of the means is statistically significant at the 1% level between the treatment and control groups, as tested with a two-tailed t-test.
4. Results and Discussion
4.1. Baseline Results
The baseline DID estimates of Equation (1) are shown in Table 2. Without control variables, the coefficient of hsr is 0.093 (in Column (1)), and 0.094 when control variables are considered (in Column (2)). Both are statistically significant at the 1% level, indicating that HSR connection is beneficial to energy productivity improvement. A back-of-the-envelope calculation shows that one standard deviation increase in hsr raises energy productivity by 0.073 standard deviation.
Baseline estimation results of the energy productivity effect of HSR
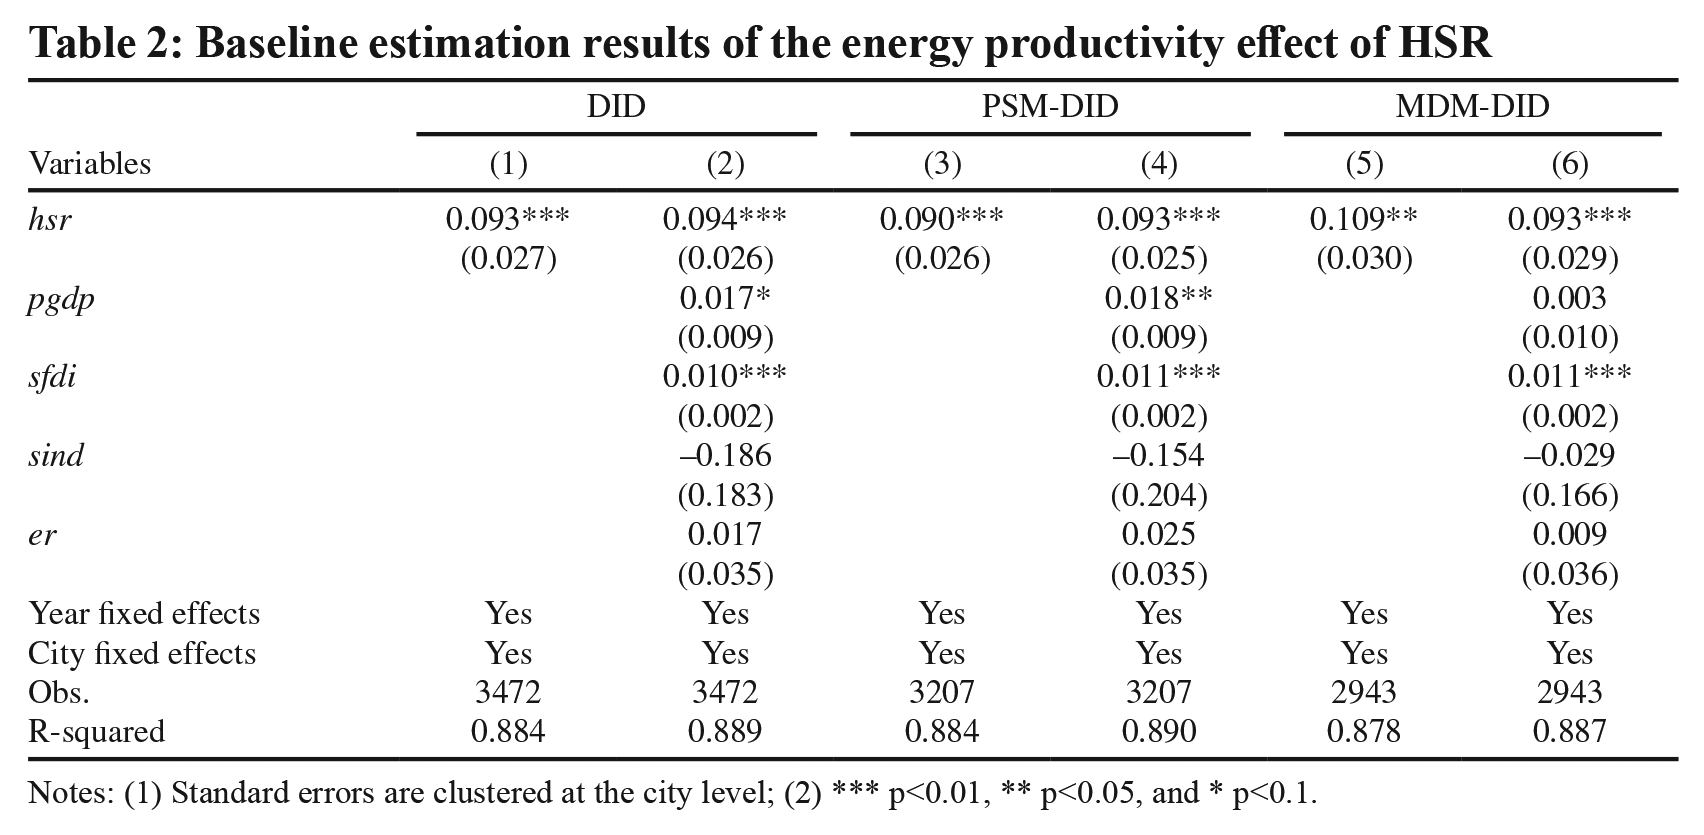
Notes: (1) Standard errors are clustered at the city level; (2) *** p<0.01, ** p<0.05, and * p<0.1.
Furthermore, we find that both economic development (pgdp) and foreign direct investment (sfdi) are significantly and positively associated with energy productivity, indicating that China’s economic development mode can gradually achieve efficient energy use and that FDI plays a significant role in China’s economic development and transition (Jin et al., 2020) to improve energy productivity. The findings are consistent with those of Shao et al. (2019). Environmental regulation (er) also shows a positive correlation with energy productivity, indicating that stricter environmental standards encourage policymakers to adopt energy-saving and emission-reduction policies, leading to energy productivity improvement through energy transition (Jia et al., 2021). In addition, the coefficient of industrial structure (sind) is not significant. A possible explanation for this finding is that the negative effect of an increase in the share of secondary industry in GDP on energy productivity is partially offset by the gradually increasing energy efficiency of China’s industrial sector (Wu et al., 2012).
For comparison, PSM-DID (in Columns (3) and (4)) and MDM-DID (in Columns (5) and (6)) estimates are presented in Table 2. The results are consistent with the DID estimators, indicating that HSR connection significantly improves energy productivity by approximately 9%, ceteris paribus, and our results are not dependent on matching methods. We further find that one standard deviation increase in hsr raises energy productivity by nearly 0.071 standard deviation. The estimation results of control variables are consistent with those of the DID strategy. Thus, Hypothesis 1 is verified, i.e., HSR connection exerts a significant positive impact on energy productivity. More details on how sample selection bias is tested can be found in Appendix B. Estimation results presented in the following sections are based on the PSM-DID method.
To test the parallel trend assumption, Equation (2) is estimated, and the coefficients are plotted in Figure 2. Evidently, HSR operation imposes a significantly positive effect on energy productivity after 2008. Regarding the magnitude of the effect, the positive effect presents a significant intensifying trend (β–8 < β–7 < . . . < β7 < β8). One may concern that the coefficients of treatments have an increasing trend (even before 0) in Figure 2. The design and planning of HSR network before the operation of the first HSR line (2008) may have contributed to the use of investments and technology flows between cities prior to the operation of the first HSR line, causing the coefficients of the variable
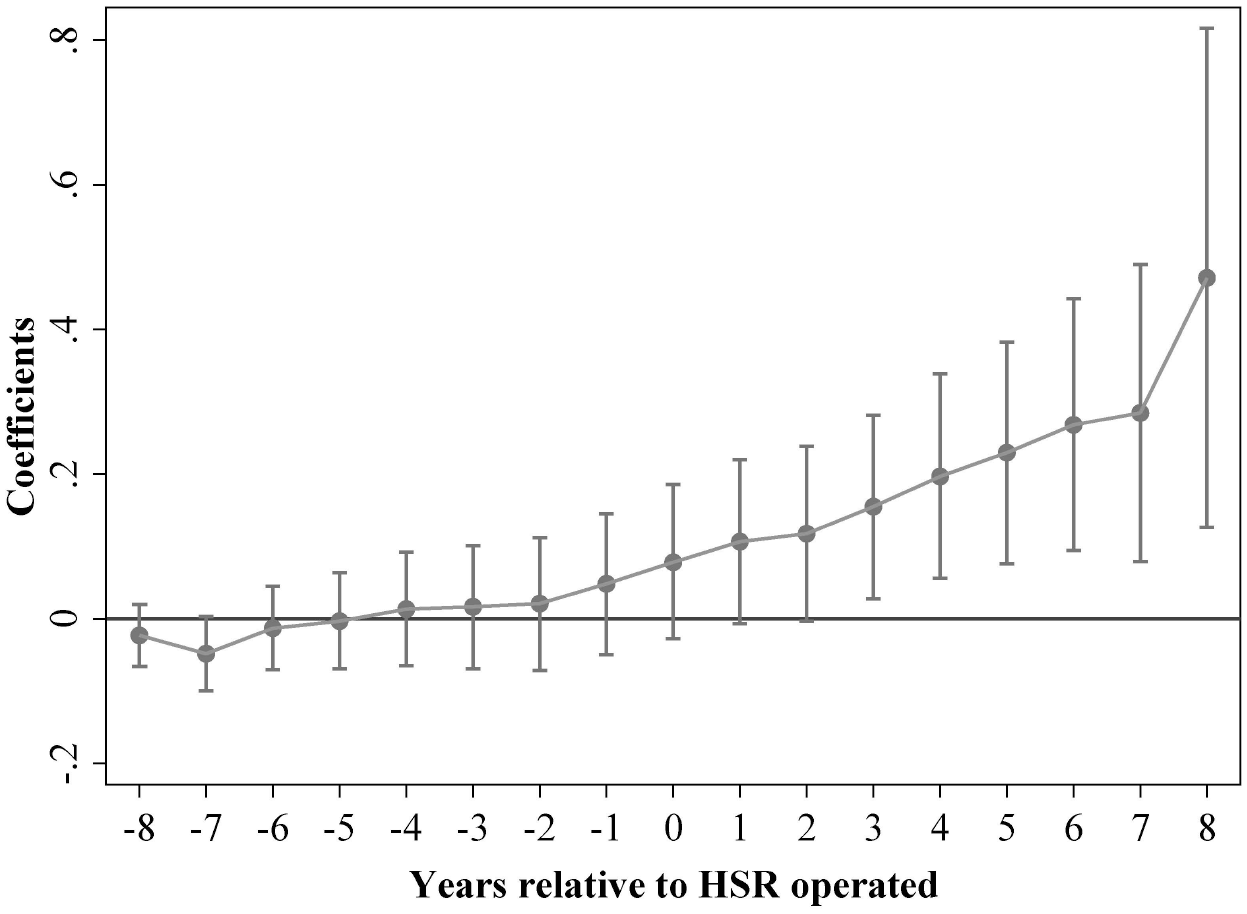
Dynamic effects of HSR on energy productivity
4.2. Endogeneity Problem Treatment
In addition to simultaneity and reverse causality, the potential endogeneity problem associated with the relationship between implementing HSR and energy productivity may result from measurement errors, omitted variable bias, and unobservable heterogeneity. Hence, the instrumental variable method is applied to overcome the endogeneity problem and ensure the robustness of the empirical results. The instrumental variables used when investigating the effect of transportation infrastructure include geographic slope (Duflo and Pande, 2007), established railway network (Zheng and Kahn, 2013; Baum-Snow et al., 2017), least-cost path-spanning tree networks (Faber, 2014), and historical planning documents and actual plans (Duranton and Turner, 2012; Michaels, 2008).
This study chooses historical information about rail rays in 1990 and courier stations during the Ming dynasty 5 as HSR’s instrumental variables. An applicable instrumental variable needs to meet the correlation and exogenous conditions. First, the historical information meets the correlation condition as rail rays in 1990 and courier stations during the Ming dynasty generally do not change over time. It is more favorable to construct HSR with more rail rays and courier stations, which is positively correlated with the implementation of HSR and thus satisfies the correlation condition. Second, both the rail rays and courier stations are exogenous historical variables that do not affect energy productivity directly. Thus, the use of rail rays and courier stations as the instrumental variables of HSR is valid. The spatial distribution of courier stations and routes during the Ming dynasty can be found in Appendix C.
As these two instrumental variables are time-invariant, panel data set cannot be used to run the instrumental variable regression. Following Dong et al. (2020), the long-difference equation from 2003 to 2016 can be estimated. The equation is given as follows:

where
Table 3 presents the two-stage least squares (2SLS) regression results. The results, as presented in Panel A of Table 3, are consistent with our baseline results. This implies that implementing HSR does improve energy productivity. Panel B shows the first-stage regression results of HSR on the railways and courier stations, indicating that HSR is significantly and positively correlated to both railways and courier stations. This confirms that our instrument variables are the strong predictors of the HSR connection. The KP F-statistics far exceed 10, indicating that the null hypothesis about the weak instrument variable is rejected according to the rule-of-thumb F statistics for IV method. Thus, the instrument variables are valid.
2SLS estimation results of the energy productivity effect of HSR
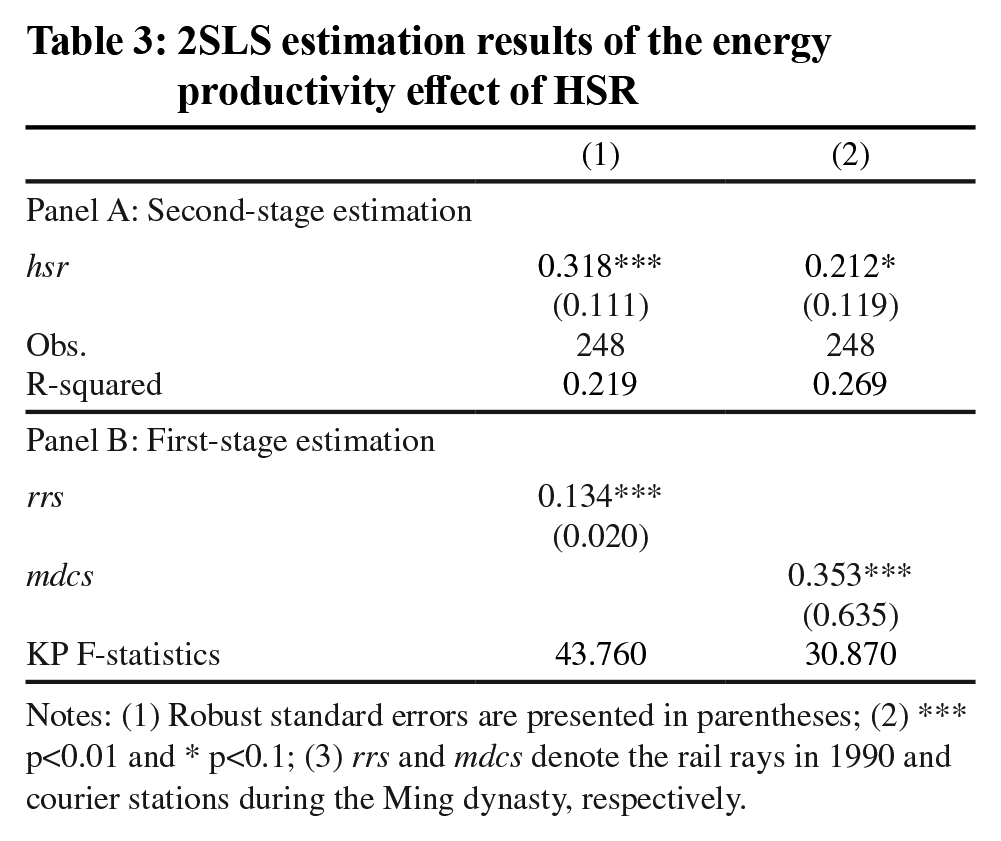
Notes: (1) Robust standard errors are presented in parentheses; (2) *** p<0.01 and * p<0.1; (3) rrs and mdcs denote the rail rays in 1990 and courier stations during the Ming dynasty, respectively.
5. Robustness Checks and Heterogeneity Analysis
5.1. Robustness Checks
5.1.1. Placebo Test
The placebo test is designed to ensure that the baseline regression results are not affected by chance. For this purpose, we randomly assign hsr to sample cities and ensure the robustness of results. After 1000 placebo tests, 1000 coefficients of hsrfalse are obtained, and then it is tested whether the mean of these coefficients is equal to zero. If the coefficients are still significantly positive, then it indicates that the original estimation results are biased, and that the changes of the energy productivity are likely to be influenced by other policies or random factors. After repeating the process 1000 times, the distribution of these coefficients is presented in Figure 3, indicating that it is an approximately normal distribution with the mean value of –0.0002 which is close to zero. Since the true energy productivity effects of HSR from the baseline regression far exceed the coefficients of hsrfalse, one can believe that energy productivity growth is indeed explained by the implementation of HSR, instead of being affected by other systematic or random shocks. This confirms the credibility of the baseline results.
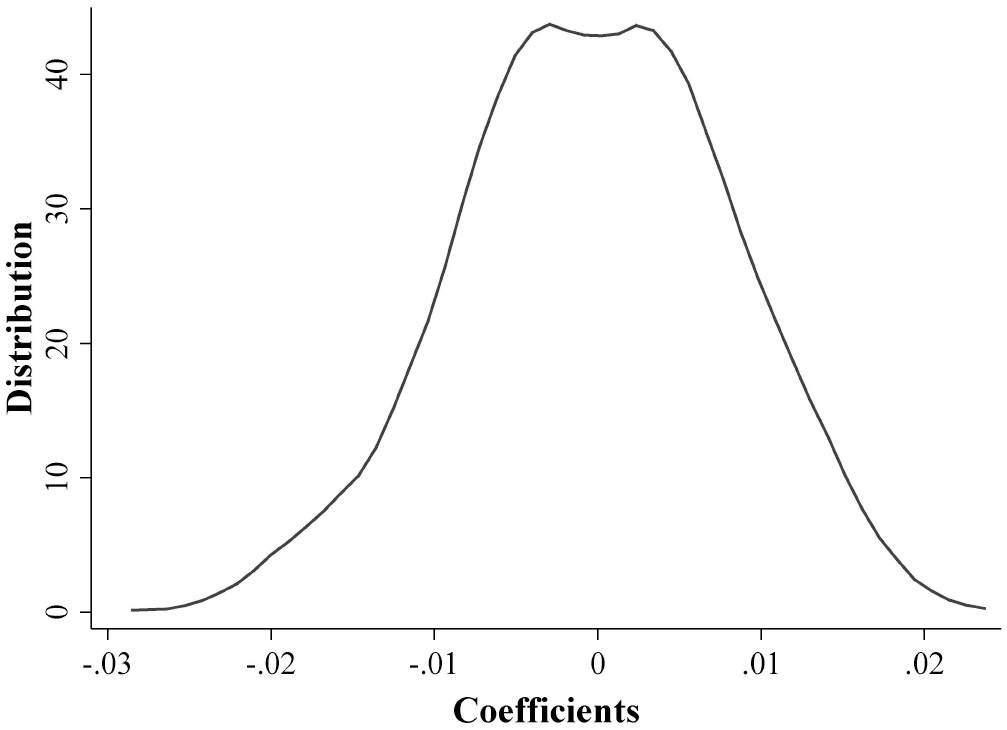
Placebo test
5.1.2. Concurrent Events
If any other events occurred around 2008 that affected GDP growth and energy consumption across cities, the estimates could be biased. Two such events are the 2008–2009 financial crisis and the 2008 Olympic Games. To investigate the effects of the financial crisis, both years of 2008 and 2009 are removed from the sample. The estimation results of the curtailed sample are shown in Columns (1) and (2) of Table 4. Regarding the 2008 Olympic Games, He et al. (2016) showed that not only Beijing but also Hebei, Tianjin, Shanxi, Inner Mongolia, and Liaoning were affected. To investigate the potential effects of this event, cities in these provinces that were affected by the Olympic Games in years of 2007 and 2008 are excluded (Columns (3) and (4) of Table 4).
Tests for concurrent events
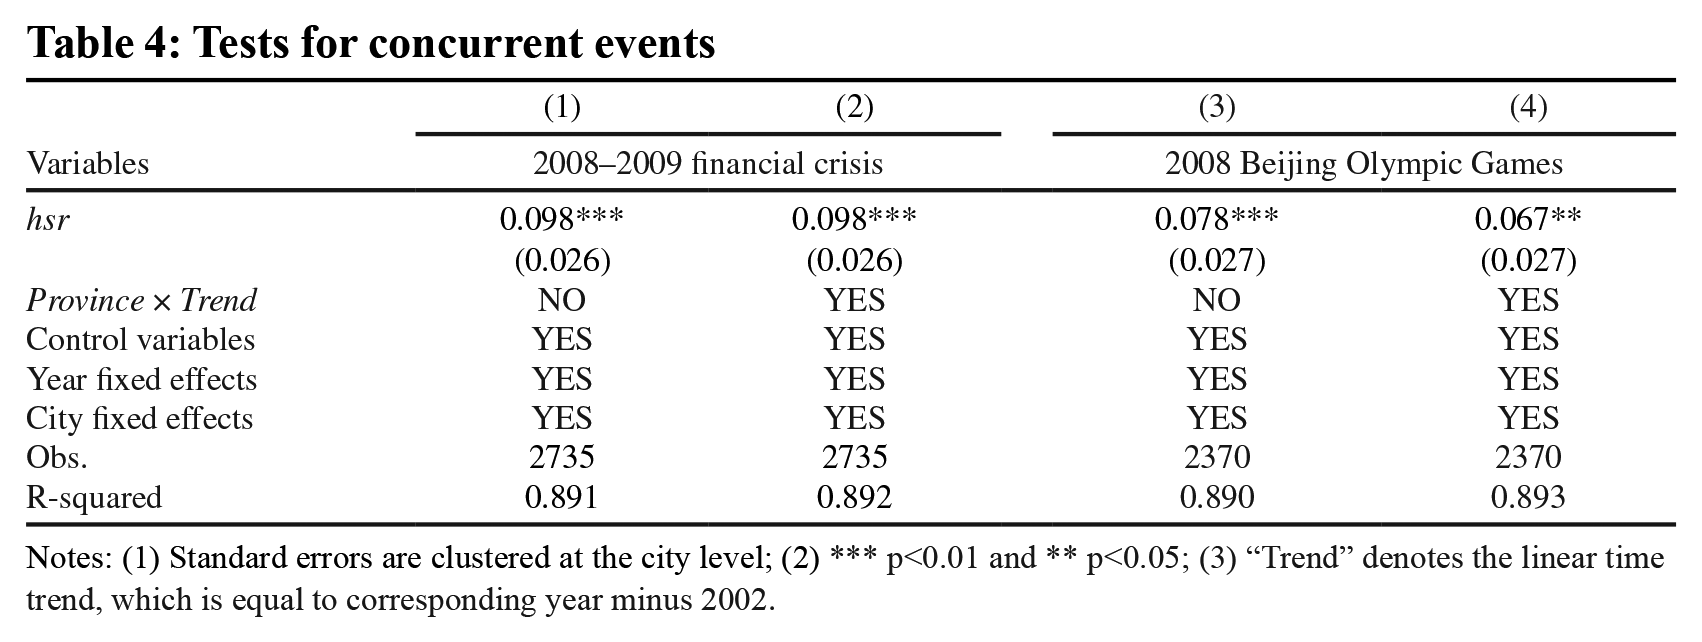
Notes: (1) Standard errors are clustered at the city level; (2) *** p<0.01 and ** p<0.05; (3) “Trend” denotes the linear time trend, which is equal to corresponding year minus 2002.
Moreover, an interaction term between province and trend is introduced to capture provincial characteristics which cannot be captured at the city level, a very demanding specification which allows for regional trends. For example, the political turnover for a certain province may affect its environmental governance and economic performance (Li and Zhou, 2005), which further affect energy structure (Kong et al., 2021) and energy productivity. In addition, the reasons for the consideration of the interaction term between province and trend are as follows. First, it is important to understand that HSR operation is not random, which is related to the city’s location. Second, regional differences in economic development also affect energy productivity in various ways. Third, these differences may have different impacts on energy productivity over time, which could result in biased estimations. Given that, we further introduce the interaction term between province and trend in the baseline model. The coefficients of hsr in Table 4 remain similar to the baseline results presented in Table 2. This suggests that these two concurrent events do not affect our baseline estimates.
5.1.3. Substitutability between Hsr and other Transportation Modes
The aforementioned results suggest that HSR improves energy productivity. As discussed in Section 2, HSR operation improves energy productivity by strengthening industrial agglomeration, economic activities, and factor redistribution effects. Moreover, technological innovation effect also plays a principal role in the causal relationship between HSR and energy productivity. However, cities connected via HSR stations may also obtain these effects through other transportation modes, such as traditional railway and aviation. Consequently, both traditional railway and aviation could substitute HSR in terms of energy productivity. Such a potential substitutability between HSR and other transportation modes should be further examined based on the following econometric model:

where mode represents other two transportation modes, i.e., traditional railway and aviation, which are proxied by railway and aviation passenger volumes, respectively;

Based on Equation (5), we examine whether multiple transportation modes complement or substitute for each other in increasing energy productivity. Further, we use the economic concept of marginal effect to reflect whether HSR and traditional railway (aviation) work as complements or substitutes. From the complementary view, HSR could improve the marginal effect of another transportation mode on energy productivity. Thus, the coupling of transportation modes will improve energy productivity if they serve as complements. On the contrary, from the substitutive view, HSR could decrease the marginal effect of another transportation mode on energy productivity (Oh et al., 2018).
Given that θ1 > 0, if θ2 is significantly negative, then cities with higher energy productivity will be less affected by traditional railway or aviation, indicating a substitution effect. Specifically, if there is a substitution effect, a higher level of HSR operation may lower the marginal effects of other transportation modes on energy productivity. Figure 4 shows the estimation results, indicating that the estimates of θ2 for both traditional railway and aviation are quantitatively small (approximately –0.006) and not statistically significant. This suggests that for improving energy productivity, HSR operation could not be substituted by traditional railway and aviation, i.e., the substitution effects are not significant. This finding differs from those of Zhang et al. (2018), who found that HSR’s substitutions were significant for short and medium-haul air routes, while introducing HSR services in China increased long-distance air travel.
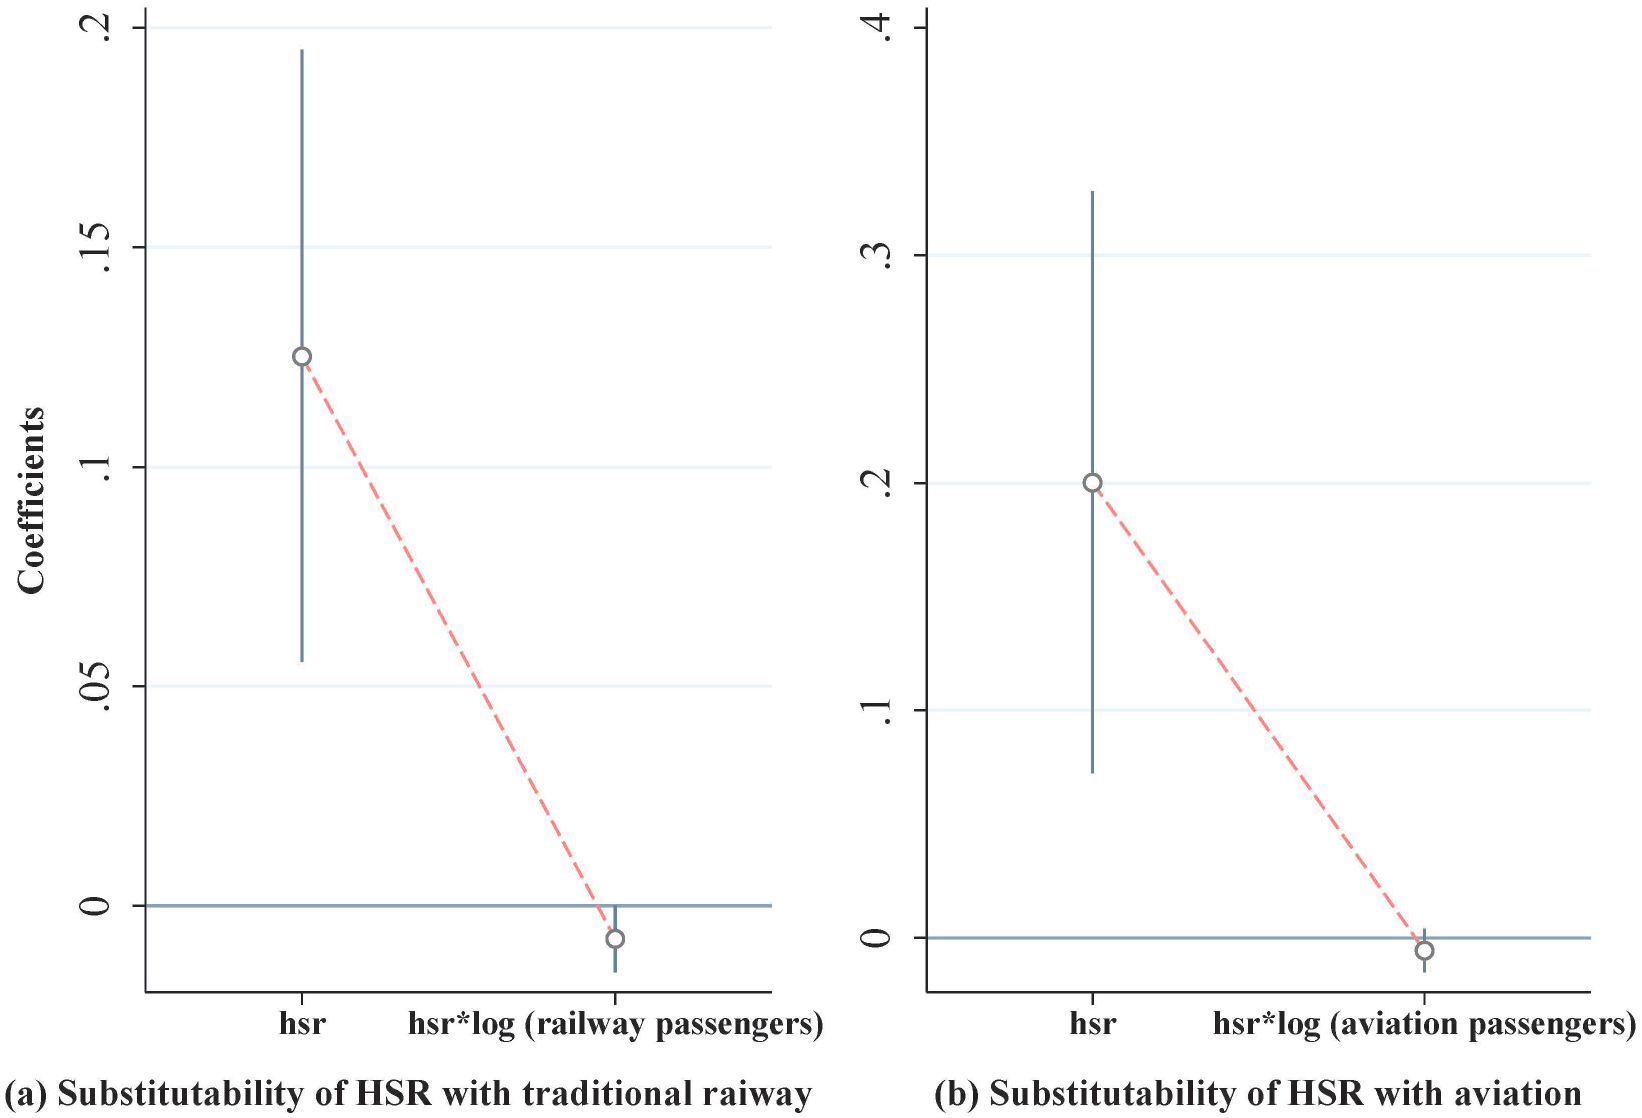
Substitutability of HSR with traditional railway (a) and aviation (b)
5.1.4. Alternative Measures of Energy Productivity
As we discussed in Section 3.3, the DMSP/OLS satellite (night-time light) data is an excellent proxy for economic growth because the data can eliminate the interference of human factors, to a great extent. The night-time light data can more accurately reflect the spatiotemporal dynamics of GDP at a more detailed level over large geographical areas. Hence, we use the night-time light data to proxy GDP while measuring energy productivity and re-estimate Equation (1), and the corresponding results are shown in Column (1) of Table 5. Moreover, considering a single-factor energy productivity does not involve the substitution or complementarity between energy and other input factors (Stern, 2012), we further adopt a total factor energy productivity for robustness check. Specifically, a stochastic frontier analysis approach (more details can be found in Appendix D) is used to measure energy productivity and re-estimate Equation (1), and the corresponding results are reported in Column (2) of Table 5. After replacing energy productivity indicators, the coefficients of HSR still remain significantly positive. This indicates that the baseline estimation results are robust, again.
Estimation results based on the alternative measures of energy productivity
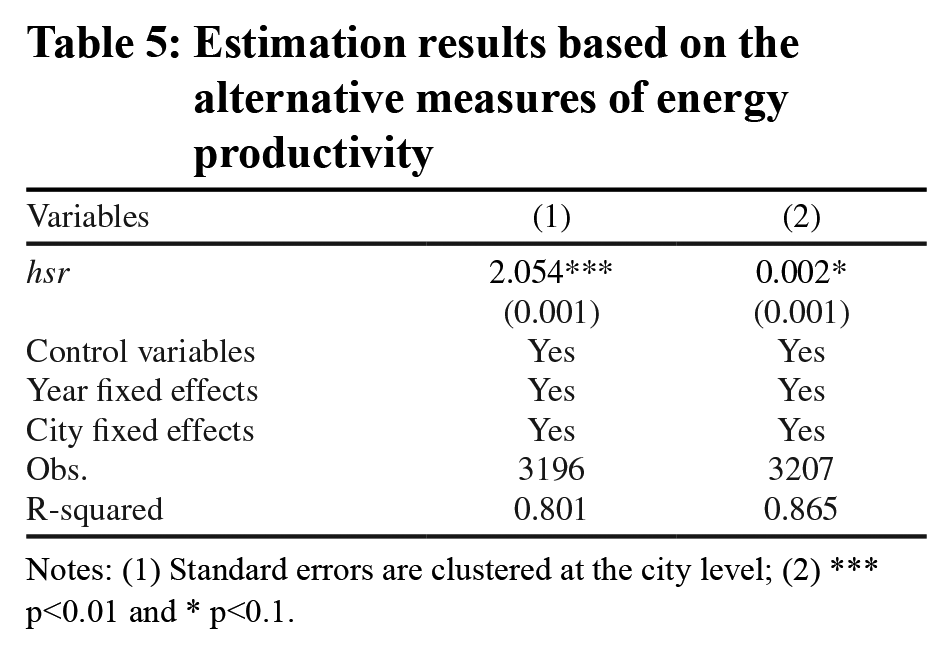
Notes: (1) Standard errors are clustered at the city level; (2) *** p<0.01 and * p<0.1.
5.2. Heterogeneity Analysis
5.2.1. Heterogeneity across Quantiles
When evaluating the effect of a certain policy, policymakers may be interested in more than the average impact of the policy. Quantile treatment effects are measured as the difference between the quantiles of the treatment group distribution and control group distribution. It is impractical to estimate quantile treatment effects using traditional methods such as the linear regression, which depends on the effect of an intervention being the same across all individuals. Due to the specific characteristics of the sample cities, the effect of a macroeconomic activity on energy productivity may be heterogeneous across quantiles. Consequently, the quantile regression is a feasible method to investigate such heterogeneous effects because the results of the method are robust and less sensitive to the heteroscedasticity and outliers that frequently exist in real-world data (Koenker and Bassett, 1978; Baur, 2013).
In this section, the heterogeneity effects of HSR on energy productivity are examined across different quantiles. The quantile regression is used to assess how hsr affects the energy productivity for cities whose energy productivity tends to be low (e.g., 5th percentile), high (e.g., 95th percentile), or anywhere in between. Table 6 shows the results of the quantile regression. Evidently, the impacts of HSR on energy productivity gradually grow with increasing quantiles. In addition, the coefficients of hsr remain significantly positive, indicating the robustness of the baseline regression results.
Quantile regression results
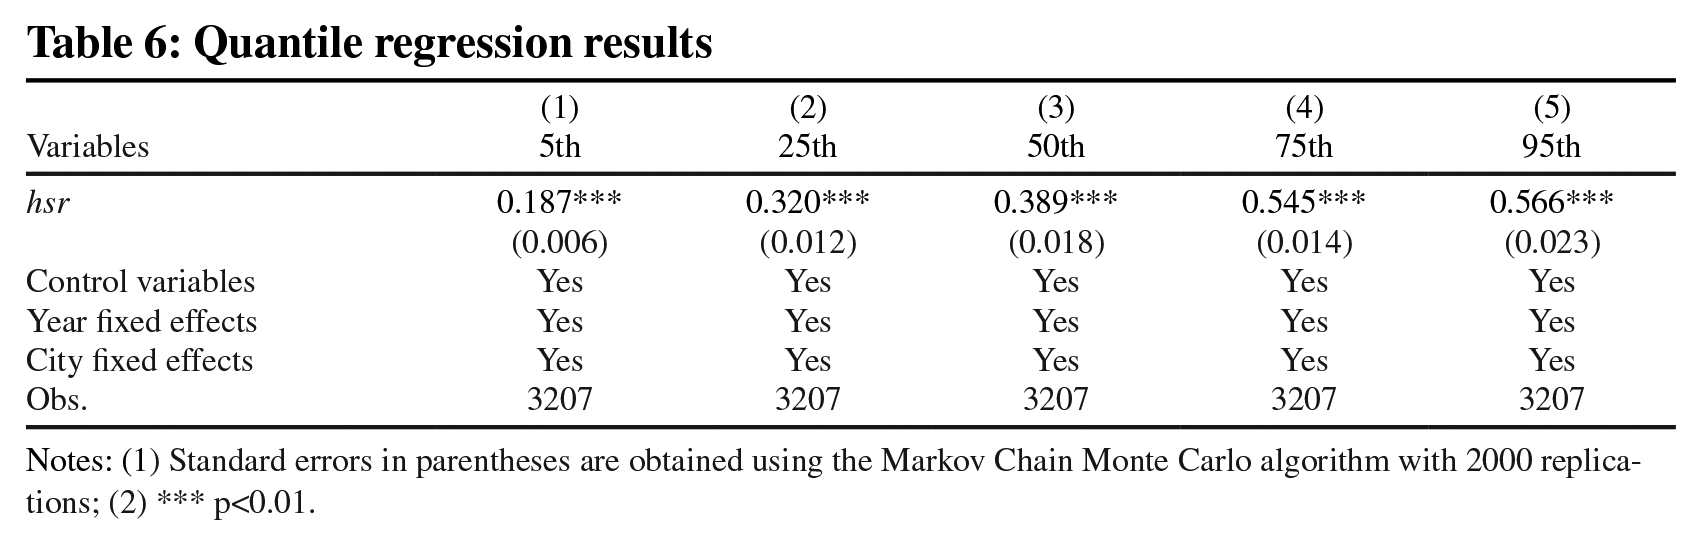
Notes: (1) Standard errors in parentheses are obtained using the Markov Chain Monte Carlo algorithm with 2000 replications; (2) *** p<0.01.
5.2.2. Heterogeneity across Distances
Based on Tobler’s First Law of geography (Tobler, 1970), the heterogeneity effects of HSR on energy productivity need to be further investigated from the perspective of distance decay (in km). Specifically, a dummy variable distance is generated, and the interaction term between hsr and distance are introduced into the baseline model to establish the following regression model:

where distance indicates a dummy variable, which is equal to 1 if the distance between a city center and the nearest HSR station is less than 2.1 km (the first percentile, 1%), and zero otherwise. Other percentiles are also estimated for comparison, i.e., 5%, 10%, 25%, 50%, 75%, 90%, 95%, and 99%, with the corresponding distances of 3.7 km, 4.7 km, 7.3 km, 23.5 km, 141.2 km, 382.3 km, 472.1 km, and 815.7 km, respectively. Variables
As shown in Figure 5, we find that there is a significant decay effect of HSR on energy productivity, i.e., the effect of HSR on energy productivity gradually decreases with increasing distance to the nearest HSR station, and the magnitude of this effect remains at around 0.1. Thus, heterogeneity effects across distances are verified. The empirical findings are consistent with some previous studies (e.g., Zhang et al., 2018) which suggests that HSR’s effect is the greatest in the short distance class (below 500 km), followed by the median distance (501–1000 km).
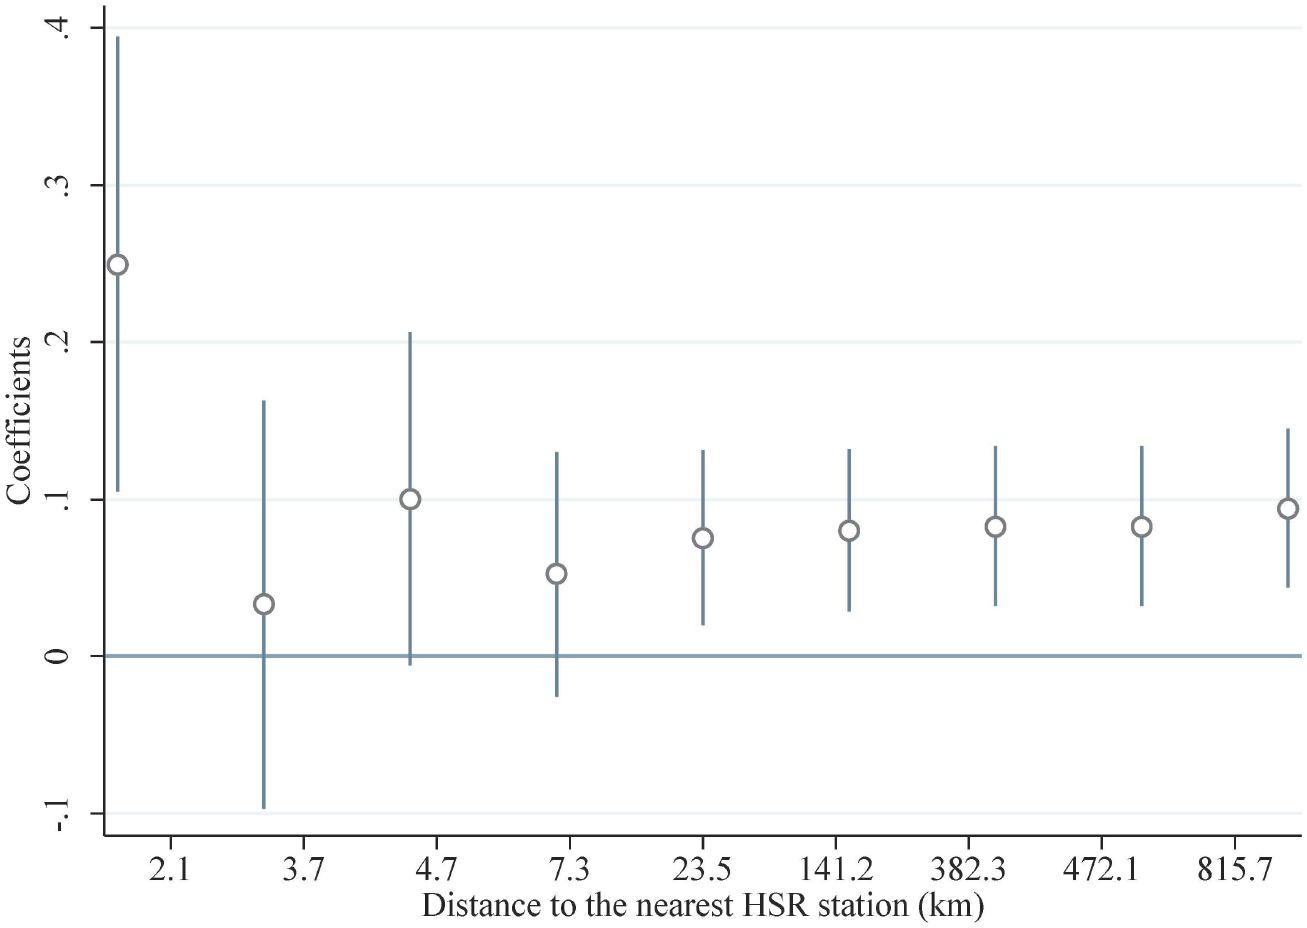
Results on heterogeneity effects across distances
6. Mechanism Identification
6.1. Role of HSR Network Accessibility
Using the social network analysis method to calculate the node degree (local analysis), closeness (global analysis), and betweenness (global analysis), we can explore the ramifications of HSR network accessibility for improving energy productivity. Following Opsahl et al. (2010), HSR network is defined (cities are treated as nodes), and three indicators, i.e., the degree of centrality for local analysis and the closeness and betweenness for global analysis, are constructed to measure HSR network accessibility, based on the social network analysis method.
The degree of HSR station centrality provides an approximation of the structural surroundings of the station. However, it does not consider the global structure of HSR network. Thus, although HSR station connectivity may be high, the connections may be slow (Opsahl et al., 2010). To overcome this difficulty and capture the global feature, the centrality measures of closeness and betweenness are considered.
These two measures hinge on identifying and obtaining the lengths of the shortest paths between and among HSR stations. If the network is unweighted (i.e., the edge weight can be set to 1), the shortest path between two nodes can be found by minimizing the number of intermediaries; the resulting length is defined via the lowest number of edges that directly or indirectly connect the two nodes.
In this study, the closeness is the inverse of the shortest path from one node to other nodes in the network—the more central the node, the greater its proximity to all other nodes. The betweenness is a measure to identify the number of shortest paths that traverse through a node. A higher betweenness value indicates that the short paths that traverse through other stations to the HSR station are more numerous. Such high-betweenness stations can control over flow.
The estimation results are presented in Table 7. We find that the coefficients of degree, closeness, and betweenness are all significantly positive, indicating that strengthening the centrality of HSR cities is conducive to improving energy productivity, which is in line with baseline results. Thus, Hypothesis 2 is verified, i.e., HSR network accessibility contributes to a significant improvement in energy productivity. The policy implications of these findings are that optimizing HSR network centrality can improve energy productivity, and HSR network is conducive to the sustainable development of both the economy and the energy sector. Therefore, policymakers should still vigorously develop HSR construction to improve energy productivity and even promote energy transition by optimizing the centrality of HSR network.
Estimation results of the energy productivity effects of HSR network accessibility
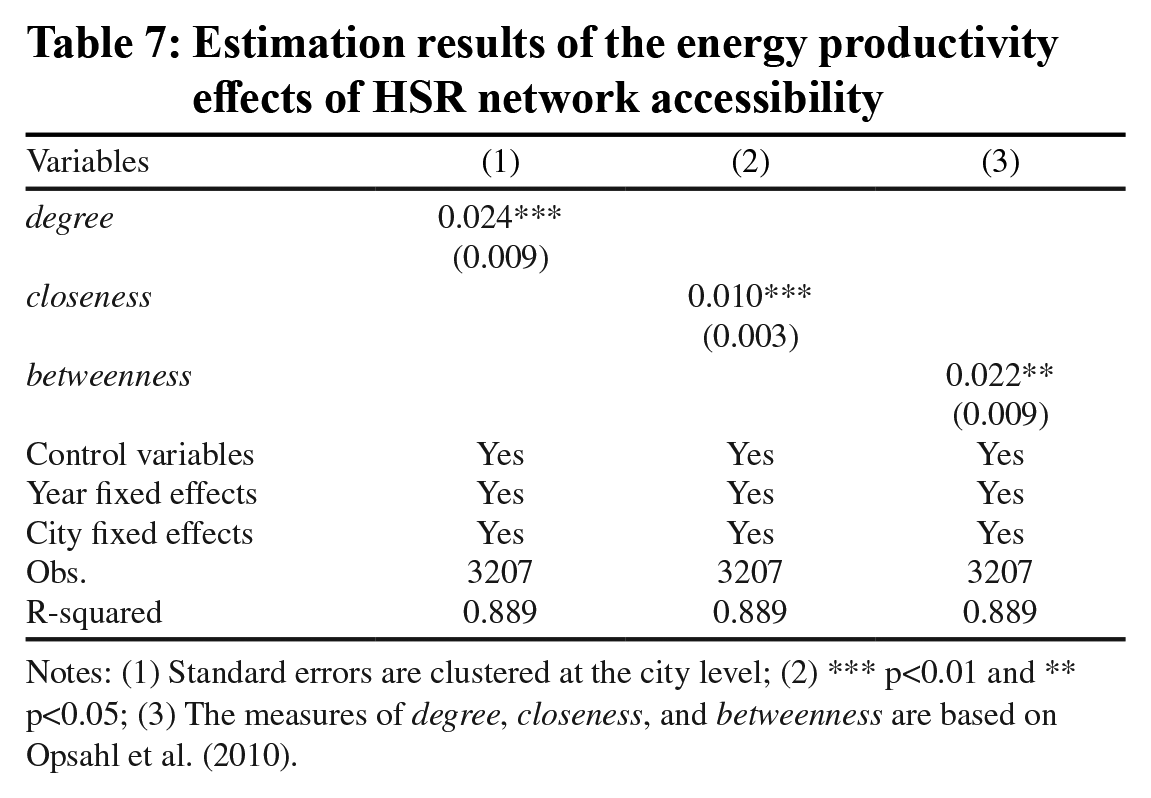
Notes: (1) Standard errors are clustered at the city level; (2) *** p<0.01 and ** p<0.05; (3) The measures of degree, closeness, and betweenness are based on Opsahl et al. (2010).
6.2. Identifying the Mediating Mechanism
Through the DID, PSM-DID, MDM-DID, and IV estimates, we confirm that HSR improves energy productivity. However, so far, the mechanism behind this outcome has not been identified. As mentioned above, HSR may improve energy productivity through a technological innovation effect. Following Baron and Kenny (1986), a three-step method is employed to verify the technological innovation effect. First, energy productivity and HSR are regressed. A significant HSR coefficient suggests that it affects energy productivity. Second, HSR and technological innovation are regressed. In this case, a significant HSR coefficient implies that HSR is responsible for the technological innovation effect. Third, technological innovation and HSR are regressed with energy productivity. In this case, an insignificant HSR coefficient points to a complete mediating effect. In the inverse case (i.e., significant HSR coefficient), the mediating effect is not complete, but significantly exists. The detailed verification process for the above is as follows:


where mit denotes the technological innovation variable. We use three indicators to measure the variable: First, the city technological innovation index (innovation) from Kou and Liu (2017); second, the total number of annual patent applications authorized in a city (patent) from the official patent website (https://app.patentcloud.com/); third, the proportion of science and technology expenditure in the government’s general budget (techexp) from the China City Statistical Yearbook (2004–2017). In Equation (7), gi and ht represent the city fixed effect and the year fixed effect; φit is the error term; f0, τ1, and τ2 are coefficients to be estimated. Similarly, in Equation (8),
The results are shown in Table 8. Column (1) of Table 8 presents that the total effect of HSR on energy productivity is 0.093, which is significantly positive at the 1% level. HSR operation is confirmed to significantly improve energy productivity, and the first step of testing the mechanism is verified. Columns (2) and (3) show the regression results of the HSR effect on the technological innovation, and the effects of both HSR and the technological innovation index on energy productivity, respectively. Column (2) of Table 8 shows that the regression coefficient of HSR is significantly positive at the 1% level, indicating that HSR operation strengthens technological innovation. Column (3) of Table 8 shows that the regression coefficients of both HSR and innovation are significantly positive at the 1% level, indicating that technological innovation effectively promotes energy productivity.
Results of the mediation effect identification
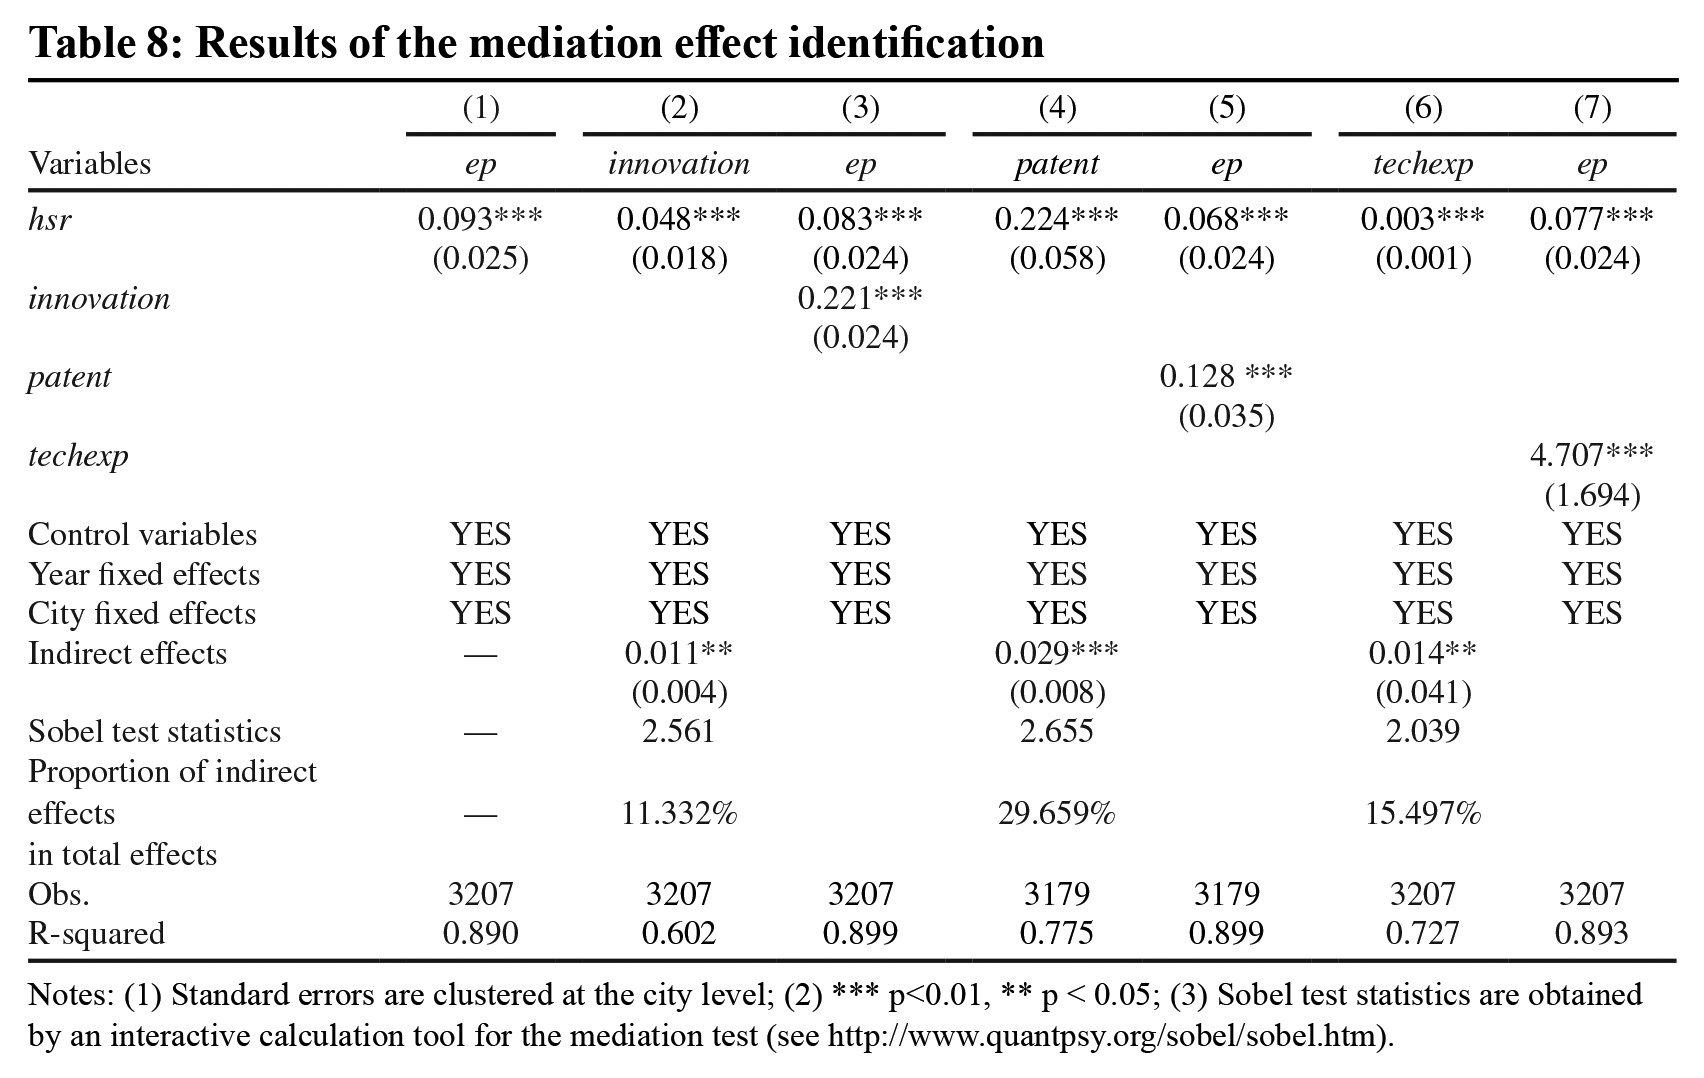
Notes: (1) Standard errors are clustered at the city level; (2) *** p<0.01, ** p < 0.05; (3) Sobel test statistics are obtained by an interactive calculation tool for the mediation test (see http://www.quantpsy.org/sobel/sobel.htm).
Based on these results, HSR operation can strengthen city technological innovation to improve energy productivity. The indirect effect is 0.011
7. Conclusions and Policy Implications
This study uses the data of China’s 248 prefecture-level cities from 2003 to 2016 to examine the effect of HSR on energy productivity. A sound understanding of how HSR affects energy productivity provides valuable insights into the trajectory of China’s energy consumption. The results show that HSR exerts a significant positive effect on energy productivity over the research period. On average, both DID and matching DID estimates show that the marginal impact of HSR on energy productivity is approximately 9%. Considering the potential endogeneity problem, we adopt an instrumental variable method to re-estimate the energy productivity effect of HSR. The results suggest that the baseline results are robust. Furthermore, a series of robustness checks also confirm the causal effects of HSR on energy productivity. Furthermore, the heterogeneity analysis suggests that the positive impacts of HSR on energy productivity gradually grow with increasing quantiles. This further indicates that HSR effectively improves energy productivity in cities closer to HSR stations; however, a significant decay effect emerges with increasing distance to the nearest HSR station.
Besides, HSR connection cannot be completely substituted by traditional railway and aviation in improving energy productivity. Moreover, the mechanism analysis shows that both HSR network accessibility and technological innovation have positive effects on energy productivity, indicating that these two channels strengthen the effect of HSR operation on energy productivity. These findings provide new perspectives for the design of a more balance development strategy in China. Policymakers should consider the role of the existing HSR network and the technological innovation effect, and practitioners should comprehensively consider both transit-oriented development and ecology-oriented development modes.
Pertinent policy implications are summarized as follows. First, HSR can exert a significant positive externality effect on energy productivity. HSR promotes sustainable energy development by optimizing both the structure and accessibility of the intercity network. Currently, HSR construction is a high-tech and high-input project, which has a lagged economic return rate. However, from a long-term perspective, the advantages of HSR outweigh these disadvantages. Therefore, policymakers should vigorously implement HSR and promote a coordinated development of energy sector and other industries.
Second, the shorter the distance to a city with HSR station, the greater the energy productivity effect. Two potential reasons are the unbalanced development of the regional economy and the siphon effect of large cities, which incentivizes enterprises with low energy consumption and high output to move closer to cities with HSR, while most low value-added enterprises move to cities without HSR. This implies that when planning HSR construction, policymakers should adjust measures to suit local conditions, as well as the current situation of regional economy and energy consumption. Moreover, construction policies for transportation facilities that are consistent with the development level of specific regions should be formulated. Cities with higher HSR network centrality generally have higher energy productivity; therefore, governments should continue to develop and improve HSR network to strengthen the network centrality of key cities and thus improve energy productivity.
Third, our finding shows that implementing HSR is conducive to improving technological innovation capacity, which also improves energy productivity. HSR connection can accelerate the long-term flow of technological innovation elements. Thus, policymakers should vigorously improve the comprehensive quality and efficiency of technological innovation and promote the integration of production, education, and research. In addition, enterprises should be encouraged to obtain higher profits through production and service technological innovation, regional industrial upgrading, and structural adjustment. These measures can comprehensively improve energy productivity and lead to high-quality economic development.
Finally, cities that are not connected to HSR should continuously improve their comprehensive competitiveness via economic and social development to obtain HSR investment. Moreover, their interconnection with HSR cities needs to be accelerated, and a seamless connection with HSR cities should be realized by creating various channels, e.g., expressways and accelerated integration into the technological innovation circle of HSR. The flows of production factors and technology and knowledge spillovers also need to be improved to enhance technological innovation capability and energy productivity.
It is noteworthy that more work needs to be done in the future. The present study could not estimate the potential spatial effect of neighboring cities with HSR stations on energy productivity. This limitation may lead to an underestimation of the actual effect of HSR. Thus, a spatial DID approach (e.g., Jia et al., 2021) may be introduced in a future study. In addition, although this paper investigates the benefits of HSR operation, it is also worth to estimate the economic costs of HSR connection in the general context of improved energy productivity.
Supplemental Material
sj-pdf-1-enj-10.5547_01956574.45.1.yayu – Supplemental material for High-Speed Rail and Energy Productivity: Evidence from China
Supplemental material, sj-pdf-1-enj-10.5547_01956574.45.1.yayu for High-Speed Rail and Energy Productivity: Evidence from China by Yantuan Yu and Shuai Shao in The Energy Journal
Footnotes
Appendix A: HSR-Opened Years for Sample Cities
HSR-opened years for sample cities during 2008–2016
| City | Year | City | Year | City | Year | City | Year |
|---|---|---|---|---|---|---|---|
| Beijing | 2008 | Hefei | 2008 | Weihai | 2014 | Jiangmen | 2011 |
| Tianjin | 2008 | Wuhu | 2015 | Dezhou | 2011 | Zhaoqing | 2014 |
| Shijiazhuang | 2009 | Bengbu | 2011 | Zhengzhou | 2010 | Huizhou | 2013 |
| Tangshan | 2013 | Huainan | 2012 | Kaifeng | 2014 | Shanwei | 2013 |
| Handan | 2012 | Maanshan | 2015 | Luoyang | 2010 | Qingyuan | 2009 |
| Baoding | 2012 | Tongling | 2015 | Anyang | 2012 | Dongguan | 2011 |
| Cangzhou | 2011 | Anqing | 2015 | Hebi | 2012 | Zhongshan | 2011 |
| Langfang | 2011 | Huangshan | 2015 | Xinxiang | 2012 | Chaozliou | 2013 |
| Taiyuan | 2009 | Chuzhou | 2008 | Jiaozuo | 2015 | Jieyang | 2013 |
| Yangquan | 2009 | Suzhou | 2011 | Xuchang | 2012 | Yunfu | 2014 |
| Jinzhong | 2009 | Lu’an | 2009 | Luohe | 2012 | Nanning | 2013 |
| Yuncheng | 2014 | Chizhou | 2015 | Sanmenxia | 2010 | Liuzhou | 2013 |
| Linfen | 2014 | Xuancheng | 2015 | Shangqiu | 2016 | Guilin | 2013 |
| Dalian | 2012 | Fuzhou | 2009 | Xinyang | 2012 | Beihai | 2013 |
| Benxi | 2015 | Xiamen | 2010 | Zhumadian | 2012 | Haikou | 2010 |
| Changchun | 2010 | Putian | 2010 | Wuhan | 2009 | Sanya | 2010 |
| Jilin | 2010 | Sanming | 2008 | Huangshi | 2014 | Chongqing | 2013 |
| Siping | 2012 | Quanzhou | 2010 | Yichang | 2010 | Chengdu | 2009 |
| Harbin | 2012 | Zhangzhou | 2013 | Ezhou | 2014 | Deyang | 2014 |
| Qiqihar | 2015 | Nanping | 2015 | Xiaogan | 2012 | Mianyang | 2014 |
| Daqing | 2015 | Longyan | 2015 | Jingzhou | 2012 | Guangyuan | 2015 |
| Suihua | 2015 | Ningde | 2009 | Huanggang | 2009 | Suining | 2009 |
| Shanghai | 2010 | Nanchang | 2010 | Xianning | 2009 | Neijiang | 2015 |
| Nanjing | 2008 | Pingxiang | 2014 | Changsha | 2009 | Leshan | 2014 |
| Wuxi | 2010 | Jiujiang | 2010 | Zhuzhou | 2009 | Nanchong | 2015 |
| Xuzhou | 2011 | Xinyu | 2014 | Xiangtan | 2009 | Meishan | 2014 |
| Changzhou | 2010 | Yingtan | 2014 | Hengyang | 2009 | Guang’an | 2015 |
| Suzhou | 2010 | Ganzhou | 2015 | Shaoyang | 2014 | Ziyang | 2015 |
| Zhenjiang | 2010 | Yichun | 2014 | Yueyang | 2009 | Guiyang | 2014 |
| Hangzhou | 2010 | Fuzhou | 2014 | Chenzhou | 2009 | Liupanshui | 2016 |
| Ningbo | 2009 | Shangrao | 2014 | Yongzhou | 2013 | Anshun | 2016 |
| Wenzhou | 2009 | Jinan | 2008 | Huaihua | 2014 | Kunming | 2016 |
| Jiaxing | 2010 | Qingdao | 2008 | Loudi | 2014 | Qujing | 2016 |
| Huzhou | 2013 | Zibo | 2008 | Guangzhou | 2009 | Yuxi | 2016 |
| Shaoxing | 2013 | Zaozhuang | 2011 | Shaoguan | 2009 | Xi’an | 2010 |
| Jinhua | 2014 | Yantai | 2014 | Shenzhen | 2011 | Baoji | 2013 |
| Quzhou | 2014 | Weifang | 2008 | Zhuhai | 2011 | Xianyang | 2013 |
| Taizhou | 2009 | Jining | 2011 | Shantou | 2013 | Weinan | 2010 |
| Lishui | 2015 | Tai’an | 2011 | Foshan | 2010 | Lanzhou | 2015 |
Appendix B: Tests for the Sample Selection Bias
To address the selection bias from the non-random operation of HSR, this study uses the PSM-DID method to check the robustness of baseline results. The detailed steps are as follows. First, grouping and characteristics variables are used as matching data. Second, the propensity score is estimated using the Logit model. Third, a one-to-one nearest neighbor matching is used with caliper. Matching balance and common value tests are conducted to ensure the liability of matching results. As shown in Figure B1, a better covariate balance is achieved through the one-to-one nearest neighbor matching with the caliper. The post-matching absolute standardized biases for all covariates are under 15%, indicating that a good covariates balance is obtained (Rosenbaum and Rubin, 1985).
The balance test is used to examine the differences in the means of the variables pre- and after- matching; it is also used to verify the distribution of variables between the treatment and control groups over the same two periods. Figure B2 compares the estimation of the kernel density of propensity score pre- and after- matching. After the matching, the distribution trends of both groups are consistent.
Appendix C: Spatial Distribution of Courier Stations and Routes in the Ming Dynasty
Appendix D: Estimating Energy Productivity Based on the Stochastic Frontier Analysis
For robustness checks, we estimate energy productivity based on the Cobb-Douglas production function. Capital, labor, and energy consumption are treated as input variables while the gross domestic product (GDP) is treated as dependent variable. Energy productivity estimation model can be expressed as follows:
where K, L, and E denote capital stock, labor force, and energy consumption, respectively; Y represents GDP.
The stochastic frontier analysis used in this study is the “true” fixed effect model suggested by Greene (2005), because the characteristics of heterogeneous groups of cities can be reflected when using the model. The model can be presented as follows:
where i and t denote cross-section and time-series dimensions, respectively; kit, lit, and eit represent capital stock, labor force, and energy consumption for city i and year t; εit represents the error term, which can be divided into two components: idiosyncratic error (vit) and technical inefficiency (uit). We further assume that the technical inefficiency term follows a half-normal distribution as follows:
Given that, the energy productivity can be estimated as (Du et al., 2020):
where ep represents energy productivity, and
Acknowledgements
This paper is supported by the National Natural Science Foundation of China (Nos. 71903068, 71922015, and 71773075), the Chinese National Funding of Social Sciences (No. 21ZDA084), and Shanghai Soft Science Research Program (No. 22692103400).
1.
This method is also called the single or partial factor productivity method. This method is used because (1) it measures productivity, which is easier to relate to specific processes, and (2) it alleviates the endogeneity problem in the empirical analysis, to some extent.
3.
The Beijing-Tianjin HSR, the first new-generation HSR with a maximum speed of 350 km/h, started operation in August 2008.
5.
The original data of rail rays in 1990 and courier stations during the Ming dynasty are from Baum-Snow et al. (2017) and ![]() , respectively.
, respectively.
References
Supplementary Material
Please find the following supplemental material available below.
For Open Access articles published under a Creative Commons License, all supplemental material carries the same license as the article it is associated with.
For non-Open Access articles published, all supplemental material carries a non-exclusive license, and permission requests for re-use of supplemental material or any part of supplemental material shall be sent directly to the copyright owner as specified in the copyright notice associated with the article.