
Abstract
Over the period 2016–2021 Australia’s National Electricity Market (NEM) experienced an investment supercycle with 16,000MW of new utility-scale renewable plant commitments in a power system with a peak demand of 35,000MW, and the disorderly loss of 5,000MW of synchronous coal-fired plant. This placed strains on system security, most visibly in the distribution of the power systems’ frequency, requiring material changes to the NEM’s suite of Frequency Control Ancillary Service (FCAS) markets. Utility-scale batteries are ideally suited for FCAS duties, but there is no forward price curve for FCAS markets, nor is there any systematic framework for determining equilibrium prices that might otherwise be used for investment decision-making. In this article, we develop an approach for quantifying long run equilibrium costs and stochastic spot prices in the markets for Frequency Control Ancillary Services, with the intended application being to guide the suitability of utility-scale battery investments under conditions of uncertainty and missing forward FCAS markets.
1. Introduction
As with many of the world’s major power systems, Australia’s National Electricity Market (NEM) is experiencing a rapid supply-side adjustment. Policy discontinuity associated with Australia’s 20% Renewable Energy Target and the disorderly exit of ~5000MW of aging coal plant produced sharply rising spot and forward electricity prices. A surge of investment in variable renewable energy (VRE) followed. Over the period 2016–2021, there were more than AUD$26.51 billion in utility-scale plant investment commitments across 135 projects, totalling 16,000MW. Simultaneously, households added 8,000MW of rooftop solar PV behind-the-meter. In a power system with a ratcheted peak demand of 35,000MW, the addition of 24,000MW of variable renewable resources over a five-year window could only be described as a renewable investment supercycle (Simshauser and Gilmore, 2022).
The usual caveats apply.
Accompanying the changing plant mix was a sharp deterioration in power system frequency. Historically, the large fleet of (synchronous) coal, gas and hydro generators would ensure that the NEM’s primary commodity, electrical energy, was delivered at the appropriate frequency (50Hz) through a series of 5-minute spot markets for Frequency Control Ancillary Services (FCAS). Australia’s markets for FCAS are co-optimised with the spot electricity market and have historically been highly successful at delivering low-cost frequency management. In the NEM, FCAS markets had been negligible in value, typically comprising less than 0.5% of total annual electricity market turnover. The reason for these low prices was that all operational coal, gas and hydro plant had excellent FCAS supply capability, vastly exceeding real-time operational demand under most conditions.
But the disorderly exit of ~5000MW of coal plant and reduction in operating duties of gas plant meant the supply of FCAS diminished sharply—especially in NEM regions such as South Australia. Simultaneously, rising variable solar/wind resources 2 led to increasing demand for frequency management duties. The changes were material—FCAS Regulation costs from 2003–2015 averaged ~$1.60 per MW per hour, but surged to $26 during 2016–2021. Further, FCAS Reserves jumped from $4/MW/hr to $23/MW/hr. 3 Given the task of decarbonisation, this trend is unlikely to be unique to Australia.
Subsequently, 1,400MW of utility-scale battery commitments have been made with another ~3,000MW permitted and a further ~8,000MW in various stages of development (i.e. total ~12,500MW). Underpinning battery investment momentum is the fact that they are ideally suited to FCAS duties, and, FCAS prices have been elevated for reasons outlined above. To obtain finance, investment cases necessarily require forward market prices, or where these do not exist, price forecasts from structural models of the power system to identify project specific revenues in portfolio expansion plans. However, FCAS Regulation and FCAS Reserves are 5-minute spot markets with no visible forward market and forecasting multiple co-optimised spot markets is challenging (Section 2.3). Quantitative analysis across multiple international markets by Lazard (2021) shows spot market arbitrage typically contributes only ~40% of requisite revenues. In the NEM, the overwhelming majority (> 60%) of battery revenues are currently derived from FCAS Regulation and FCAS Reserve duties (ARENA, 2021), or other revenue stacking alternatives.
The purpose of this article is to develop a framework for projecting long run equilibrium costs through developing Levelised Cost of Frequency Control Ancillary Service (LCoFCAS) metrics for the various product lines, drawing on the principles in Psarros, Karamanou, and Papathanassiou (2018). From the LCoFCAS metrics, we then derive stochastic price traces, drawing on the principles from Simshauser (2020). Just as plant entry costs provide guidance to equilibrium spot electricity prices over the cycle, so too can LCoFCAS guide long run equilibrium pricing if market conditions allow for a reorganisation of capacity to an efficient mix. Given the expected transformation of the Australian grid, we expect FCAS spot prices to be mean reverting and to converge to underlying costs (i.e. LCoFCAS) on average, noting that actual prices can and are likely to vary above and below cost in any given period, hence the use of stochastic price traces.
An important principle that underpins our work is that FCAS provision has a genuine opportunity cost given such duties are co-optimised with the NEM’s spot market for electricity.
Accordingly, we start by dissecting the underlying cost of reserving capacity for FCAS Regulation and FCAS Reserve duties from various technologies, including the incumbent (and contracting) coal fleet, batteries and VRE.
Our findings are important. They show that while the cost of FCAS initially rises due to plant exits clearing historical oversupply, unit prices are likely to decline over time as technologies move down their experience cost curves. We also find long duration (3–4 hours) batteries in Australia’s NEM will be better suited to delivering FCAS Regulation, whereas short duration batteries (1–2 hours) will be better suited to FCAS Reserve duties. Ultimately however, capacity reserved for FCAS duties incurs an opportunity cost from making headroom available or from being activated during inopportune moments. Therefore, we consider it unlikely that FCAS prices will fall to negligible levels in equilibrium, despite projections for high battery capacity in the NEM.
This article is structured as follows. Section 2 provides a primer on FCAS and a review of relevant literature. Section 3 develops a normative approach to short-run costs/prices of FCAS. Sections 4 and 5 contrast our normative values with market results. Section 6 considers the link between underlying FCAS costs and stochastic price traces - noting that just like in energy markets, actual market prices may be higher or lower than the LCoFCAS in any given year. Policy implications and concluding remarks follow.
2. FCAS Primer and Review of Literature
A distinguishing characteristic of electrical energy is its moment-by-moment requirement to match supply and demand. Maintaining continuous electrical flows through a large, interconnected power system requires extraordinary levels of coordination (MacGill, 2010). While real-time power (MW) is the primary commodity, an array of other services auxiliary to its supply are required to ensure an accurate voltage (required by consumer appliances) and stable frequency 4 (required by synchronous generators) (Stoft, 2002; Pollitt and Anaya, 2021).
Our analysis is focused entirely on Frequency Control Ancillary Services or FCAS, which are required to ensure a reliable and high-quality power supply (Ela et al., 2012). Any supply-demand imbalance on the power system is first signalled by adverse deviations in frequency. 5 Frequency instability is an outcome and an indicator of, a disturbance event (Agranat, Macgill, and Bruce, 2015). Market prices will therefore lag, not lead, frequency deviations.
2.1 Management of Power System Frequency & NEM Market Design
By way of brief background, power is generated at a single synchronised AC frequency measured in cycles per second or Hertz (Hz). In the NEM, thermal generators synchronise to the grid at 50 cycles per second (50Hz) meaning the fleet of turbines all rotate at exactly the same speed (i.e. 50 cycles x 60 seconds = 3000RPM for large steam turbines). It is vitally important that frequency is maintained as close to 50Hz as possible. Material deviations in the demand-supply balance, even for a few seconds, can send frequency outside tolerable limits, at which point generators disconnect themselves to avoid damage (Simshauser, 2017). 6 In extreme cases this may culminate in the collapse of a power system (Green and Staffell, 2016).
The management of frequency has historically been defined according to the response speed and capability of the local fleet of conventional generators (Neuhoff, Wolter and Schwenen, 2016). 7 Australia’s NEM is somewhat unique amongst restructured electricity markets with its centrepiece being a single platform involving a real-time mandatory energy-only gross pool spot electricity market and eight 8 FCAS spot markets, co-optimised across five imperfectly interconnected regions with 5-minute dispatch resolution and settlement (MacGill, 2010). A single Market Operator coordinates all regions and markets, and again uniquely, without any formal day-ahead market 9 or organised capacity market (Riesz, Gilmore, and MacGill, 2015). Generators manage their own unit commitment and other inter-temporal scheduling constraints, including how they offer their generation into the spot electricity market and spot FCAS markets. The FCAS spot markets are organised into FCAS Regulation and three FCAS Reserve markets for raise and lower services, 10 viz.
6-second FCAS Reserves (raise / lower),
60-second FCAS Reserves (raise / lower),
5-minute FCAS Reserves (raise / lower), and
FCAS Regulation (continuous raise / continuous lower).
FCAS Reserve duties are supplied by resources on a contingent basis, and effectively translate into withholding capacity (most of which has historically been “spinning”). FCAS Reserves are then physically called upon to active duty during non-trivial supply- or demand-side shocks, viz. from the unexpected breakdown of a large generator, network element or block-load. These large system shock events require a more substantive response than FCAS Regulation because frequency will deviate well beyond the Normal Operating Band (i.e. 50Hz +/– 0.015Hz)—the most common occurrence involving the loss of a large generating unit (Simshauser, 2017). Such an event will typically see frequency fall to ~49.5Hz, as Figure 1 illustrates.
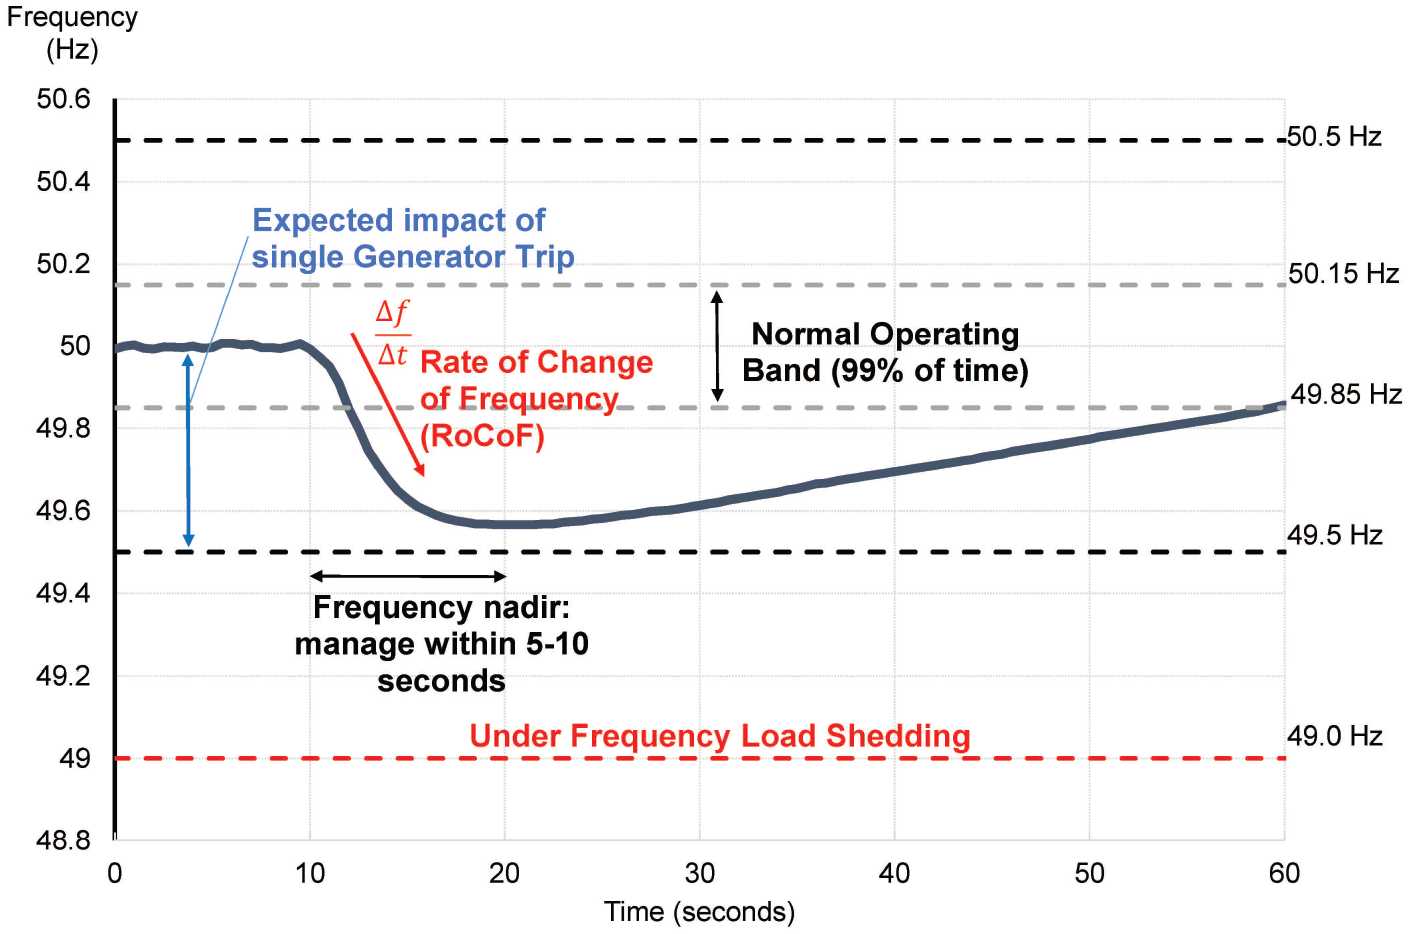
Frequency deviation in the presence of a loss of a large generating unit
When a supply-side disruption occurs, the speed that frequency falls (i.e. the Rate of Change of Frequency or RoCoF) is crucially important (Keeratimahat, Bruce, and Macgill, 2016). The slower the RoCoF, the easier deviations are to arrest (Agranat, Macgill, and Bruce, 2015). Synchronous generators have a store of kinetic energy due to the rotational momentum in their rotors. NEM coal generators, which weigh between 106–233t+, 11 are spinning at 3000RPM and electrically coupled to the power system, means that rotation frequency has some initial inertia (Simshauser, 2017). Some new grid forming inverters also deliver an inertia-like response proportional to the RoCoF. Any change to frequency from a disturbance event will first meet resistance from this passive physical response (Riesz, Gilmore, and MacGill, 2015). Inertia services are valuable for maintaining frequency but historically have been supplied in such abundance that no formal market was considered necessary.
A rapid response is required to arrest frequency decline and avoid damage to equipment or the collapse of the power system. If insufficient response is provided and the frequency falls below 49Hz, then automated non-price load shedding occurs, known in Australia as Under Frequency Load Shedding or UFLS (Simshauser, 2017) . 12
Minimum frequency must be achieved within 5–10 seconds in order to avoid system collapse (Ela et al., 2012). In the NEM, apart from inertia and FCAS Regulation, the first market response comes from 6-second FCAS Reserves. Synchronous generators usually have store of excess steam and latent energy in boilers which can be released to give an initial boost of output (essentially additional output not associated with ‘additional fuel’ to boilers) and hence deliver a raise response. In the case of batteries, stored energy can be rapidly deployed based on highly customisable software response—either rapidly increasing or decreasing real power output. Wind or solar farms generating below their maximum output can also deliver a raise response through either electronics (e.g., tuning inverter parameters) or hardware (e.g., adjusting blade orientation on wind farms); the reverse can deliver a Lower response.
6-second resources are deployed without Market Operator intervention to enable an orderly transition to 60-second 13 FCAS Reserves, which further stabilise frequency and enable an orderly transition to 5-minute FCAS Reserves (Riesz, Gilmore, and MacGill, 2015). These collective resources are intended to restore the system back to its nominal 50Hz frequency over a 5-minute window (see Figure 1).
FCAS Regulation duties maintain frequency within a tight range (50Hz +/– 0.15Hz) under system normal conditions. Response is supplied by generators to the Market Operator using Automatic Generation Control (AGC), which involves the real-time altering of MW output in line with small demand fluctuations in between 5-minute dispatch intervals. Typically, generators receive AGC signals every four seconds, which instructs the unit to move up (raise) or down (lower). Signals are based on the Market Operator’s assessment of the supply-demand balance, which in the NEM is a rolling average of frequency deviations from 50Hz. As with FCAS Reserves, output is adjusted by carefully changing fuel throughput for thermal plant and through software or hardware response for VRE and batteries. Very flexible loads can also respond by changing consumption.
As noted earlier, the NEM’s design and associated spot markets have been highly successful at reducing FCAS costs prior to VRE entry. Procurement over 5-minute intervals with short gate closure periods delivered efficiency compared to long-duration procurement contracts (Müsgens, Ockenfels, and Peek, 2011).
2.2 Impacts of VRE
A challenge of rising VRE is how frequency is to be managed as coal plant exits. This changing plant mix means the inherent supply of inertia and of FCAS plant capacity is falling (MacGill, 2010; Hogan, 2013; Green and Staffell, 2016). Recall that VRE plant connect asynchronously to the power system with power electronic interfaces, and are not physically coupled to system frequency. Consequently, VRE plant do not provide inertia during frequency deviations (Agranat, Macgill, and Bruce, 2015), nor are they designed to undertake FCAS duties (MacGill, 2010). As the supply of inertia falls with exiting coal plant, the NEM’s existing quantities of FCAS Regulation and the speed of 6-second FCAS Reserve may become inadequate to arrest frequency deviations, and consequently, a greater array of FCAS services may be required (Pollitt and Anaya, 2020; Simshauser and Gilmore, 2022). 14
Changes also extend to likely FCAS quantities demanded by the Market Operator. The NEM’s FCAS quantities were initially set in 2004 and were maintained at the same levels for well over a decade during which the NEM had virtually no VRE. Administratively determined FCAS Regulation quantities had been set to +/–130MW (i.e. raise/lower services). FCAS Reserves then comprised a further ~620MW under system normal conditions (i.e. a total FCAS suite of 750MW, equivalent to n-1 given the largest NEM generating unit is 750MW 15 ). Counterintuitively, FCAS quantities were held constant despite the changing supply mix.
Unsurprisingly, the distribution of frequency began to disperse (see Figure 2) and eventually in aggregate, breached the NEM’s Frequency Operating Standard (FOS), that is, to maintain frequency within the so-called ‘Normal Operating Band’ of 50Hz +/–0.15Hz for > 99% of time. FCAS Regulation quantities demanded by the Market Operator were (finally) reviewed from 3 October 2018, rising from a minimum of 130MW to 220MW (and at times to as much as 400MW) as highlighted in Figure 3.
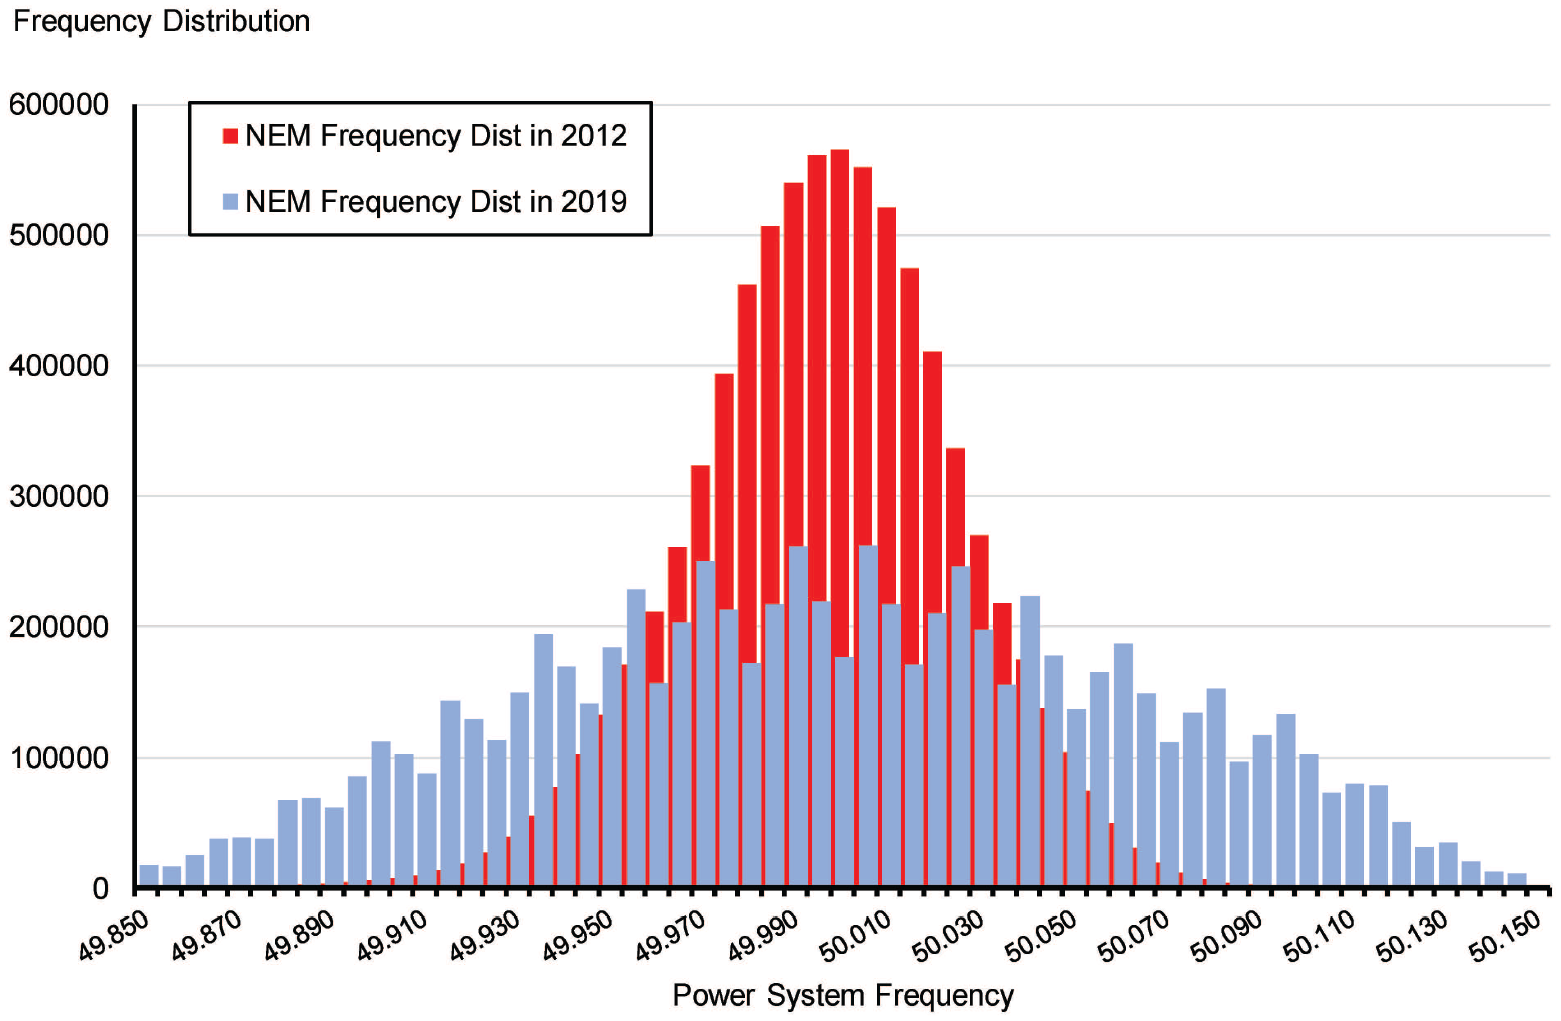
Distribution of NEM Frequency (4 second data 2012 vs 2019)
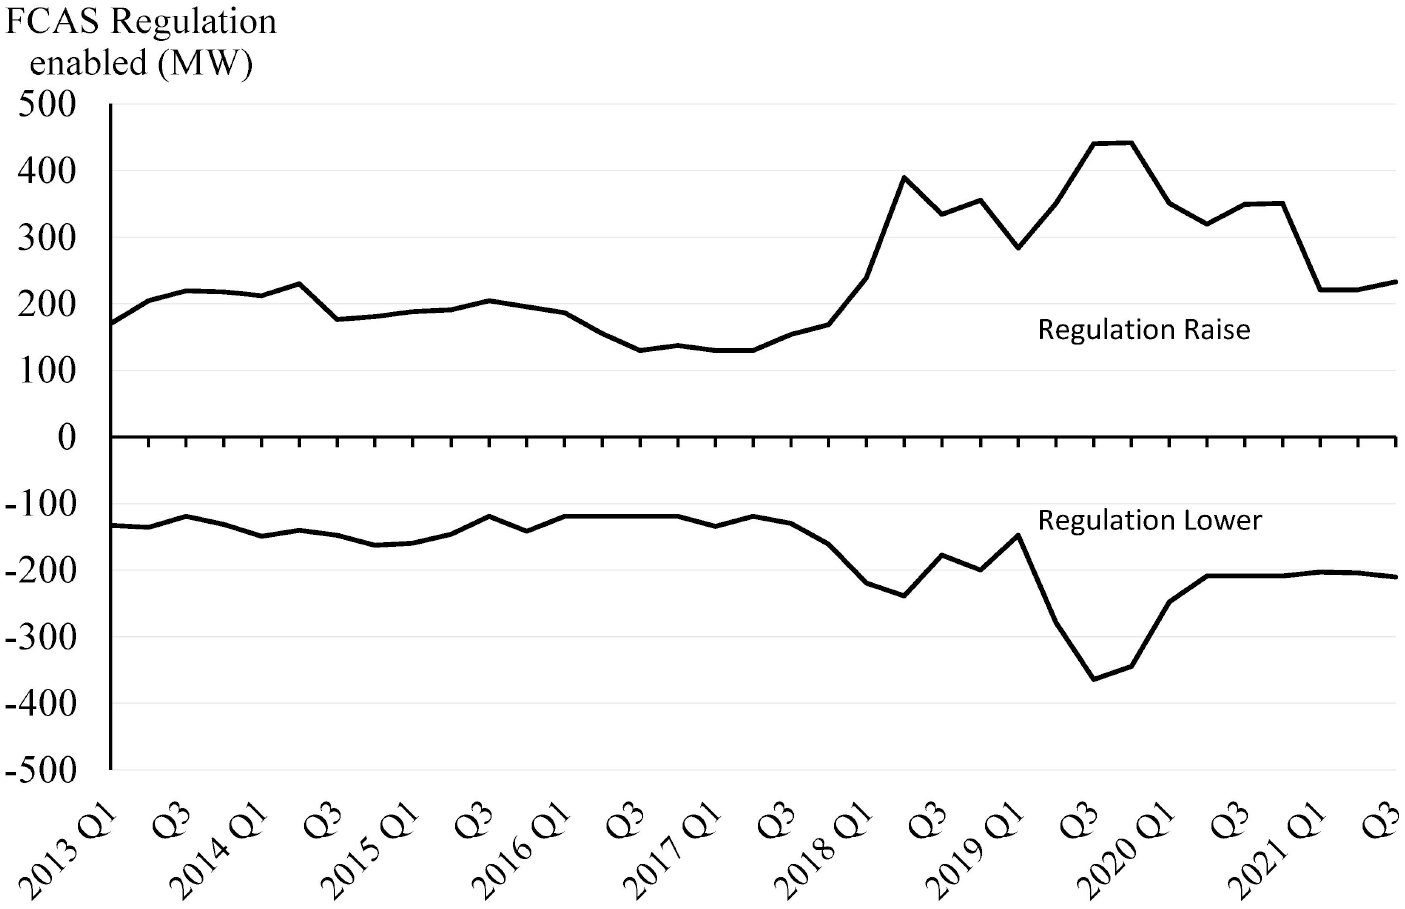
90th Percentile Demand for FCAS Regulation (2013–2021)
2.3 FCAS prices
As noted earlier, historically the supply of FCAS Regulation and FCAS Reserves were dominated by coal, gas and hydroelectric plant. Batteries are now beginning to deliver a larger share of the FCAS product suite. While investors can readily undertake back-casts of potential revenues for future power projects using historical prices, investment cases for batteries will require forward projections of all markets and services (for a broad overview, see Weron, 2014). Modern structural power system models which combine the principles set out in Calabrese (1947), Boiteux (1949), and Booth (1972) depend heavily on the input assumptions (capital costs, fuel prices, plant availability, plant entry and exit). Pricing is impacted by dynamics on multiple timescales (Zhu et al., 2017) and is non-linear, driven by behavioural choices of participants with diverse goals and incentives.
Historically at least, forecasting the price of FCAS Regulation and FCAS Reserves was more complex than forecasting spot electricity prices. The supply curve for electricity production is strictly upward sloping given the usually diverse range of plant technologies setting base, intermediate and peaking prices based on observed marginal running costs. In an oversupplied wholesale market comprised of synchronous plant, the FCAS supply curve, being a joint product, had close to zero marginal costs (hence prices clearing at $1.6–4.0/MW/h on average from 2003–2015).
However with synchronous coal plant exiting, these dynamics are changing. At the highest level, the market value of FCAS Reserves should reflect the opportunity cost of withdrawing resources from the spot electricity market, which in turn depends on the generation mix, its flexibility, and expected utilisation (Aasgard and Roti, 2016; Hirth and Ziegenhagen, 2015).
The most theoretically straightforward approach is to develop an objective function which minimises total system costs subject to various constraints (Doorman and Nygreen, 2002; Fosso and Belsnes, 2004). In practice, simulations will require unit commitment decisions and an input quantity of FCAS Reserves to procure. Furthermore, aside from absolute supply costs, the slope of supply curves also contributes to the opportunity costs of reserve provision (Just and Weber, 2008). Attarha, Scott, and Thiébaux (2020) also consider how network constraints and competing value stacks in the Australian context need to be incorporated into bidding. Finally, market design settings also impact FCAS market prices (Gan and Litvinov, 2003).
2.4 Levelised cost approach
The theoretical benchmark for price forecasting studies tends to focus on underlying costs in equilibrium. This can of course be problematic in the case of a joint product. For example, FCAS prices sat below such levels in markets comprised of partially loaded synchronous plant in an oversupplied state (as outlined above in Section 2.3). But with the exit of coal plant and the rising requirement for FCAS duties, cost-based estimates are becoming more relevant as our analysis in Section 4 subsequently reveals.
For investment in renewable plant, Levelized Cost of Energy (LCoE) calculations can be used, albeit care is required. LCoE is defined as the unit cost ($/MWh) that would yield the same discounted cost of supply, and is calculated by the discounted cost of supply divided by the discounted quantity of power produced 16 (Roth and Ambs, 2004). The quantity must be discounted to allow for the possibility of varying output over time. LCoE is of course imperfect because it is sensitive to discount rates and resource assumptions used (Aldersey-Williams and Rubert, 2019), but above all, treats technology output as homogeneous products, and as if governed by the law of one price (Mills and Wiser, 2012; Edenhofer et al., 2013). In real-time, the law of one price does apply; output from wind and solar are good substitutes for thermal generation. However, when demand is higher than forecast, all else equal, dispatchable generators increase output and receive a higher average price. Conversely, stochastic generators rarely reduce output in periods of oversupply, and hence sell disproportionately at lower prices (Hirth, Ueckerdt, and Edenhofer, 2016).
Nonetheless as a metric, LCoE is useful because average dispatch-weighted prices over the business cycle must invariably converge to long-run average costs of an efficient capital mix (Nelson, 2018). And while actual prices can be impacted by transient market power (raising prices above efficient levels) or by ‘two-step pricing’ (lowering prices below efficient levels), like all commodity markets, energy markets are mean-reverting. The case of FCAS is somewhat nuanced in that historically there was a vast oversupply of capable resources relative to constant demand (as outlined in Section 1). However, on a forward-looking basis, with ongoing coal plant exit (reduction in supply of both FCAS and energy firming providers) and greater FCAS service requirements with rising intermittency (increase in demand), we expect FCAS markets will also be mean-reverting. That is, when prices are high new entrants will enter the market. And when prices are low due to overcapacity, plant will preference operating in other markets (noting plant cannot produce electricity in the spot market and provide FCAS reserves with the same MW, so units will co-optimise output). Section 6 explores this in more detail.
Psarros, Karamanou, and Papathanassiou (2018) introduced an equivalent concept of a Levelised Cost of Reserves, defined as the discounted cost of delivering primary reserves divided by the discounted quantity of reserves delivered. While previous authors (Kempton and Tomić, 2005) have considered the underlying cost of provision in the context of profitability assessments, a Levelised Cost of Reser ves, or more specifically, a Levelised Cost of FCAS (LCoFCAS), provides a valuable benchmark (i.e. long-term cap on average prices) for investment analysis and for policy makers who may not have access to complex market models and seek intuition around future trends. Sensitivity of future costs to various inputs can be quickly tested and are not influenced by spurious stochastic results that can make comparing market modelling scenarios difficult.
3. Normative Approach to Modelling Short- and Long-Run FCAS Prices
Before considering the long-run cost of FCAS, it is helpful to define a normative approach to the short run pricing of Regulation and Reserve duties. Following Gan and Litvinov (2003) and Müsgens, Ockenfels, and Peek (2012), any generation technology (i.e. coal, battery, renewables) that curtails output in the spot electricity market to provide headroom in FCAS markets misses out on the wholesale market price PE, but avoids marginal running costs MC. 17
3.1 FCAS from coal plant
For a generator that offers no FCAS and produces G into the electricity market where spot prices Ps are above its marginal running costs MC, net market revenue over period ∆t would be:

For a generator that provides (raise) Reserve duties at a price

The critical parameter here is kR—the expected utilisation of plant Reserves (for raise duties), defined as average MW per MW of activation. Note that for kR = 100%, the resource is indifferent to energy production or reserve duties (it will deliver and be paid for its energy in either case), while for kR = 0 the cost of reserve duties is the simple opportunity cost of lost energy revenue minus avoided marginal running costs. The general breakeven Reserve price is given by solving when revenue streams are equivalent with or without Reserve duties.
When Ps < MC, an inflexible thermal generator would lower production output to its minimum stable load and would freely make the balance of productive capacity available for Reserve duties, but would incur net costs of

and
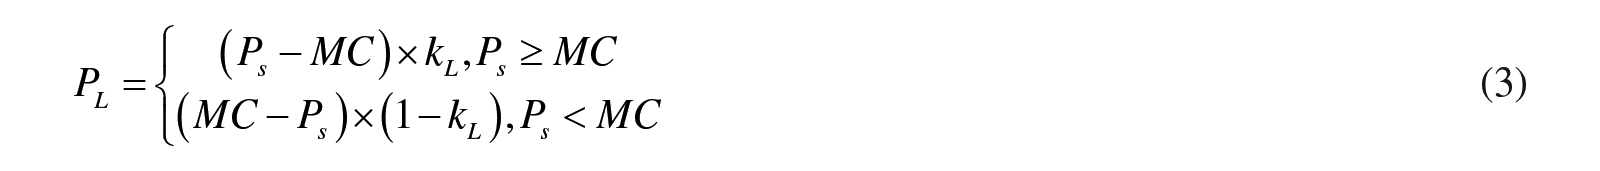
Note this assumes the generator has the freedom to dispatch into either a raise or lower Reserve market. If there are network or economic constraints, more specific calculations may be needed.
In order to solve for Equation (3), values for kR and kL are required, which can be imputed from historic NEM data. It is convenient to define this as the product of percentage of time the Raise or Lower service is activated and the percentage used when activated,
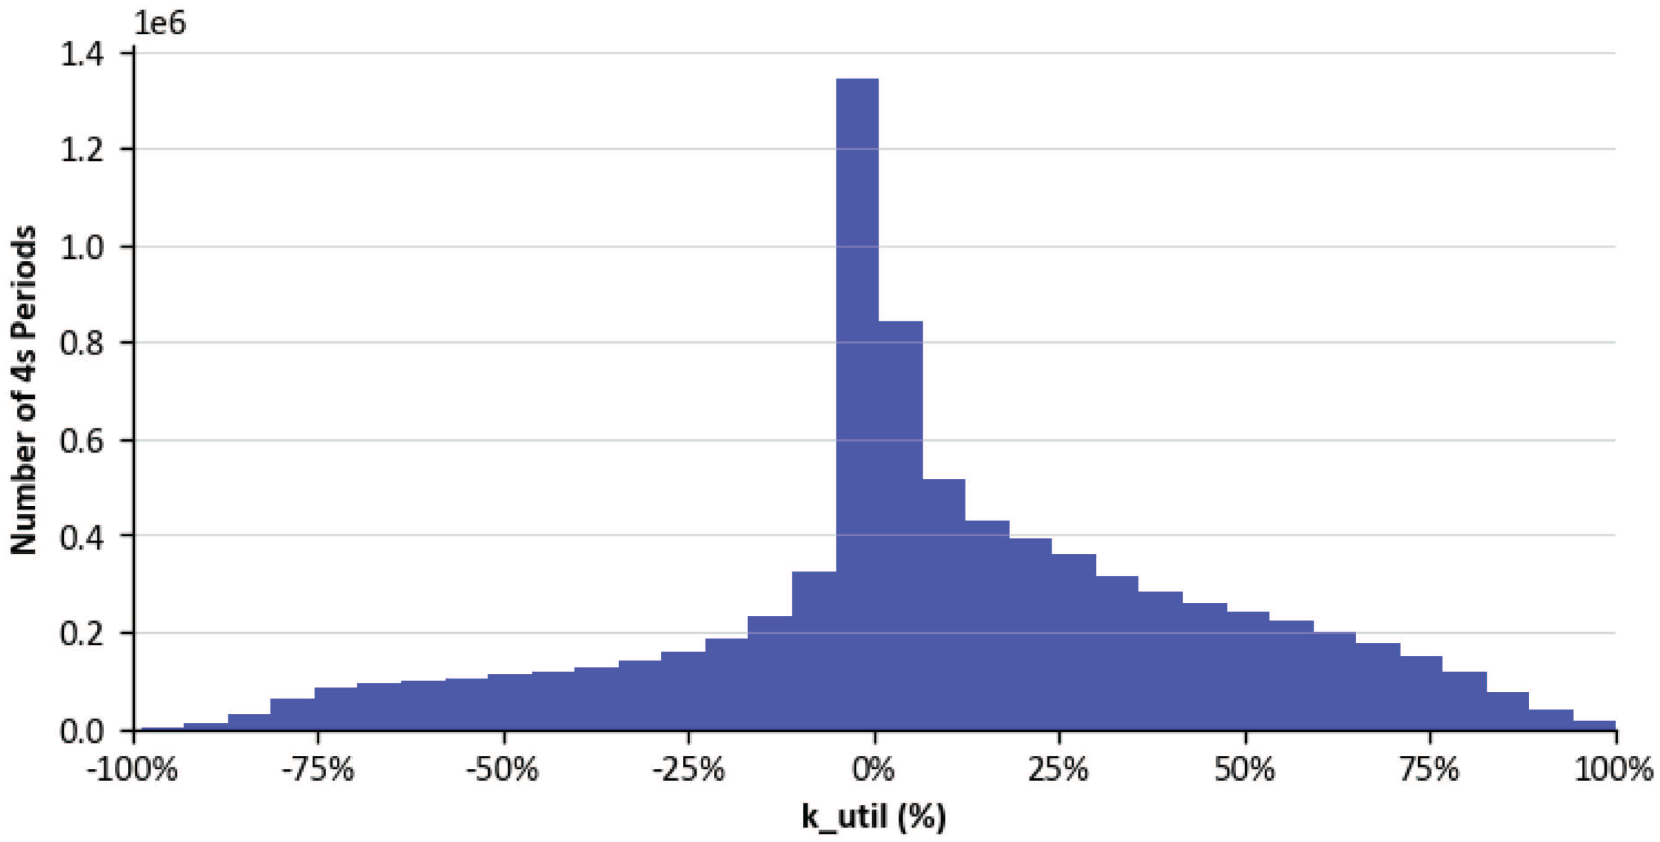
Distribution of FCAS Regulation utilisation
Historically, utilisation varies but within a narrow range as illustrated in Figure 5. For example, over 2021, kact% increased but kutil% decreased, leaving their product kR flat. Accordingly, we will adopt kR = 18.7% as a base case and consider sensitivities in Section 5.
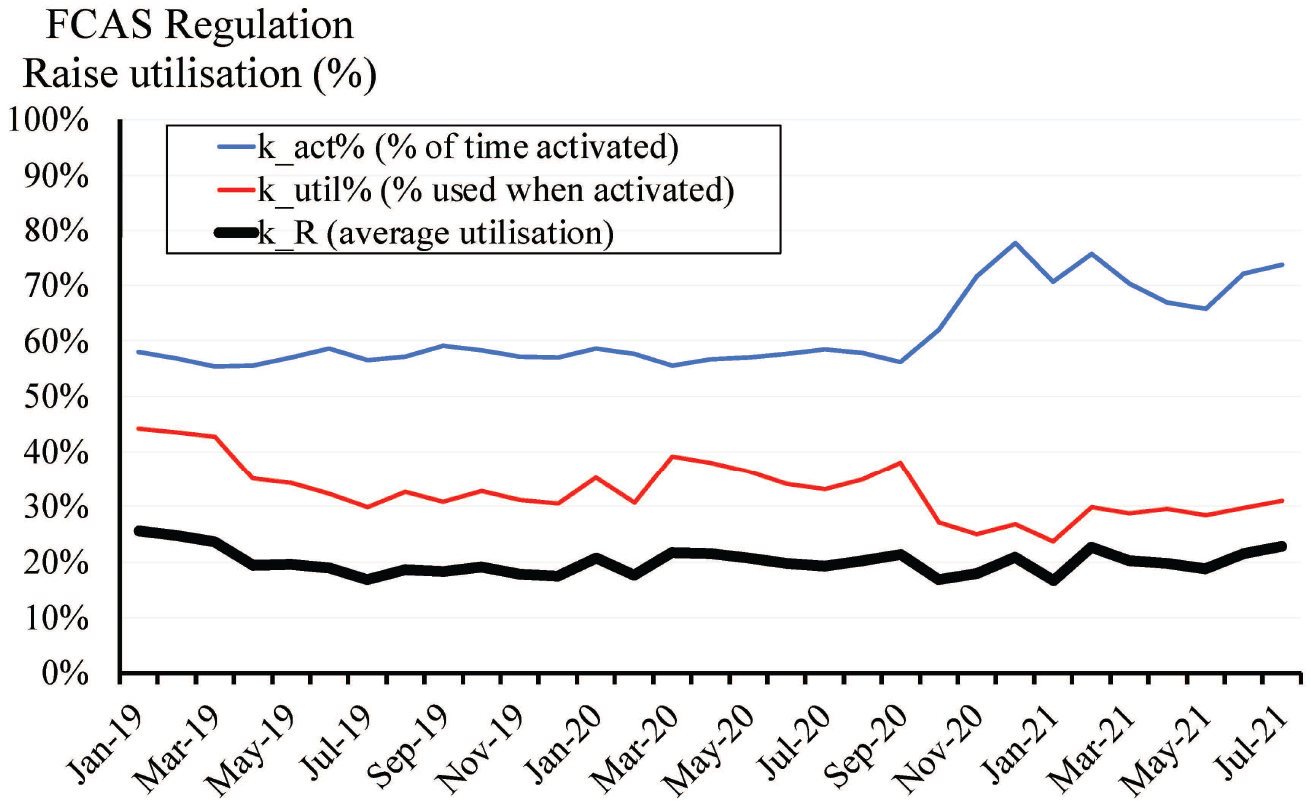
Monthly FCAS Regulation Raise activation%
Given a value for kR of 18.7% and assuming coal generators in the NSW region of the NEM have marginal running costs
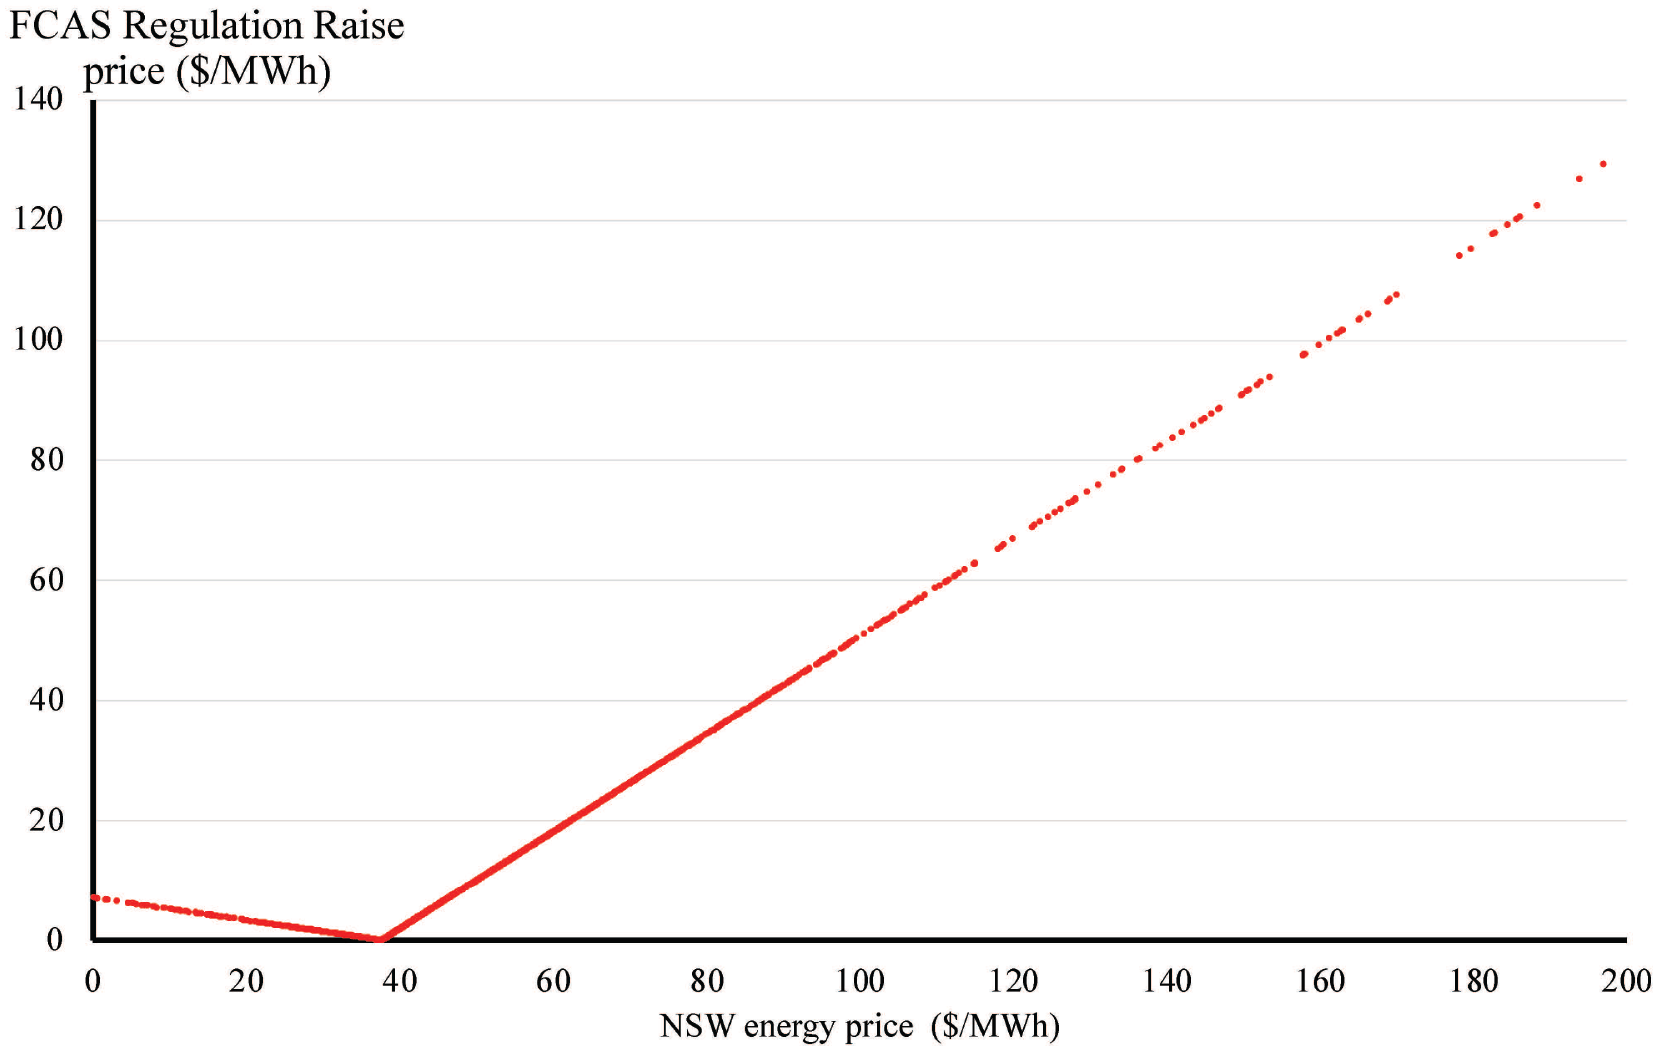
Theoretical model of FCAS Regulation Prices in the NSW region
Finally are the relative values for FCAS Reserves. Unlike FCAS Regulation which is a continuous active duty, FCAS Reserve duties are designed to be a form of Reserve which is only activated in response to a material frequency disturbance (>0.15Hz). Consequently, in this instance
3.2 FCAS from Batteries
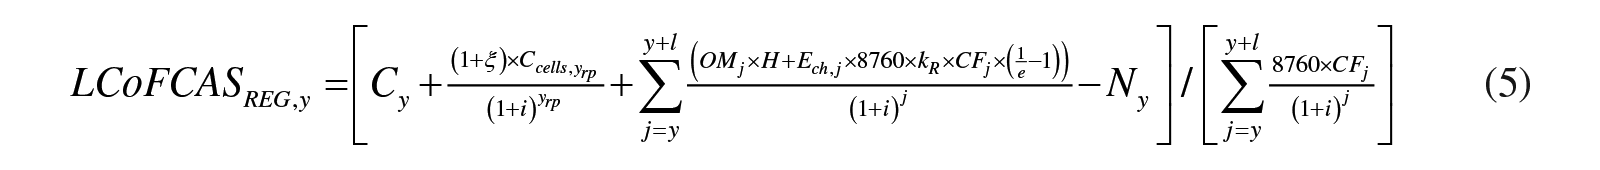
Delivering FCAS Reserves (primary response) or FCAS Regulation (secondary response) is ideally suited to utility-scale batteries, which can follow targets or undertake proportional response duties to local frequency changes virtually instantaneously. We define the LCoFCAS for delivering baseload FCAS Regulation services from a dedicated, grid-scale battery, based on projected capital costs in year y by the total cost (minus any non-market revenues) divided by the total reserve duties provided over the lifetime of the battery, as follows:

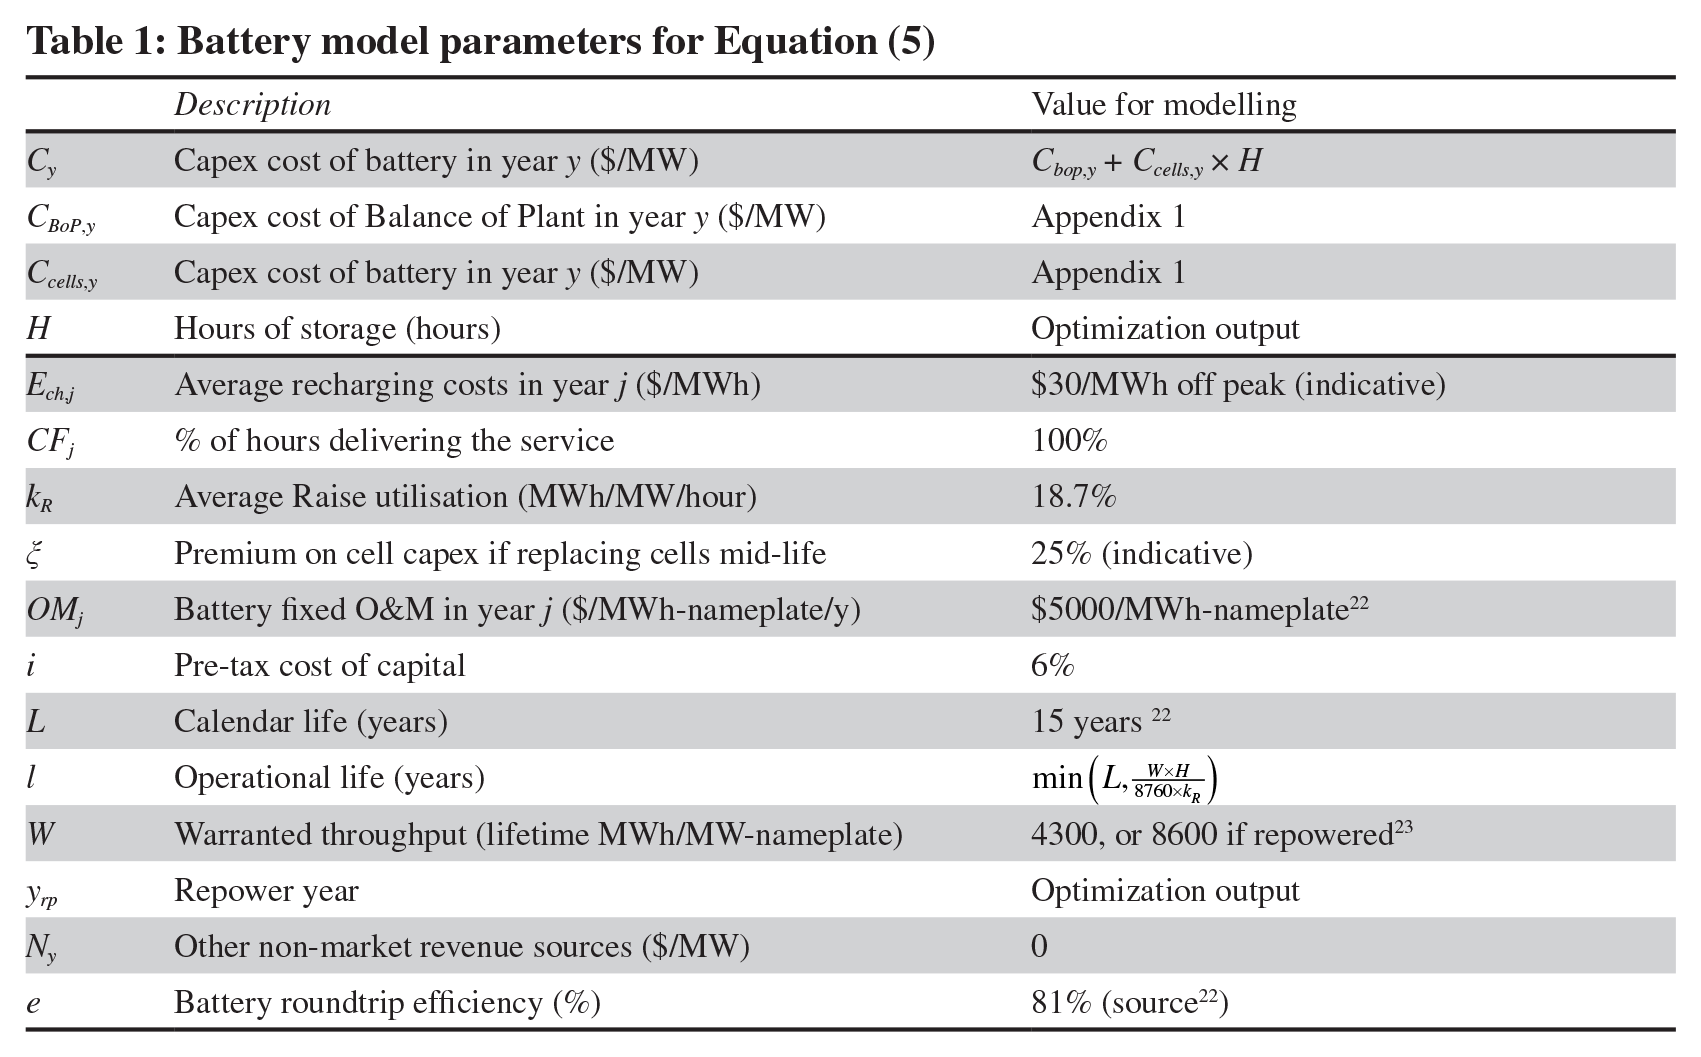
To quantify these two terms, we build on the work of Psarros, Karamanou, and Papathanassiou (2018) and derive the LCoFCAS for the simultaneous provision of both raise and lower Regulation, with symmetrical enablement in both services 19 . Analogous to the LCoE (Section 2), the lifetime provision of Regulation services is the discounted MWh of Regulation provided over the asset life. We can express the LCoFCAS as follows in Equation (5) (see also Table 1 below), where all units are relative to a MW of nameplate storage capacity:
Battery model parameters for Equation (5)
The first term of the numerator is the capex of a battery built in year y, parameterised as
The second term allows for a repowering (replacement) of the cells in year yrp (at a premium
The third term is the discounted sum of annual operations and maintenance (O&M) costs plus additional energy required to maintain the state of charge of the battery. Charging costs during FCAS Regulation lower duties are assumed to be offset by revenues from FCAS Regulation raise duties. However, the roundtrip battery efficiency losses as well as current frequency bias in the NEM lead to stored energy being exhausted over time without being replenished through the natural provision of lower duties. Therefore, some off-peak charging needs to be included. This is assumed to be in off-peak (i.e. high VRE) times 20 at $30/MWh (noting any results will not be sensitive to this assumption). To allow for this recharging, portfolios of FCAS Regulation providers would need to allow for approximately two hours of reduced lower but increased raise duties. Given the former will likely be readily available from an excess of market sources (e.g., curtailment of wind, solar) this is not considered further in the LCoFCAS analysis.
The fourth term explicitly allows for revenue from other sources, such as network support payments, that could be delivered in parallel with the FCAS services. For a utility scale battery, we assume Ny=0. In real-time, a battery would likely switch between energy and FCAS markets to maximise revenues, but this does not change the cost of maintaining a dedicated, baseload FCAS provider (and hence flat price that would on its own drive a new entrant).
The denominator is the (discounted) service provision over the life of the battery. The sum is over the operational lifetime of the cell is
Note that H, the hours of storage, appears in both the numerator and denominator. Greater hours mean a higher capex but allows for a longer effective battery lifetime 21 and hence potentially a longer capex recovery period for the BoP. The optimal hours of storage for given inputs can be determined through an iterative optimisation to minimise.LCoFCASREG,y.
Current battery capex costs in Australia are around $1100/kW for a two-hour battery (the typical sizing for recent NEM batteries) and $850/kW for a one-hour battery (suitable for FCAS Reserve duties). Using these values for Cy in Equation (5) and the other assumptions in Table 1, the provision of FCAS Regulation would cost approximately $30/MW/hr, and $10/MW/hr for FCAS Reserve. Note that this is for the simultaneous provision of both raise and lower duties.
3.3 The normative value of FCAS from VRE
We do not typically observe VRE plant undertaking FCAS duties. However, there is no technical reason as to why they could not do so. Modern wind and solar farms are flexible 24 and could physically deliver both FCAS Reserves and FCAS Regulation if resources are available but not delivered to the energy market. That is, for a raise response, there must be i) wind or solar resource available and ii) output deliberately curtailed to some lower production setpoint. This is analogous to the discussion of short-run pricing of Reserves from coal generators in Section 3.1 but with low or sub-zero marginal running costs. For example, a renewable generator with a run-of-plant Power Purchase Agreement (PPA) will lose its PPA strike price for each avoided MWh of output and so seek to run at negative prices. Similarly, out-of-market green certificates to meet a jurisdiction’s Renewable Portfolio Standard could drive the effective marginal running cost negative. This will typically increase the cost of Raise reserves by increasing the opportunity cost of any capacity withheld.
With this in mind, Reserves from VRE plant are likely to be more expensive than existing thermal plant provided the energy price is above a unit’s marginal running cost MC. Equation (3) shows that the cost of reserves decreases with increasing MC (i.e. a unit with zero marginal cost gives up the full energy value, while a coal unit with

This approach simply sets a benchmark long-term price if reserves must be sourced from VRE projects. The volume of FCAS reserves offered will vary with the underlying resource, meaning future reserve markets might ultimately have periods of under- and over-supply just as in the energy market. Equation (1)-(6) would therefore apply in the short-run. An analogous approach to lower reserves also applies:

Typical long run projections of the future LCoE of wind and solar are $45–60/MWh and $35–50/MWh respectively. Assuming no marginal running costs and k~20%, the LCoFCAS Regulation raise duties provided by these projects would commence $24+/MW/h for VRE as the solid line series in Figure 7 illustrates (with VRE LCoE measured on the x-axis, and LCoFCAS Regulation presented on the y-axis). Lower reserves from VRE would of course be available at a lower opportunity cost (from $6+/MW/h), reflecting the average amount of lost revenue from being turned down. Again, this is illustrated in Figure 7 (dashed line series).
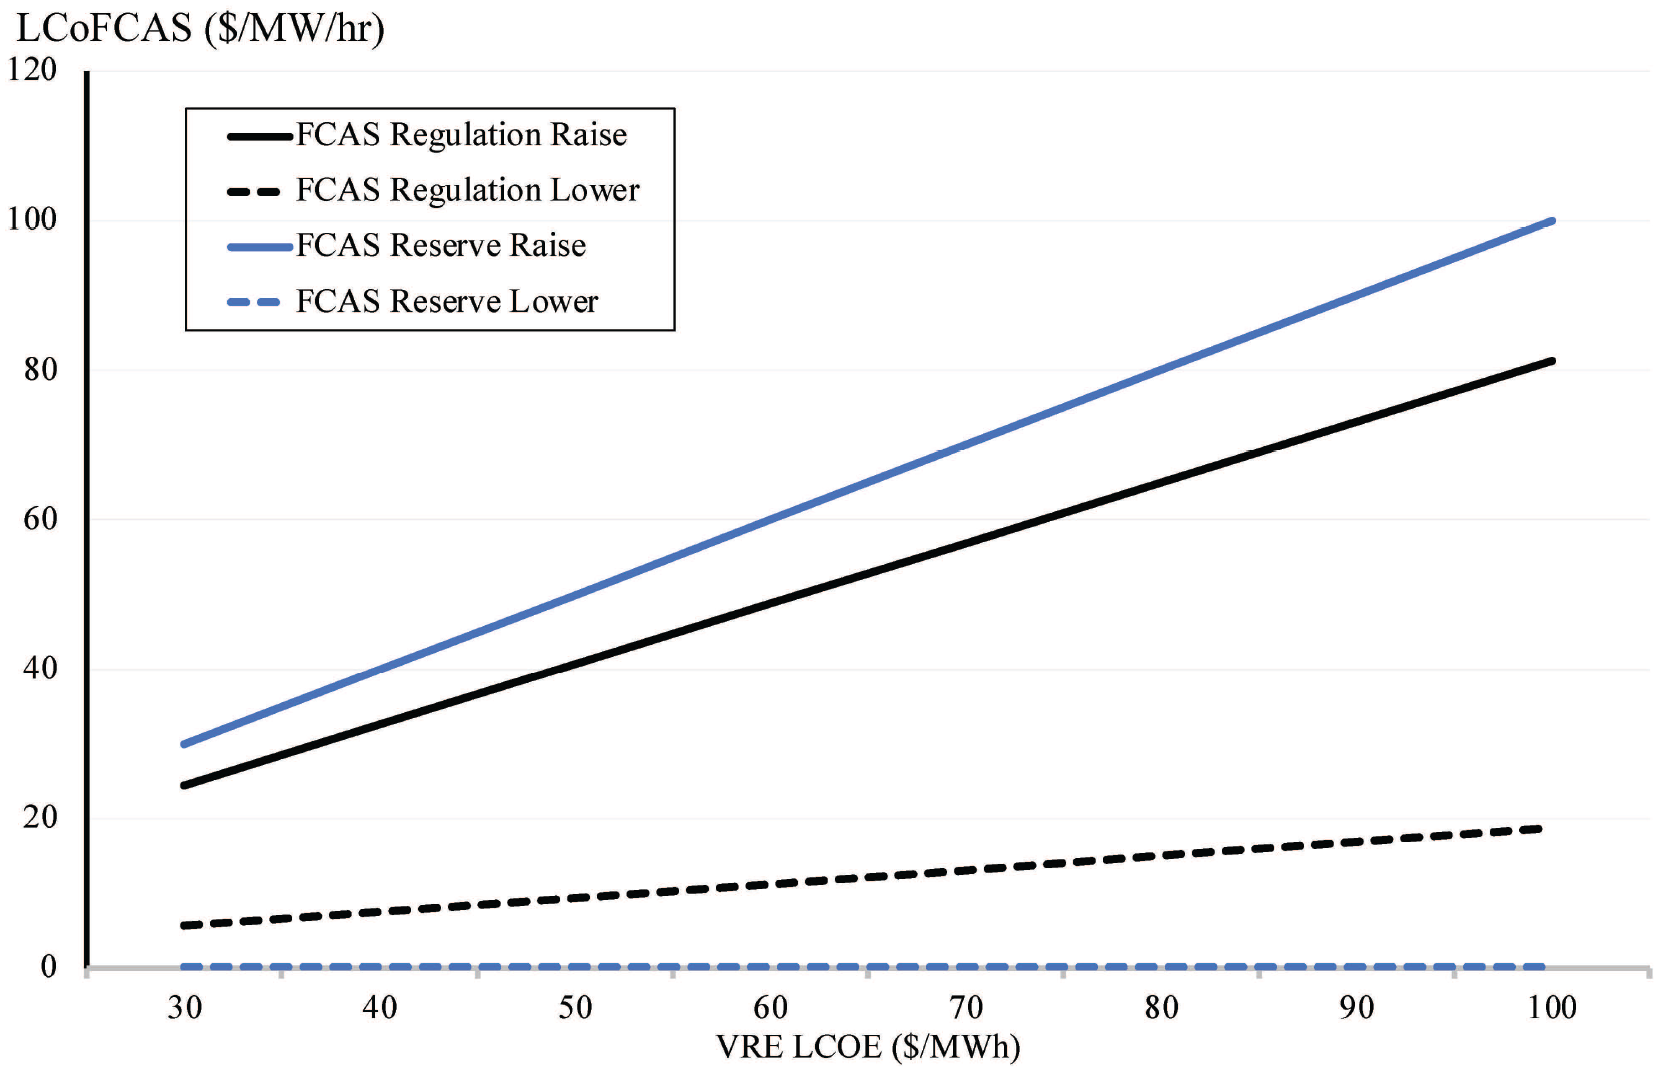
LCoFCAS from VRE
For FCAS Reserves Raise duties, kR ≈ 0 (low utilisation) and again assuming no marginal running cost the
3.4 Comparison of FCAS Regulation duties
Figure 8 summarises the previous analysis of FCAS Regulation by focusing on Raise duties (which we find are more challenging to deliver). The bars show indicative LCoFCAS ranges from batteries via Equation (5), and from wind and solar via Equation (6). As a benchmark, we also plot the indicative short-run cost range of provision from existing coal units for wholesale prices of $50–80/MWh (and assuming coal costs at current levels).
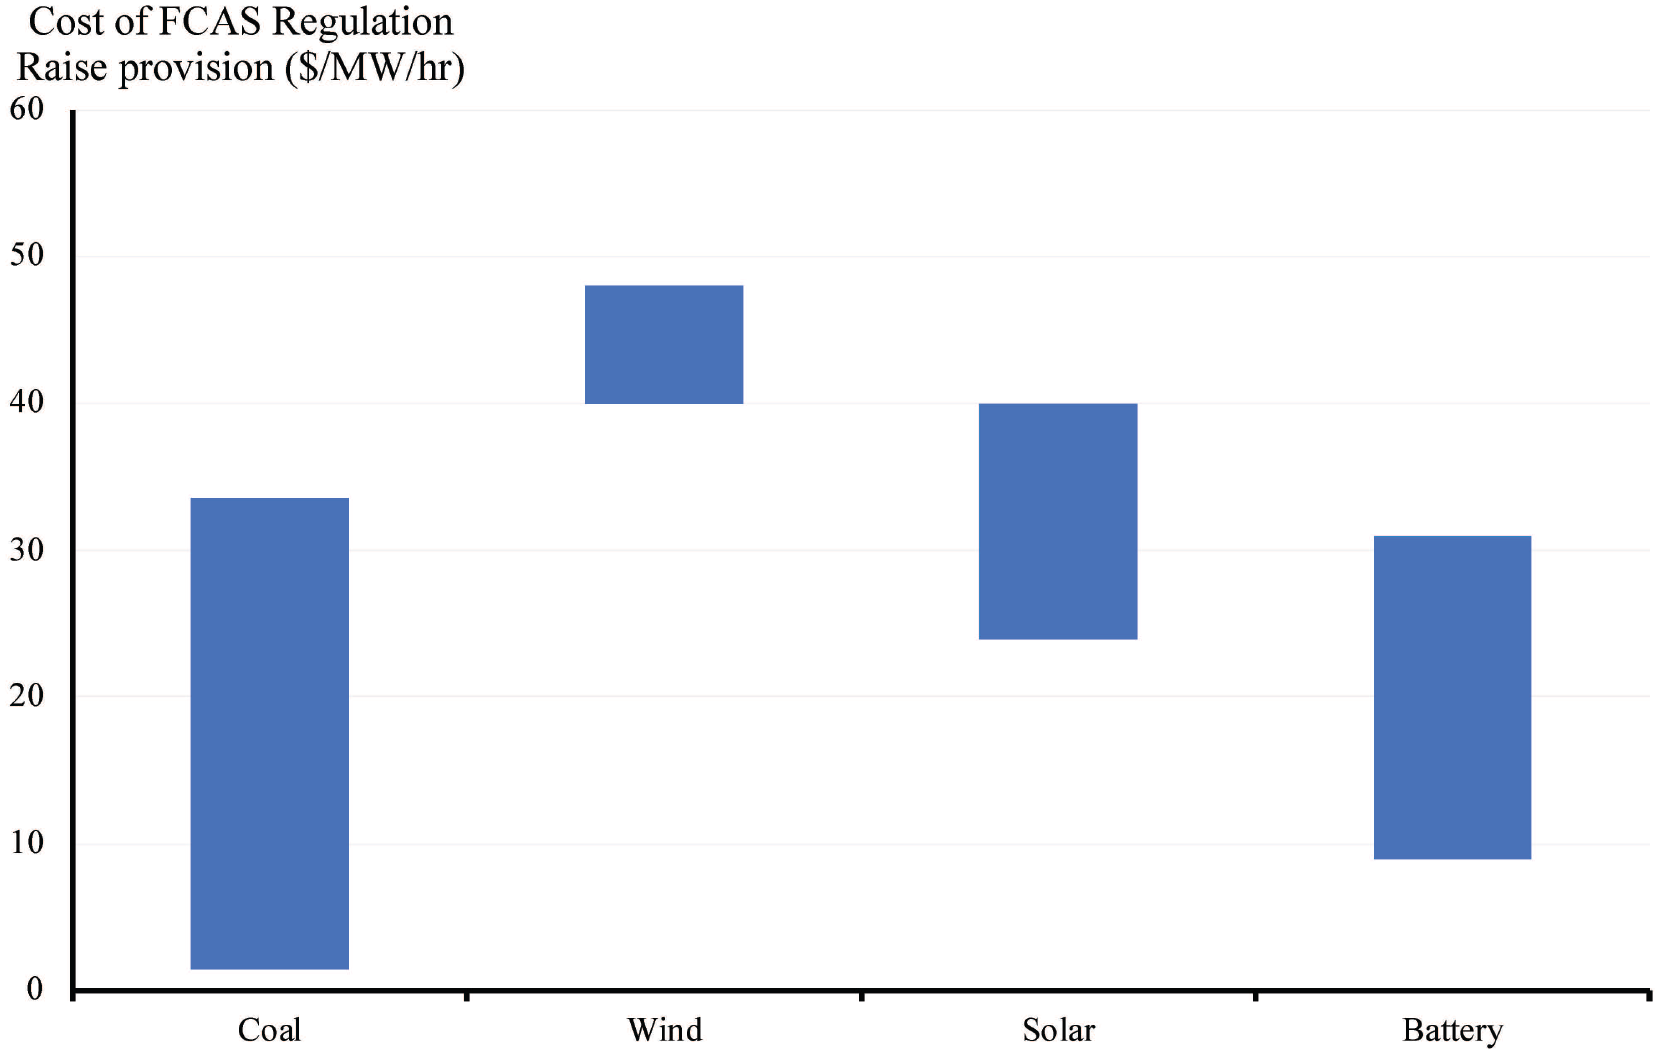
Comparison of projected costs of FCAS Regulation Raise duties
Given the comparative results in Figure 8, we will dispense with any further analysis of solar and wind vis-à-vis baseload FCAS duties. Our analysis from here on will focus specifically on provision from coal and batteries, and the change in observed FCAS prices over time.
4. FCAS Regulation Costs Prices vs Theoretical Benchmarks
Having established the theoretical framework for providing the cost FCAS duties, we now consider their applicability to the NEM given the rapidly changing plant stock, and the likelihood that prices will reflect opportunity values of reserved capacity.
4.1 Coal plant FCAS Regulation duties vs observed market prices
Figure 9 shows historical 2020 FCAS Regulation prices for the NSW region of the NEM for trading intervals where black coal is setting FCAS prices, versus the corresponding energy price in that interval. This analysis is based on “price setter” data published by the Market Operator for each five-minute dispatch interval.
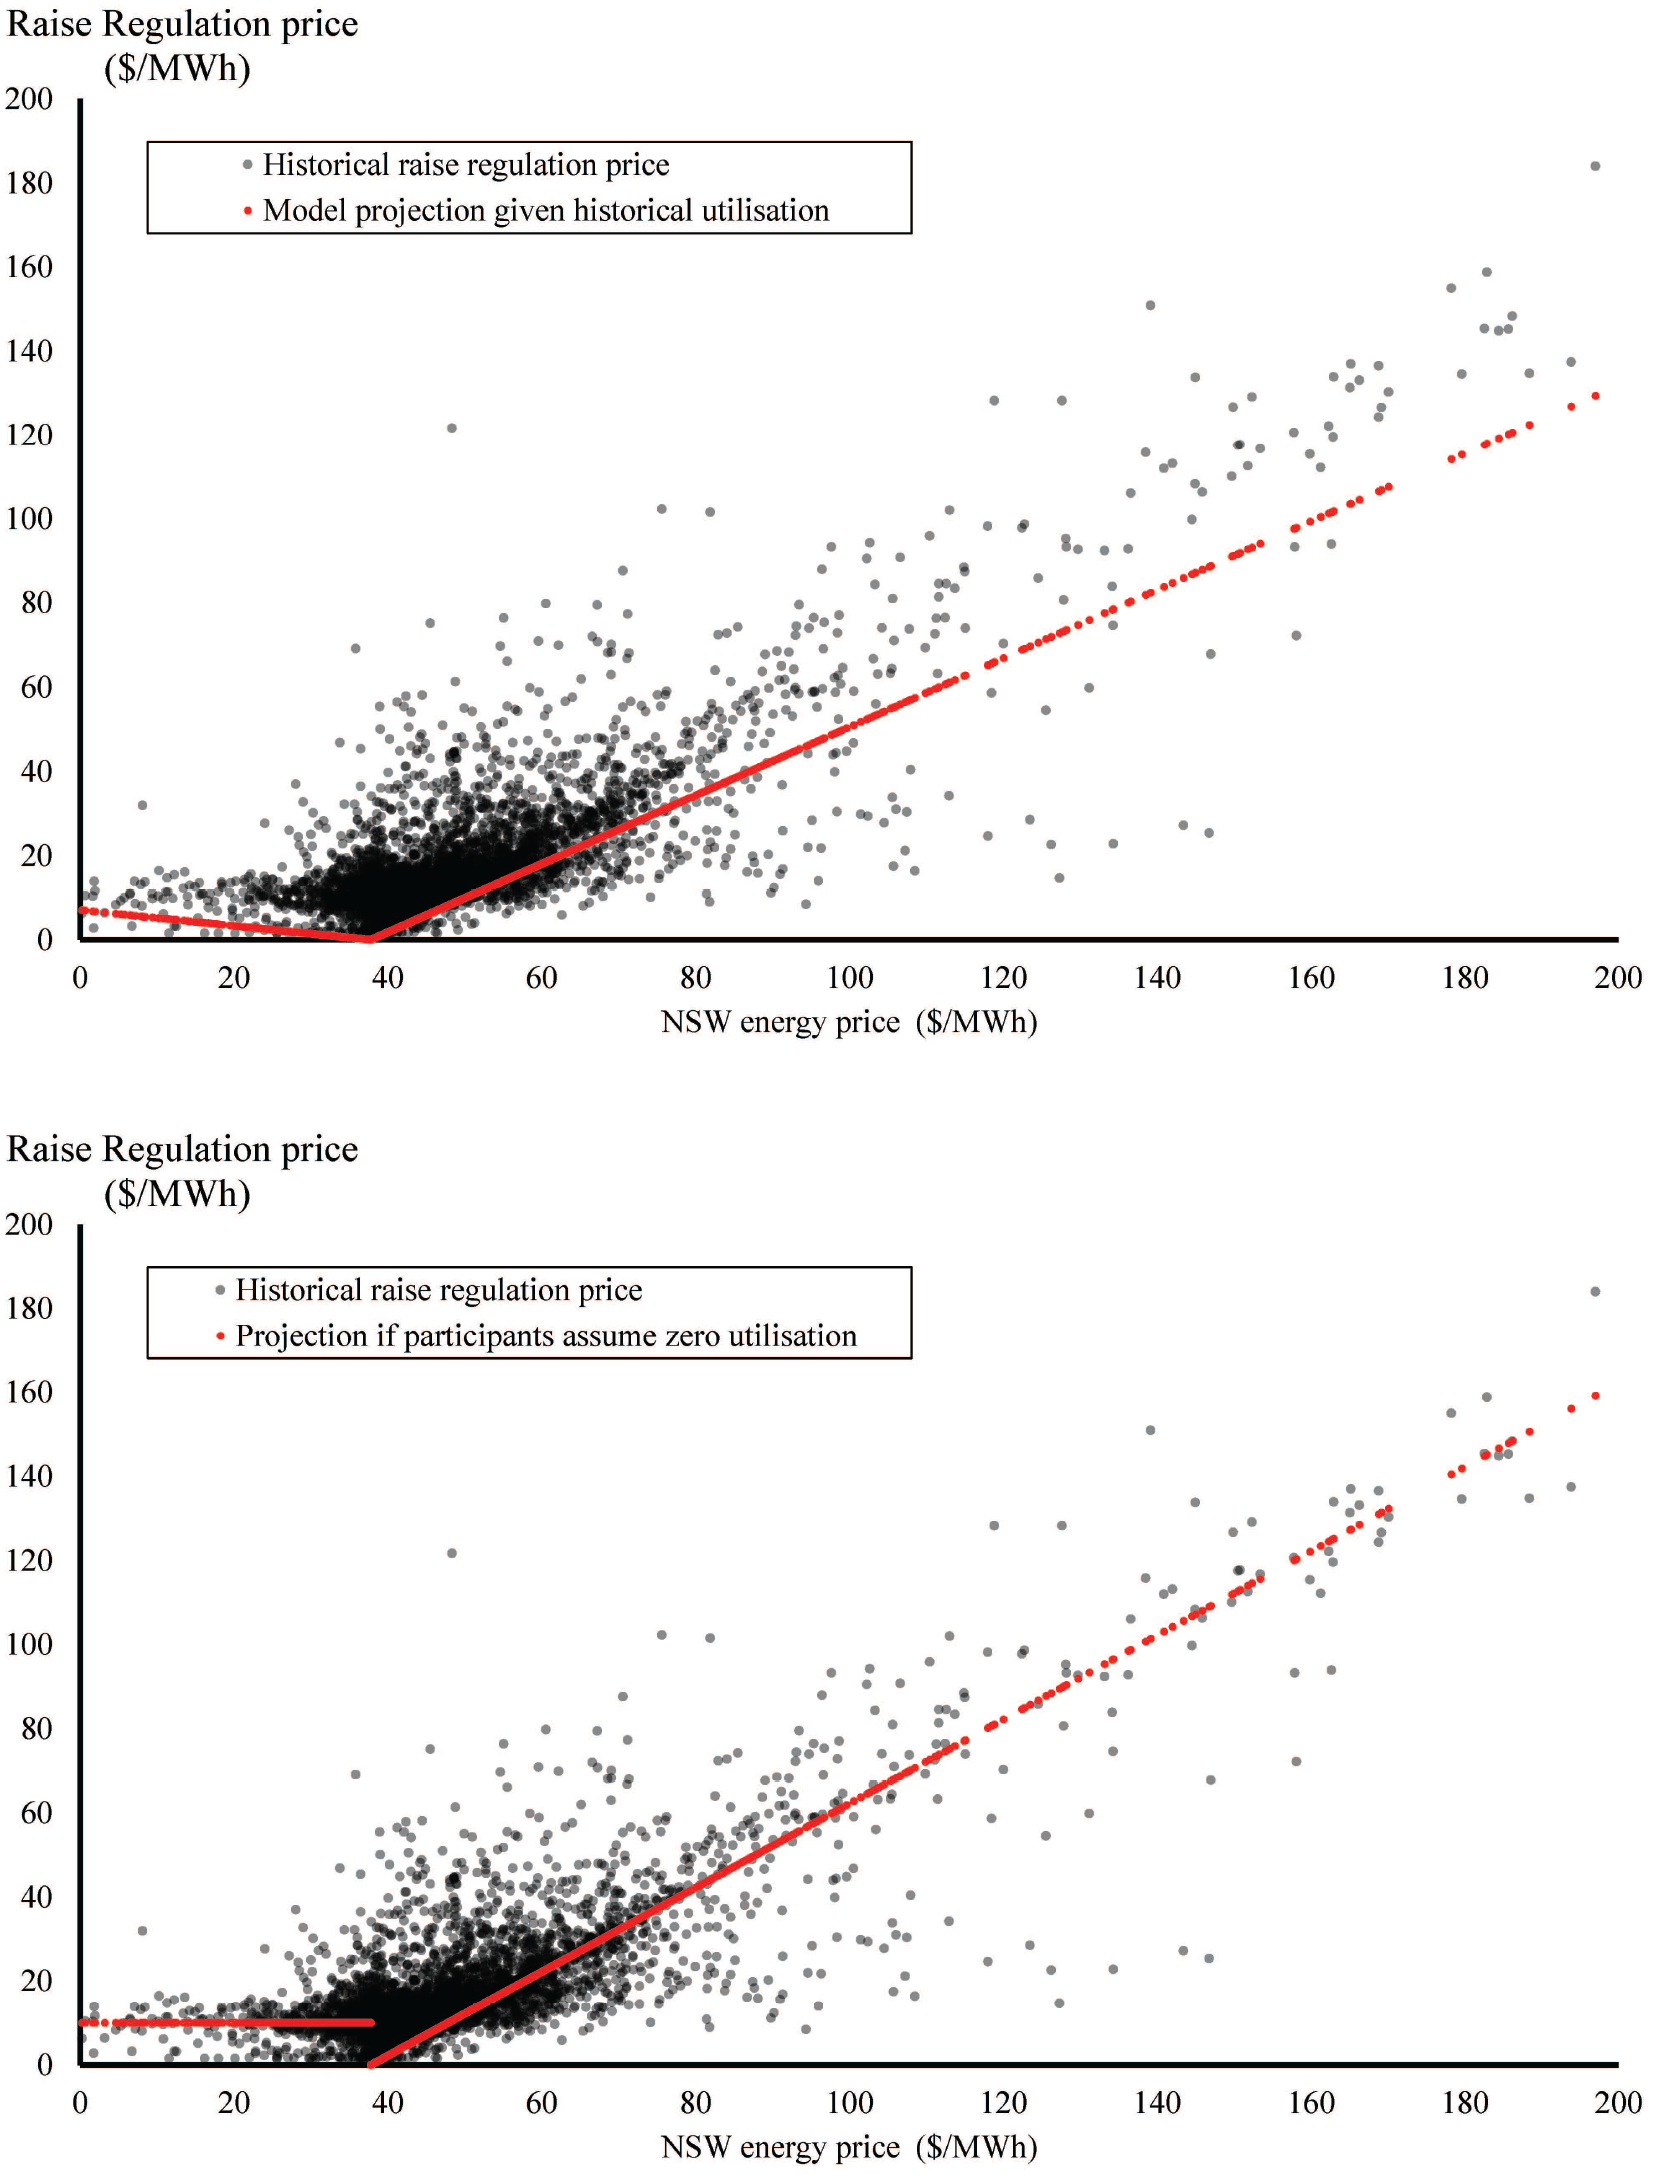
Historical FCAS Regulation Raise prices versus theoretical model
Our red-line forecast is the theoretical prediction based on Equation (3) and values in Table 1, assuming fuel costs of 90% of the annual average Newcastle coal export price 25 and plant heat rates of 10,000 kJ/MWh. We see a strong qualitative, but imperfect quantitative, fit to the data. Our second chart in Figure 9 demonstrates a better fit by assuming k = 0 (i.e. offers assume no Regulation utilisation) and a common floor price offer of $10/MWh. We interpret this as conservative FCAS offer pricing strategy by generators, such that they are not “out of pocket” if there is low Regulation utilisation. Some periods may also be due to the way the NEM dispatch engine trades-off offers between energy and Reserve markets, such that differences in offers (without any consideration of utilisation) drives prices. 26 The spread of outcomes may reflect the spread of plant marginal running costs. Points to the left (right) of the red line have lower (higher) marginal costs, and the spread (±$20/MWh) is reasonable given the diversity in plant characteristics and contracting strategies.
4.2 Provision of FCAS Regulation duties from batteries
When we combine the variables set out in Table 1 and Equation (5) with a forecast of battery costs (with battery cell costs projected to fall by ~50% by 2030, per Appendix I 27 ), a forecast for the LCoFCAS Regulation (i.e. both Raise and Lower duties) can be derived. This is shown in Figure 10 as the line series, commencing from 2022 through to 2035 on the x-axis. This cost estimate is for continuous provision of FCAS Regulation, both raise and lower duties 28 . Historic FCAS Regulation prices have also been included in Figure 10 as the bar series and span the period 2003–2021. The step-up in FCAS Regulation prices following the disorderly exit of coal plant is very apparent, from 2016 onwards. Bars are stacked, noting many resources (especially batteries) provide Raise and Lower services simultaneously.
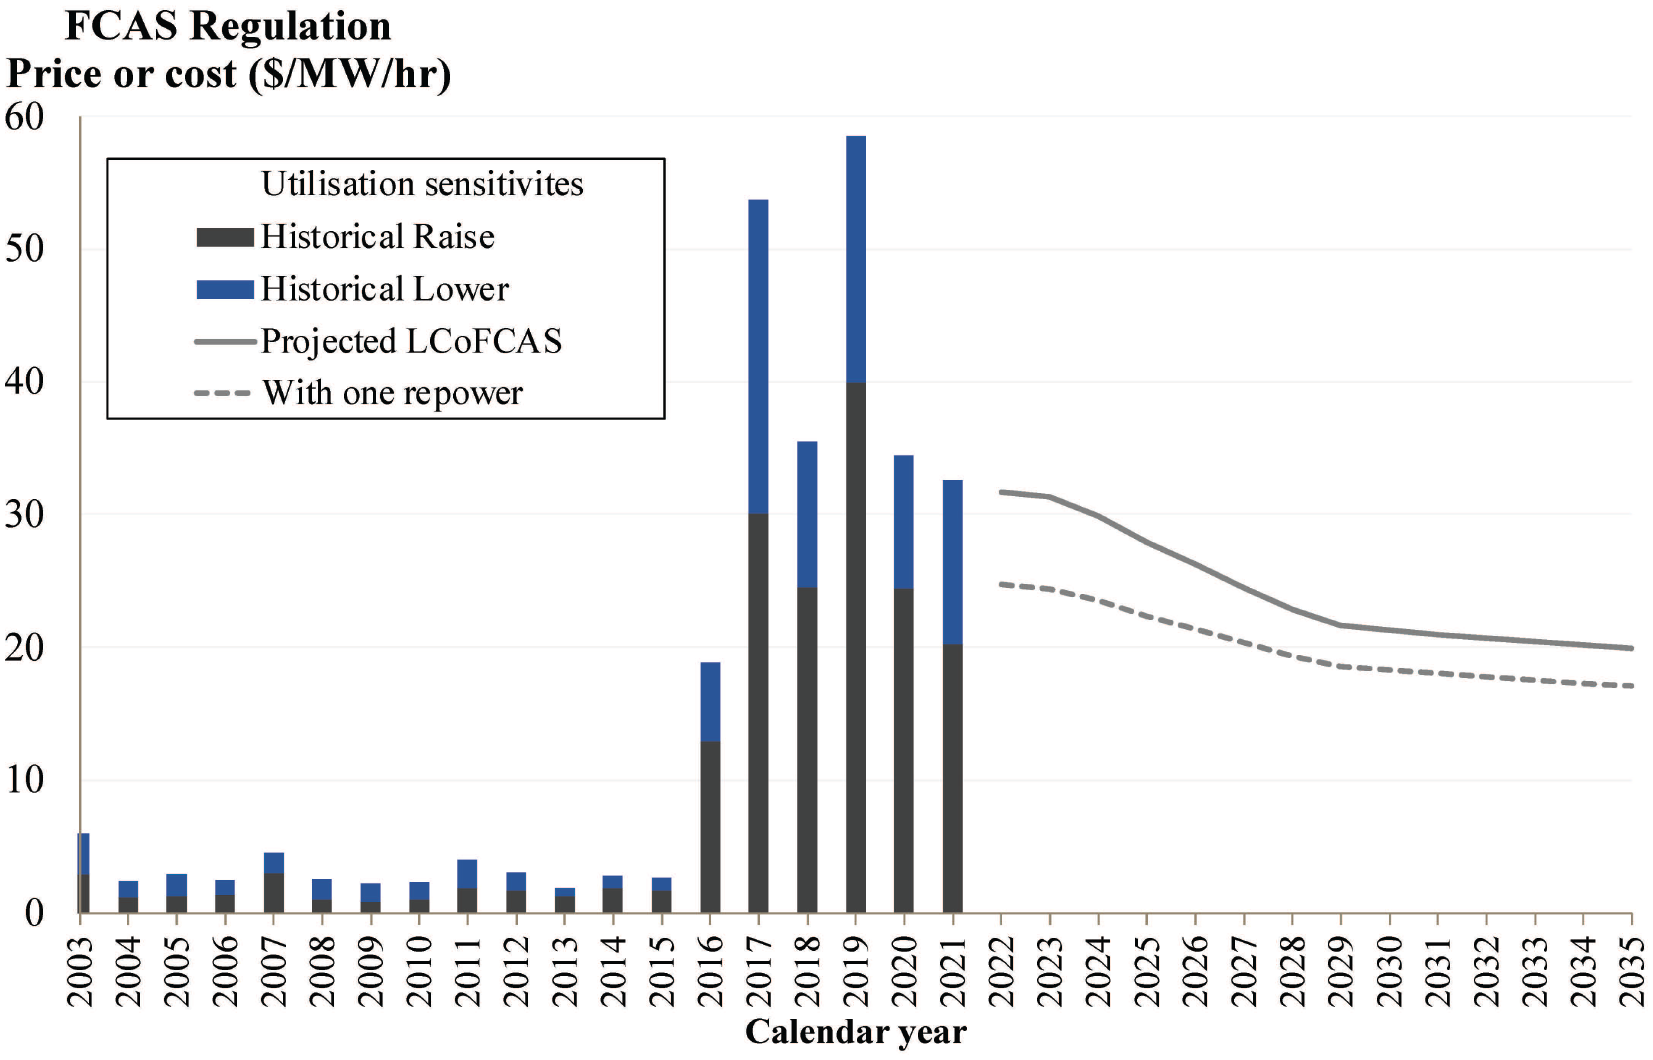
Projected LCoFCAS Regulation from grid-scale batteries
In our LCoFCAS Regulation forecast (i.e. Figure 10, line series), the optimal sizing of a battery was determined for each year in order to minimise costs using a simple exhaustive search varying H from 1.0 to 8.0 in steps of 0.05 hours, which yielded a local minima. Based on today’s costs, baseload FCAS Regulation can be delivered from a battery for ~$30/MW/h, falling to ~$20/MW/h by 2030 if cost reductions eventuate (i.e. based on one forecast of future costs). Appendix 1 considers potential cost sensitivities but the consensus view is a decrease in costs (and therefore so too will the LCoFCAS).
Our view is that LCoFCAS can be further reduced if cells are replaced (allowing longer-life balance of plant (BoP) to be reused). This is captured as the ‘Repowering’ dotted line series in Figure 10. The LCoFCAS is also sensitive to the utilisation of FCAS Regulation. While historically this has remained in a tight band ~20% (Figure 5) despite significant structural and market shifts over that period, higher shares of VRE could drive higher utilisation while lower forecasting errors or changes to load behaviour could reduce utilisation. Without seeking to undertake detailed modelling of future utilisation, we consider sensitivities of kR = 15% and 25%, shown as the shaded area in Figure 10. The ability to quickly run intuitive sensitivities around key inputs and their potential impact on future system costs (and, ultimately, revenues as Section 6 explores) is part of the value of levelised cost approaches.
Recent (bundled) time-weighted FCAS Regulation prices have settled at an average of $32–59/MW/hour. This is consistent with near-term projections of the cost of provision from batteries in the NEM. If battery costs continue to fall and wholesale prices converge to underlying costs, the existing FCAS Regulation prices can be expected to reduce substantially. Even without other sources of revenue, a new battery could deliver FCAS at a lower price. To be clear, annual prices could be higher or lower in any given year. If batteries deliver other services simultaneously, this does not change the underlying LCoFCAS, but might impact the opportunity cost and hence short run pricing determined by Equations (3)–(6). We explore this further in Section 6.
The average storage capacity of deployed NEM batteries is currently ~1.4 hours with most new entrants now opting for 2 hours of storage, perhaps reflecting the higher arbitrage value (per MW-installed) of short-duration storage. This aligns with purely technical studies that have focussed on revenues ($/kW) from price-taking resources in the energy arbitrage market, which favour short duration storage (Engels, Claessens, and Deconinck, 2019; Gilmore et al., 2015) However, our analysis tends to suggest that batteries will benefit from higher hours (i.e. ~3–4 hours) of storage, allowing FCAS Regulation be delivered at a lower levelized cost (noting FCAS markets currently provide the majority of battery revenue). This can be understood by recognising that dedicated FCAS Regulation providers would currently deliver, on average, 4.45 MWh/MW/day of raise response—therefore the warranted daily cycle will need to be close to this average result. Alternatively, more frequent cell replacement could be undertaken as cycles are exhausted. 29
5. Provision of FCAS Reserve Duties From Batteries
To first approximation, the expected average utilisation
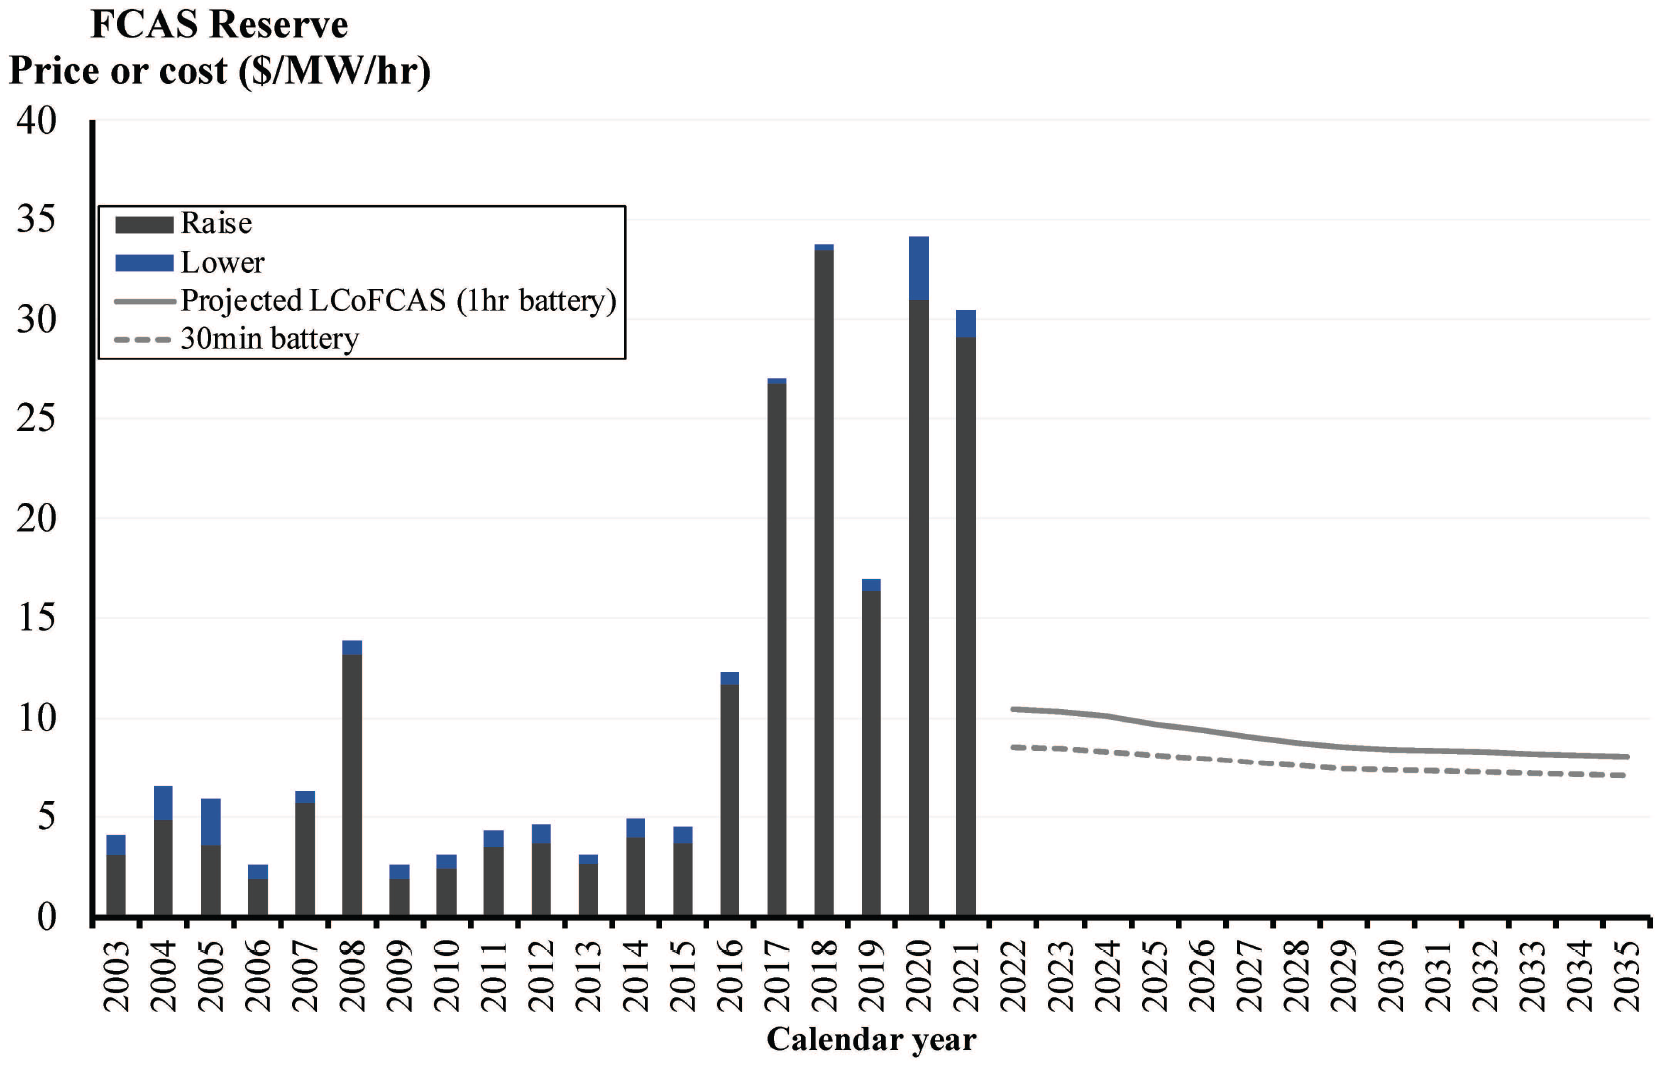
Projected LCoFCAS Reserves from grid-scale batteries
As noted in Figure 11 our projected
We believe utility-scale battery investors in the NEM should anticipate significant reductions in earned FCAS Reserve prices relative to current levels. Indeed if current prices persisted, a dedicated, short-duration battery could comfortably be financed on FCAS Reserve revenues alone. Recall that any plant undertaking FCAS Reserve duties must also withdraw its capacity from active duty in all other markets, including the spot market for electricity and FCAS Regulation.
6. Moving From LCOFCAS Metrics to Stochastic Price Forecasts
The LCoFCAS calculations in this article can be thought of as a form of average price cap for each service over the typical electricity market business cycle. If prices in any service remained consistently above that level, batteries are a fungible new entrant that would be revenue adequate in that single market alone. To be clear, there is no guarantee that the achieved revenues of a battery will be equal to the LCoFCAS. Supply-side participants in electricity markets are known to face long periods of imbalances through over- or under-capacity. In addition, secondary markets can distort prices from theoretical predictions, and the lack of perfect foresight vis-à-vis technology costs can create opportunities for excess or suboptimal revenues. Any of these conditions will produce prices which deviate from theoretical optimums. Above all, spot prices can be quite volatile in energy-only markets with revenues dependent on brief periods of high prices, as Figure 12 shows of historical FCAS Reserve prices in the NEM. On average, the highest 5% of periods each year provide 21% of revenue for a baseload provider (9% in the top 1% of periods).
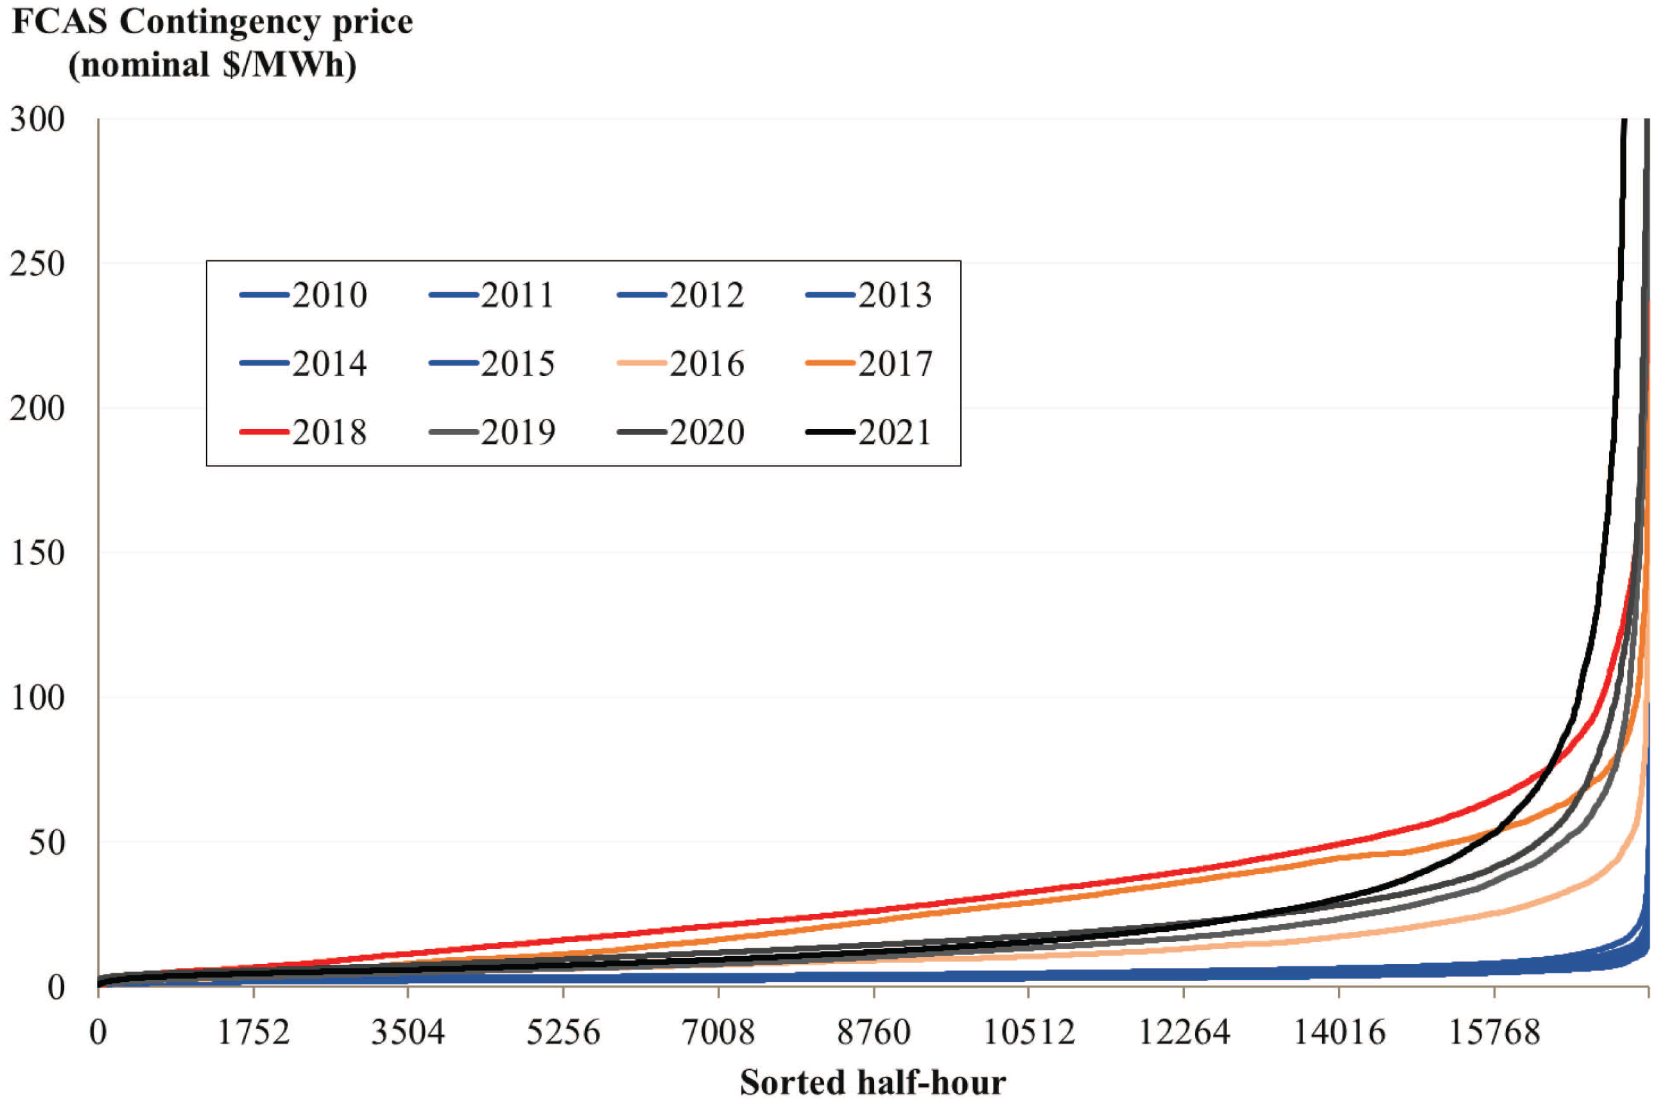
FCAS Price Duration Curves (2010 to 2021)
However, if batteries increasingly form the benchmark entrant technology, the LCoFCAS can provide a ‘centre of gravity’ for long-term pricing just as the cost of carrying a gas turbine has provided the long run equilibrium price of the NEM’s $300 Cap derivative (i.e. a one-way CfD) (see Simshauser, 2020).
The Market Operator has projected utility-scale generation and storage capacity would need to grow to 170,000 MW by 2050, with ~45,000 MW of storage requirements across the NEM over the next 2–3 decades to manage the variability of VRE. Ongoing opportunities to re-adjust the capacity mix are therefore likely noting that an installed battery will deliver multiple services in any given year. However, each major market (viz. energy, regulation, reserve) cannot be served simultaneously—all plant must choose their operating duty. 32
Real-time FCAS offer prices will be determined by Equation 3–6 based on the portfolio of projects available, the opportunity cost in the co-optimised energy market (and other FCAS markets), and the supply-demand balance for reserves and energy. As one Reviewer noted, the opportunity cost for a battery depends on both the cost of charging and the cost of not selling energy. Such opportunity costs could be obtained from linear program simulations, but further work on an analytic framework for modelling spot pricing from batteries would be valuable.
6.1 Simulating stochastic FCAS prices
In Simshauser (2020), the valuation of peaking gas turbine plant was undertaken through random sampling of 100 years of stochastic spot electricity price traces. This sampling process was undertaken to populate a 25-year valuation model, which was then iterated 500 times to create a valuation distribution for peaking plant investment purposes. The first 2–3 years of prices were aligned to available forward prices but thereafter were manifestly random having been drawn from the stochastic price traces. This process recognised that active peaking duties in any given year are intrinsically stochastic. That is, peaking plant operate only during power system imbalances—extreme weather events, material plant outages or market power events. And because such events are inherently uncertain, peaking plant income streams from spot markets are manifestly random and particularly hazardous—and as such randomly sampled stochastic price forecasts are ideal for populating valuation models.
As with peak spot prices, FCAS price volatility on all timescales is likely with prices trending towards underlying costs over the business cycle. Accordingly, we have adopted a parallel analysis for FCAS Reserve pricing and asset valuations. Figure 13 shows the result of 2,000 stochastic simulations of annual FCAS Reserves prices in 2030, based on random sampling of historic monthly FCAS Contingency prices over a 10-year period (2011 to 2021). To include the potential for changing dynamics over time, 12 months of zero priced FCAS outcomes were also available for sampling so as to capture risks of a heavily oversupplied FCAS market.
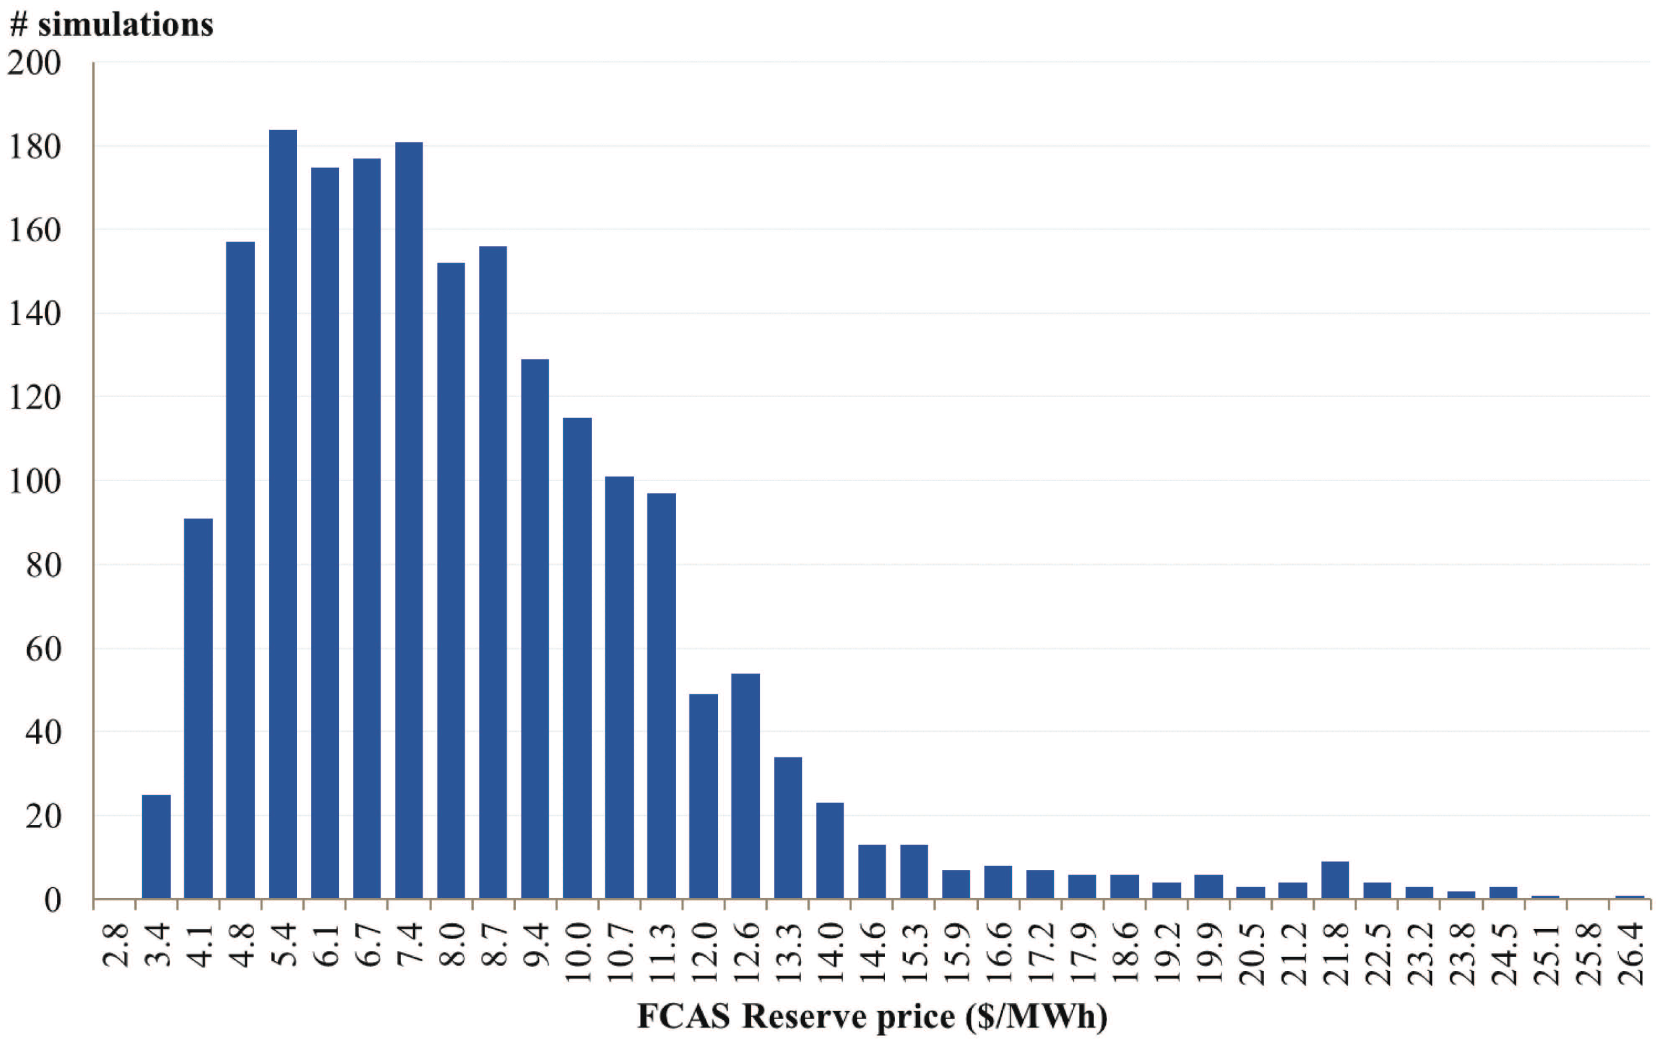
Spread of average annual FCAS Reserve price across simulations of 2030
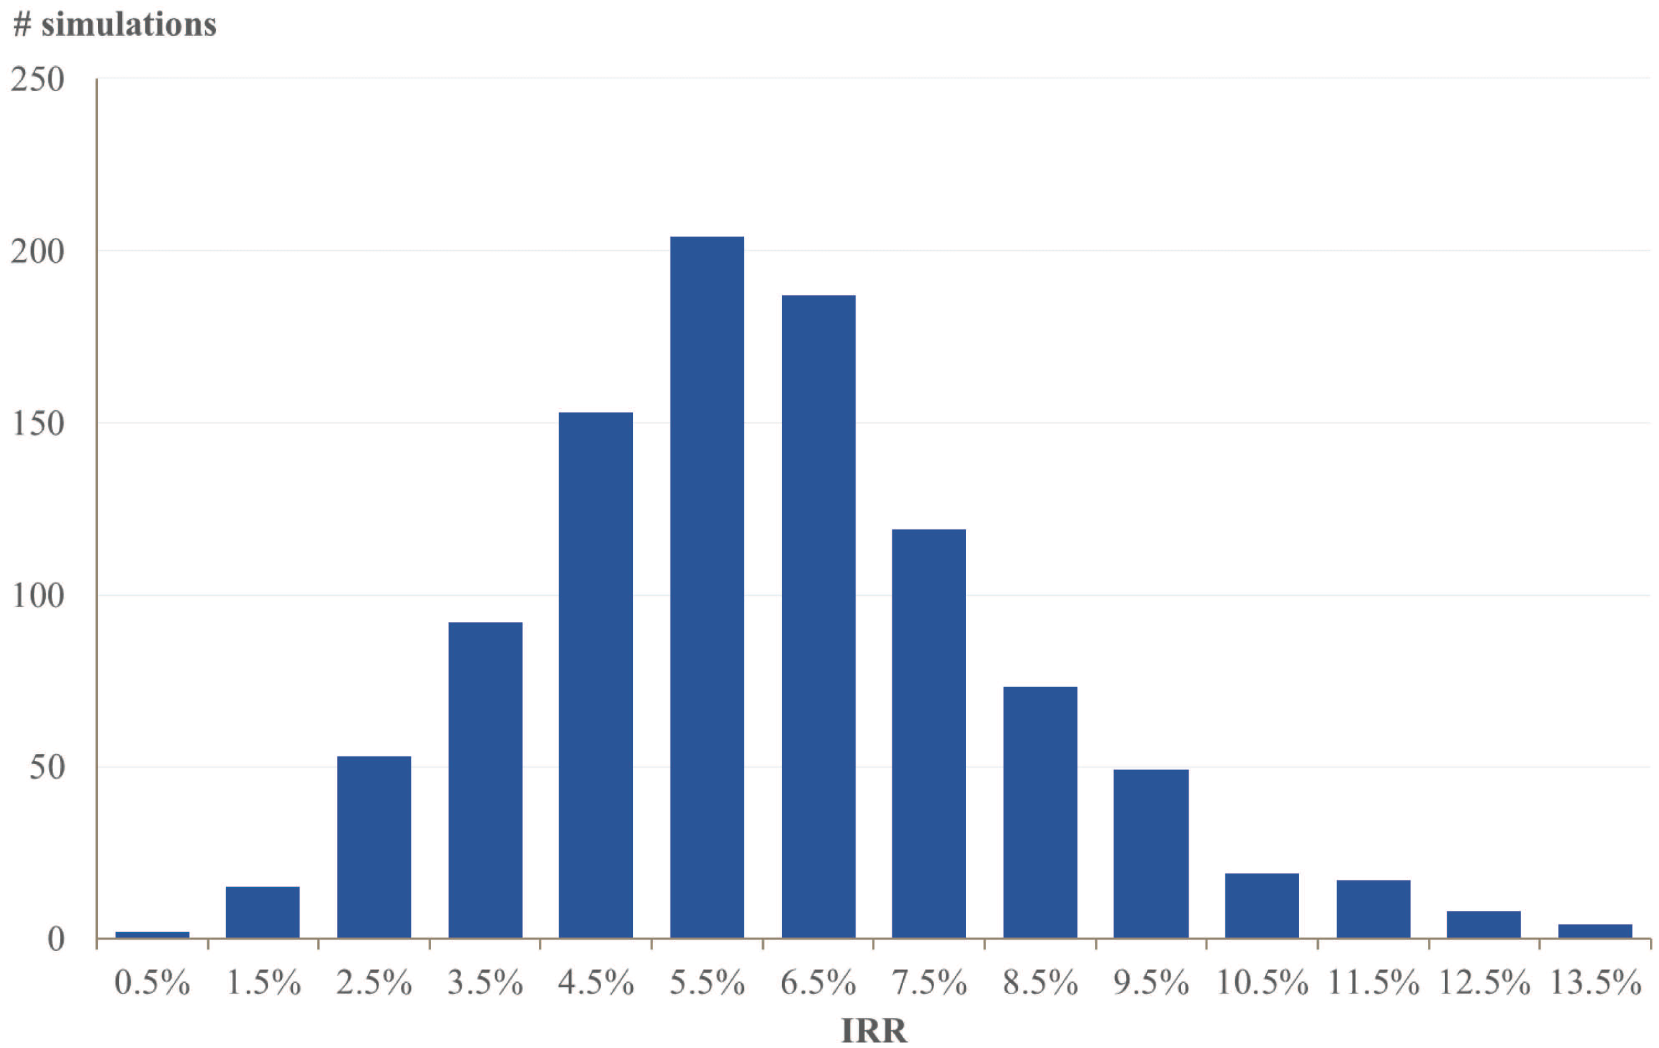
Spread of IRR outcomes for simulated battery
As with Simshauser (2020), an iterative approach was undertaken to bias samples towards low or high price months to achieve an overall expected average price of $8.40/MWh across the stochastic data set (i.e. within the model tolerance of the LCoFCAS Reserves in 2030). This forms the same revenue conditions that long-term structural models used to forecast electricity spot prices (i.e. linear programming models based on the principles of Boiteux, Berrie and Booth) would rely upon to reach equilibrium, viz. where average revenues equal new entrant costs of the relevant new entrant benchmark technology as supply-demand imbalances are exhausted.
In the simulation outlined in Figure 13, FCAS prices are volatile across years with median and 90th percentile prices at $7.73 and $3.70 respectively. Labels are bin means. A financial model randomly selecting from this dataset will produce credible scenarios where projects may or may not recover costs—as is the case with all merchant investments from time to time. To be clear, the specific distribution of future scenarios will and should be different, with extended periods of high or low prices possible. It is also possible that future dynamics are qualitatively different, e.g., with only very high or very low prices—these scenarios are at least considered in the distribution above. Multiple simulations can then be drawn upon to create a sensible median scenario (e.g. 500 simulations using stochastic price forecasts with the mean result providing the valuation within certain confidence limits).
On this basis, simulating a 15-year battery committed to delivering FCAS Contingency and assuming no further reductions in LCoFCAS post 2030 will produce an IRR range of 0%–14%, noting a real-world battery can diversify and capture other revenue sources (e.g., if the energy market happened to be otherwise short capacity). What such modelling methods do achieve is to ensure the risk appetite of investors is tested noting the distribution of outcomes involve suboptimal years. Simulation model results can be further refined by guiding early year outcomes (e.g. by nominating year 1–2 revenues through alignment with forward prices or a fixed term contract—see Simshauser (2020) for an analogous approach vis-à-vis gas turbine valuations).
7. Policy Implications and Concluding Remarks
There are a series of important implications arising from Sections 2–6, as follows:
The microeconomic reform of wholesale electricity markets that occurred throughout the 1990s dealt with a universal problem—oversupplied markets for each of energy and capacity (and in turn, the supply of FCAS). In an environment in which the entire plant stock was capable of supplying FCAS duties as a joint product of the electricity production process, FCAS markets were heavily oversupplied. Consequently, FCAS markets cleared at low prices i.e. $1.6 - $4/MW/h on average—with most of that value from brief periods of scarcity pricing (as Figure 12 illustrated). It is perhaps not surprising that literature on FCAS pricing prior to the past five years has been virtually non-existent (cf. literature on wholesale electricity prices and wholesale market design).
The disorderly exit of coal plant in Australia’s NEM, and the sharp rise in asynchronous VRE plant meant that the inherent supply of FCAS is falling while the demand for FCAS is simultaneously rising. These conditions have led to a market rebalancing, and in consequence, reserving capacity to undertake FCAS duties has suddenly shifted to non-zero marginal costs (i.e. there are now genuine opportunity costs associated with maintaining reserves), with prices subsequently surging to $23+/MW/h.
Policy makers should not allow the management of frequency to be subject to ‘a taking’ (i.e., mandatory provision of a service that was not required at time of investment decision) simply because resources are currently available and can be compelled to provide it. This has been the recent case in Australia, where a primary frequency response has been mandated from all resources (albeit without a headroom requirement). While frequency management is valuable, it is not costless. Ultimately, an unpriced service will lead to overconsumption, undersupply, or both. This has been observed recently in the Australian market where the lack of price signals for system strength and inertia has led to shortfalls that have threatened grid security. This is not a market failure per se, but clear examples of missing markets.
Conversely, as a consequence of point (2) above, it would seem FCAS duties undertaken by mid-merit coal plant are now setting prices well above the efficient level, with batteries able to respond to the FCAS markets at well below prevailing prices as Figures 10–11 tend to suggest.
A large number of potential battery entrants are responding to recent elevated prices. It is also possible under the circumstances that inefficient over-investment occurs, whereby the supply of batteries exceeds demand. This would of course depress future FCAS prices but strong growth in battery storage will be required to manage a 100% renewable energy grid. Consequently, such dynamics should drive FCAS prices back towards equilibrium over time. And even in oversupply, FCAS Regulation duties are not costless. Batteries developed have an opportunity cost—providing FCAS Regulation consumes cycles and reduces their lifetime. Short-run pricing from batteries will depend on both co-optimisation across all spot markets and expectations of the value of a warranted cycle across all timeframes.
Storage is highly flexible, and businesses cases will inevitably assume some level of “revenue stacking” (i.e. delivering multiple services) rather than simply providing a single energy or FCAS market. This could include switching between arbitrage, FCAS Regulation, FCAS Reserve, responding to new markets like Fast Frequency Response, or more localised services such as managing episodes of high volts, underwriting protection schemes to reduce network constraints, or providing system strength (through grid forming inverters). Investors will be aware of these various revenue sources, and prices in each market will ultimately reflect costs as supply is reconfigured.
Finally, we note that the price of reserving capacity for FCAS duties is becoming increasingly connected with spot electricity prices. Our view is that this will continue. As a consequence, total revenues will not simply be the sum of an arbitrage calculation, and a LCoFCAS calculation. Rather, the highest value period in each market will likely coincide, and any price forecasts will need to be determined simultaneously. Supply-side resources will optimise their participation across these increasingly connected markets.
A natural next step would be to convert the LCoFCAS into a revenue forecast for each service, and consider how a portfolio of resources will deliver the required services. This would need to consider multi-period optimization, the marginal cost of charging or discharging storage in a period, and the competing value of a warranted cycle in the various cooptimized markets (particularly if one or more markets is out of long-run equilibrium). More granular forecasts of FCAS prices can and should be benchmarked against LCoFCAS curves to ensure short-run assumptions are consistent with long-run costs.
Supplemental Material
sj-pdf-1-enj-10.5547_01956574.45.1.jgil – Supplemental material for The Levelised Cost of Frequency Control Ancillary Services in Australia’s National Electricity Market
Supplemental material, sj-pdf-1-enj-10.5547_01956574.45.1.jgil for The Levelised Cost of Frequency Control Ancillary Services in Australia’s National Electricity Market by Joel Gilmore, Tahlia Nolan and Paul Simshauser in The Energy Journal
Footnotes
Appendix I: Battery Cost Projections
We consider a future cost scenario broadly based on (Graham et al., 2020) whose work also underpins forecasts by the NEM market operator. We linearise the projected costs into a fixed Balance of Plant (BoP; including inverters, transmission connection, land, etc. Units of $/kW.) cost plus a component that scales with hours of storage ($/kWh). Costs for a two (four) hour battery decline from $1,100/kW ($1,700/kW) in 2021 to $700/kW ($960/kW) in 2035. Note that the projections assume only modest reductions in $/kW costs over time, with most cost reductions being for the cells. An additional $70/kW in connection costs was also applied.
However, future costs are highly uncertain. (Cole, Frazier, & Augustine, 2021) at NREL reviewed current utility-scale battery storage capital costs and projected high, mid, and low future cost scenarios. Graham et al. (2020) aligns with NREL’s mid point forecasts for a 4-hour battery (Figure 16), with high and low scenarios +/– 20%.
Figure 17 similarly compares 2-hour battery projections, where the forecasts in this paper are at the high end. NREL’s forecasts did not consider Australian specific conditions, but it is credible that future costs could be lower than projected in this paper. Indeed, (Mauler, 2021) analysed 53 studies that provide time or technology specific costs estimates for lithium-ion, solid-state, lithium-sulfar and lithium-air batteries out to 2050. While all forecasts projected continued cost reductions, the study applied a regression metric to compare expectations and to the empirical evidence available for the timeframe 2010 to 2020 and found that most forecasted values were above market observations. That is, at least historically, most forecasts have tended to underestimate the pace of cost reductions. Conversely, short-term supply chain constraints and high demand for batteries may result in costs above the long-term trend.
1.
Unless otherwise stated, all financials are expressed in Australian Dollars. At the time of writing, AUD/US = 0.73, AUD/£ = 0.53 and AUD/€ = 0.62.
2.
To be clear, while it is technically plausible for VRE generators to provide FCAS, it has thus far been most unusual for wind or solar plants to do so.
3.
Both metrics cited are for ‘raise’ duties.
4.
Frequency is the rate at which Alternating Current alternates. In the NEM, AC completes one cycle 50 times per second (50 Hertz). Other markets such as the USA operate at 60 Hertz.
5.
It is also signalled by Voltage but this article is focused on frequency.
6.
As note, low frequency events can lead to the overheating of generators.
7.
Different markets define contingency reserves differently depending on the type of installed capacity, the nature of events they are required to respond to and the timeframes over which they respond and how such services are activated (Riesz, Gilmore and MacGill, 2015). For example, ![]() note that in Ontario, contingency reserves (known as operating reserves) are organised into 10-minute synchronised, 10-minute non-synchronised, and 30-minute non-synchronised reserves.
note that in Ontario, contingency reserves (known as operating reserves) are organised into 10-minute synchronised, 10-minute non-synchronised, and 30-minute non-synchronised reserves.
8.
Soon to be ten, with the introduction of a 0.5–2 second Fast Frequency Response FCAS Reserves market in 2023, that was proposed and designed by the authors.
9.
Although the Market Operator does produce a continuously updating 40hr pre-dispatch forecast.
10.
That is, the 8 markets comprise both (1) raise, and (2) lower markets for each of the 4 services.
11.
The rotating mass of Queensland 350MW generators are 106t (i.e. High & Intermediate Pressure turbine 16t, Low Pressure turbine 50t and generator 40t). The rotating mass of the 500MW generators in Victoria and 660MW generators in New South Wales are 217.5t and 232.8t, respectively (Simshauser, 2017).
12.
In the NEM, non-price load-shedding or Under Frequency Load Shedding, a highly automated sub-second event, can generally be relied to arrest a ‘Rate of Change of Frequency’ (RoCoF) of up to 3.5Hz per second. In 2016, South Australia experienced a RoCoF of 6.25Hz per second which resulted generating units disconnecting and a system collapse.
13.
6-second & 60-second FCAS are usually operated by governor response or load shedding, and are triggered by frequency moving outside the normal operating band.
14.
14.The authors originated a NEM Rule Change proposing an additional FCAS market for Fast Frequency Response, viz. ½ second FCAS Reserves.
15.
Minus a small amount of load relief from synchronous loads.
16.
For an intuitive derivation, the LCOE definition can be written as
17.
Note that MC would typically be the observed marginal running cost of the generator (unit fuel costs, variable maintenance costs, etc.). For energy limited resource (i.e. battery, pumped-hydro) it will need to consider the opportunity cost of using storage for reserve or response. Marginal cost therefore needs to account for opportunity cost. We provide further discussion in Section 6.
18.
Note that the NEM’s real-time market means short-run reserve pricing reflects marginal costs, with any must-run costs effectively sunk; those costs must be recovered through prices set by more expensive generators, if possible, or through market power. Grids with organised forward markets may incorporate financial losses for a unit’s must-run component into reserve pricing, as described in Müsgens et al. (2012), resulting in slightly different formulations than presented in this paper. Hirth & Ziegenhagen (2015) derive a similar formula applying only to contingency (spinning) reserves, with minimum load losses pro-rated across the service.
19.
Batteries are well suited to offering both Raise and Lower services simultaneously (and symmetrically) around a setpoint of 0 MW, with Raise being provided by generating and Lower by charging. Modern software controlled batteries have sufficient flexibility to transition smoothly between generating and charging, meaning both services can be offered simultaneously. If batteries also operate in the energy market, the two service can be traded off. For example, a 50 MW battery could offer 100 MW of lower response when dispatched for 50 MW of generation. Due to the focus on “baseload” service provision, we have not considered this further.
20.
Specifically, when the opportunity cost of charging is low—this could be off-peak energy or high Raise value periods. If extra energy is available at $0/MWh (i.e., there is a regular surplus), LCoFCAS figures for Regulation could be ~5% lower. Off-peak energy is unlikely to be negative on average due to increased demand from flexible loads (including batteries) and declining renewable subsidies in the NEM.
21.
More hours of storage mean more energy is able to be dispatched per warranted cycle, leading to fewer cycles (for the same MW nameplate) being used in the delivery of FCAS
22.
Source: Graham et al (2021)
23.
Lithium-ion batteries are typically warranted for “1 cycle per day” (Graham et al (2021)), allowing for degradation in stored energy capacity over time. The figure in Table 2 is based on an average of one cycle per day with a 3% degradation in stored energy year on year, over 15 years. While batteries may last beyond their warranted cycles, this is not typically included in the initial business case.
24.
(Christiansen and Hillmann, 2017) suggests that wind ramp down rates are limited to 20% per second; this would still allow a wind farm to deliver the 6-second Lower Contingency FCAS service.
25.
The 90% net back calculation allows for transport costs from the mine to the export terminal.
26.
We would argue that participants could offer lower prices into the reserves market if sufficient additional competition existed. With this caveat, we expect this approach could be used to project future FCAS prices from various sources (with different values of ). This approach can also be adapted to changed market conditions, such as carbon constraints increasing the marginal running costs of coal generators which, counterintuitively, reduces the cost of reserves (units are more willing to withhold energy with higher marginal running costs).
27.
28.
One Reviewer queried whether excluding arbitrage duties from the denominator exaggerates the LCoFCAS. Our model results for LCoFCAS implicitly assume the baseload provision of FCAS Regulation. The intuition here is that a dedicated baseload service achieves lowest cost (cf. peak provision has a higher cost), and while a battery will co-optimise revenues and undertake arbitrage duties, lowest ‘cost’ replacement for FCAS duties will come from an alternate battery (per ![]() ).
).
29.
This assumes it offers full charging (discharging) capacity for Lower (Raise) service. Note our analysis excludes the possibility that shallow cycling duties, where there state of charge of the battery remains close to 100%, extends the available cycles due to specific battery chemistry (Kempton and Tomic, 2005). Conversely, impact of deep discharging is assumed to be fully captured in the warranted cycle limit.
30.
This is similar the carrying cost of an open cycle gas turbine being a proxy for historical $300 cap prices, which act as a proxy for operational reserve capacity (Simshuaser and Gilmore, 2020).
31.
In practice, most providers offer into multiple reserve markets in the NEM and future batteries would likely do the same. The response able to be registered in each NEM FCAS Reserve market depends on the droop setting of the battery (change in output over change in frequency); faster droop settings allow for more response to be registered. A droop setting of 0.7% is sufficient to allow full participation in each market. Currently, some batteries in the NEM are restricted to 1.7% droop, preventing full utilisation in the fastest FCAS markets. If applied to future batteries, this will result in higher costs to consumers in the long run.
32.
In contrast, historical FCAS prices remained low as there was limited pressure for headroom on coal generators.
References
Supplementary Material
Please find the following supplemental material available below.
For Open Access articles published under a Creative Commons License, all supplemental material carries the same license as the article it is associated with.
For non-Open Access articles published, all supplemental material carries a non-exclusive license, and permission requests for re-use of supplemental material or any part of supplemental material shall be sent directly to the copyright owner as specified in the copyright notice associated with the article.