
Abstract
Introduction
PTEN is part of large family of tyrosine phosphatases and has been found inactivated in a wide variety of human cancers.
Aims
In the present study we have tried to determine the association of the expression patterns of this gene with carcinogenesis.
Methods
First, a systematic review was carried out to ascertain the importance of the PTEN gene and its role in carcinogenesis. In the second phase, a case-control study was designed using different expression analysis techniques. Expression of PTEN mRNA was analyzed using reverse transcriptase polymerase chain reaction (RT-PCR).
Results
Significantly downregulated expression of PTEN was observed in patients with head and neck cancer (HNC) compared to adjacent normal-tissue controls. These results were confirmed with quantitative polymerase chain reaction (qPCR). Significant downregulation of the gene was observed in HNC patients compared to adjacent normal-tissue controls. PTEN expression was correlated with different histopathological parameters of the study cohort by Spearman's correlation coefficient and a significant negative correlation was observed with pT stage (r = −0.271*; p<0.02) and grade (r = −0.228*; p<0.02) of HNC tissues. Furthermore, the expression variations of PTEN were correlated with the expression pattern of the proliferation marker Ki-67. Significantly (p<0.008) upregulated expression of Ki-67 was observed in HNC patients compared with adjacent normal-tissue controls This upregulation of Ki-67 was confirmed at the protein level by immunohistochemistry in HNC patients. When Spearman's correlation was carried out a significant negative correlation was observed between PTEN and Ki-67 (r = −0.230*; p<0.03).
Conclusions
Our data suggest that downregulation of PTEN and overexpression of Ki-67 may contribute to the initiation and progression of HNC.
Introduction
In Pakistan, head and neck cancer (HNC) is second most common cancer after lung cancer in males and breast cancer in females. The prevalence of HNC reported in the Pakistani population is 14.6% (1). More strikingly, the mortality rate associated with HNC has increased by 5% during the past 5 years in Pakistan (2). Major risk factors for HNC are a family history, environmental factors, alcohol and tobacco use, human papilloma virus (HPV) infection, and genetic instabilities including deregulations of different tumor suppressor genes. PTEN is an important tumor suppressor gene and the main regulator of the phosphatidylinositol 3-kinase/AKT signaling pathway that affects many cellular processes including cell proliferation, apoptosis, and invasion. Loss or downregulation of PTEN plays an important role in multiple steps of tumorigenesis and progression of malignancies (3, 4). Loss of PTEN function is commonly observed in human cancers and is associated with both somatic PTEN mutations/deletions and epigenetic variations in PTEN protein levels. Earlier studies have identified PTEN downregulation in several malignancies such as cervical carcinoma (5), breast cancer (6), renal cell carcinoma (7), and colon cancer (8). Loss of PTEN expression has been reported with a higher frequency than mutations (9, 10). Variability in the expression of PTEN has been observed in different cancers but only 2 studies have been reported that explored the expression pattern of the PTEN gene in HNC. The present study was designed to evaluate variations in the expression of PTEN in HNC patients. Additionally, expression deregulation of PTEN was correlated with the expression levels of the proliferation marker Ki-67 in order to further illuminate the role of this gene in the proliferation pathway.
Material and methods
Search Strategy and Selection Criteria for Systematic Review
A comprehensive publication search was conducted in the PubMed database for all eligible studies (updated from January 2001 to March 2015) reporting PTEN expression profiling, using the following search terms: cancer, PTEN, expression analysis, real-time PCR, and mRNA profiling.
There was no restriction on sample size, ethnicity of the population, language, or type of report. All eligible studies were retrieved and checked for other relevant studies. The literature retrieval was performed in duplicate by 2 independent reviewers. Studies were included only if they met the following criteria: 1) case-control studies which evaluated PTEN expression and cancer risk; 2) studies using RNA extracted from tissue samples of cancer patients and adjacent uninvolved noncancerous tissue used as control for comparison; 3) studies using any expression analysis techniques (e.g., IHC, FISH, Western blotting, RT-PCR and qRT-PCR); 4) studies published as full articles in English.
A number of studies were excluded: 1) studies using cancer cell lines, blood samples, serum, or saliva samples; 2) review articles and previous meta-analyses; 3) studies on diseases other than cancer.
Collection of Tumor Samples
Tumors were collected from 80 HNC patients after surgery at the Pakistan Institute of Medical Sciences (PIMS), Islamabad, Pakistan. Microscopically confirmed uninvolved healthy tissue more than 2 cm away from tumor section was taken as control. Tumors along with control tissues were stored in RNAlater storage solution at −80°C. Frozen sections of collected tumor and control tissues were analyzed for the presence of tumor cells by a consultant pathologist using hematoxylin and eosin stain. A specifically designed form was filled out for each patient and proper consent was obtained. Information about addiction, ethnic group, gender and age was recorded. The study was conducted with prior approval from the ethics committees of COMSATS Institute of Information Technology (CIIT) and PIMS.
RNA Isolation and cDNA Synthesis
RNA was isolated from HNC and adjacent uninvolved control samples using standard Trizol reagent with minor modification (11). Extracted RNA was analyzed on 1% TAE gel to confirm the isolation of RNA. After isolation, the RNA yield was quantified with the help of a UV spectrophotometer. Absorbance was measured at wavelengths of 260 and 280nm. Extracted RNA was stored at −80°C. cDNA was synthesized by means of the SuperScript III First-Strand Synthesis System (Invitrogen). Single-stranded cDNA was synthesized from purified total RNA and stored at 4°C.
Reverse Transcriptase Polymerase Chain Reaction
Reverse transcriptase polymerase chain reaction (RT-PCR) was used to analyze RNA expression. In RT-PCR, the expression of a gene is quantified by the synthesis of cDNA. RT-PCR was carried out to assess expression variations of the PTEN gene in HNC samples. The optimized conditions for this reaction were: initial denaturation for 2 minutes at 95°C and 35 cycles of 94°C for 15 seconds, annealing at 56°C for 15 seconds and 72°C for 30 seconds, and final extension at 72°C for 10 minutes. Amplification of internal control β-actin was carried out to check the specificity of the reaction. Amplified products were either stored at 4°C or run on a 2% agarose gel after completion of the PCR reaction.
Quantitative Real-Time PCR
Quantitative real-time PCR (qPCR) was performed using step 1 plus the real-time PCR system (Applied Biosystems) at 56°C under standard conditions. For quantitate PCR, primers specific for PTEN, Ki-67 and β-actin were synthesized by integrated DNA technologies. Each qPCR was performed in a 10-µL reaction mixture containing 1 µL of cDNA, 1 µL of each forward and reverse primer, 5 µL of 2X SYBR Green, and 2 µL of DEPC-treated water. The relative expression of PTEN and Ki-67 were computed using 2-∆∆Ct analysis, where β-actin was used as the reference gene.
Immunohistochemistry and Scoring
Immunohistochemical analysis was carried out using the DAB chromogen for staining. 3.5-µm-thick sections were cut from representative paraffin blocks of 81 HNC tissue samples and placed on glass slides. The sections were first deparaffinized in xylene and then rehydrated in a descending series of ethanol concentrations, as described previously (12). Sections were then blocked with 10% normal serum for 15 minutes at 37°C followed by incubation with mouse anti-Ki-67 antibody (Abcam) at a dilution of 1:1,000 for 1 hour at room temperature. After washing 3 times in PBS, sections were incubated with SignalStain Boost IHC Detection Reagent (Cell Signaling Technology) for 30 minutes at room temperature. After additional washing in PBS, the sections were incubated with 2 drops of reagent 2 conjugate for 10 minutes at room temperature. This was followed by rinsing in PBS solution 3 times. One drop of reagent A, 2 drops of reagent B, and 1 drop of reagent C were added in 1 mL distilled water. This was mixed and protected from light, and used within 1 hour. Two drops of DAB chromogen were added to the slides and left for 10-15 minutes.
The slides were washed in distilled water and counterstained with hematoxylin for approximately 10 minutes. Slides were rinsed in distilled water, cover-slipped using aqueous mounting medium, and allowed to dry at room temperature. Negative controls were prepared using the same procedure except that the primary antibodies were replaced with PBS.
The relative intensities of the completed immunohistochemical reactions were evaluated using light microscopy by 3 independent trained observers who were unaware of the clinical data. Tumor cells were counted randomly in 10 high-power fields for measurement of immunoreactivity. The following formula was used for the evaluation of immunoreactivity:
immunoreactive score = intensity score × proportion score.
The intensity score was categorized as 0 at negative staining intensity, 1 at weak intensity, 2 at moderate intensity, and 3 at strong staining intensity. The proportion score was categorized as 0 at no positive cells, 1 at ≤10% positive cells, 2 at 11%-50% positive cells, 3 at 51%-80% positive cells, and 4 at >80% positive cells. This immunoreactivity (range from 0 to 12) was divided into low immunoreactivity (total immunoreactive score 0-4) and high immunoreactivity (total immunoreactive score >4).
Statistical Analysis
Statistical analysis was performed using the GraphPad Prism 6.0 software and the SPSS 17.0 software package. Student's t-test, 1-way analysis of variance (ANOVA), and Tukey‘s post hoc test were used to assess the association of PTEN and Ki-67 gene expression with clinical and histopathological parameters (e.g., TNM stage and differentiation grade). Spearman's correlation coefficient was used to assess correlations between gene-gene expression and gene-clinical and histopathological parameters.
Results
In the first part of this study a meta-analysis was performed to evaluate the association between PTEN expression and cancer susceptibility especially as a risk factor of HNC. Based on our search criteria, 147 studies relevant to the role of PTEN expression in cancer/disease susceptibility were identified. Ninety-seven studies were excluded for the following reasons: (i) 5 studies involved PTEN expression in patients with diseases other than cancer, for example, diabetes, cataract, endometriosis, and so forth; (ii) 19 studies involved mutational analysis of PTEN; (iii) 73 studies involved animal models or cell lines as samples for PTEN expression analysis.
Only 49 studies met the inclusion criteria and were selected for this analysis, as shown in Table I.
Literature search in PubMed database for all eligible studies reporting PTEN gene
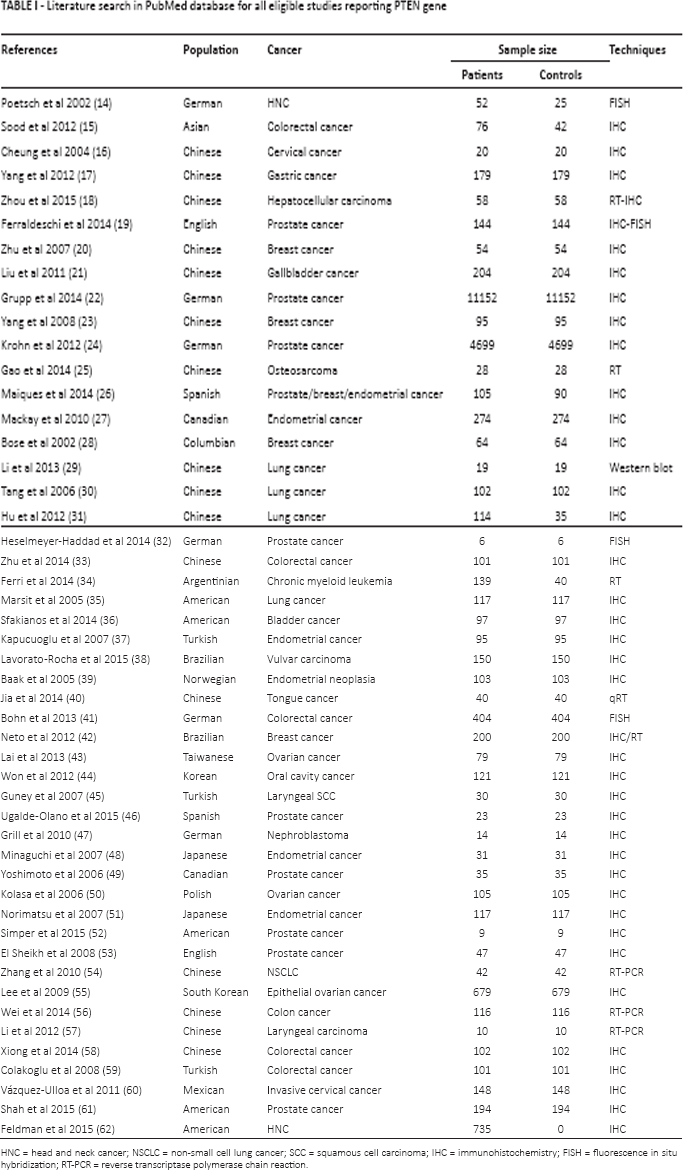
HNC = head and neck cancer; NSCLC = non-small cell lung cancer; SCC = squamous cell carcinoma; IHC = immunohistochemistry; FISH = fluorescence in situ hybridization; RT-PCR = reverse transcriptase polymerase chain reaction.
Expression of PTEN gene by RT-PCR
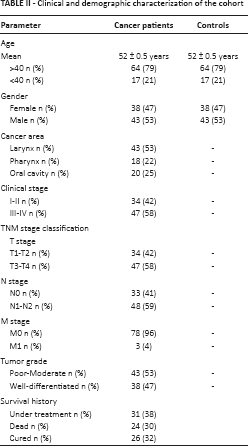
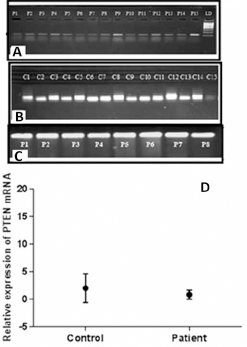
Expression analysis of PTEN gene was performed using semiquantitative RT-PCR. Eighty-one HNC tissues along with adjacent normal control tissue samples were used for RT-PCR analysis of the gene. The frequency distribution of HNC patients with different parameters and categories studied is given in Table II. In the majority of these paired samples, PTEN levels were downregulated when compared with noncancerous control samples, as shown in Figure 1. β-actin expression was used as internal control.
Clinical and demographic characterization of the cohort
Expression of PTEN in tumor tissue samples
The results of RT-PCR were further visualized by gel documentation and the intensity of the bands was measured using the GelQuant software. The quant values generated for the gene of interest were normalized to the quant values of β-actin in HNC tissue samples and normal control samples. Fold changes of tumor samples were measured by dividing the normalized PTEN value of patients by the mean value of controls. A significantly (p<0.05) decreased fold change in PTEN expression was observed in HNC tissues when compared with fold values of control tissues, as shown in Figure 1.
Expression of PTEN gene by qPCR
Expression analysis of the PTEN gene in 81 tumor tissues along with control tissues using qPCR showed significant (p<0.05) downregulation of the PTEN gene in HNC tissues compared with control tissue samples, as shown in Figure 2. A statistically significant decrease in PTEN expression was observed in relation to clinical stage (p<0.03) and T stage (p<0.05). PTEN expression was significantly lower in HNC tumors at clinical stages III-IV than stages I-II, and in T3-T4 tumors than in T1-T2 tumors, as shown in Figure 2. A significant decrease in PTEN expression was observed in patients with N1-N2 stage (p<0.05) (Fig. 2) and in poor-moderate grades (p<0.0001) compared with N0 stage and well-differentiated tumors (Fig. 3). Highly significant (p<0.0001) downregulation of the PTEN gene was also observed in patients who died compared with those who were cured or undergoing treatment, as shown in Figure 3. Furthermore, relative expression of the PTEN gene was correlated with the area of HNC by Tukey's post hoc test. Highly significant (p<0.0001) downregulation of PTEN was observed in tumors of the oral cavity compared with laryngeal and pharyngeal tumors, as shown in Figure 3.
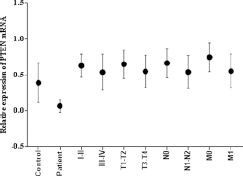
mRNA expression of PTEN in HNSCC tumor samples. Column plot comparing the PTEN mRNA levels of HNSSC tumors and normal control samples; HNSCC tumor samples at clinical stage I-II and clinical stage III-IV; tumors at different pT stages; with lymph node involvement (N1-N2) and without lymph node involvement (N0); with metastasis (M1) and without metastasis (M0).
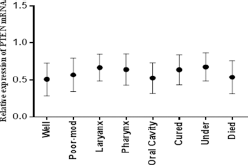
mRNA expression of PTEN in HNSCC tumor samples. Column plot comparing the PTEN mRNA level of HNSCC samples in different areas, in different grades of HNSCC, and with survival data. P values were computed using 1-way ANOVA and chi-square test.
Expression of Ki-67 gene by qPCR
Furthermore, expression analysis of the proliferation marker Ki-67 was carried out in 81 HNC tissues and compared with adjacent noncancerous control tissues. Expression analysis of Ki-67 was performed using qPCR and highly significant (p<0.0001) upregulation of the Ki-67 gene was observed in HNC tissues compared with control tissue samples, as shown in Figure 4. Significant upregulation was observed in advanced tumor stage (T3-T4; p<0.04) and lymph node status (N1-N2; p<0.03) compared to early stages of HNC. Upregulated expression of Ki-67 was observed in more advanced clinical stages (III-IV) and metastatic stage (M1-M2), but this upregulation was not statistically significant (Fig. 4). Highly significant upregulation of Ki-67 was observed in poorly differentiated HNC tumors (p<0.01) compared with moderately and well differentiated tumors, as shown in Figure 4. Significantly upregulated (p<0.008) expression of Ki-67 was also observed in HNC patients who died compared with those who were cured and those under treatment (Fig. 5). The relative expression of the Ki-67 gene was correlated with the area of HNC using Tukey's post hoc test. Significant upregulation (p<0.04) of Ki-67 was observed in tumors of the oral cavity and pharynx compared with laryngeal tumors, as shown in Figure 5.
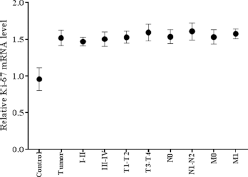
mRNA expression of Ki-67 in HNSCC tumor samples. Column plot comparing the Ki-67 mRNA levels of HNSSC tumors and normal control samples; HNSCC tumor samples at clinical stage I-II and clinical stage III-IV; tumors at different pT stages; with lymph node involvement (N1-N2) and without lymph node involvement (N0); with metastasis (M1) and without metastasis (M0).
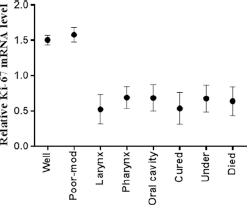
mRNA expression of Ki-67 in HNSCC tumor samples. Column plot comparing the Ki-67 mRNA level of HNSCC tumor samples in different areas, in different grades of HNSCC tumor samples, and with survival data. P values were computed using 1-way ANOVA and chi-square test.
Correlations between different Clinicopathological Characteristics, PTEN gene and Ki-67
With regard to relationships between different clinicopathological characteristics, a positive correlation was observed between gender and area (r = 0.312**, p<0.005), pT stage and pC stage (r = 0.930**, p<0.001), pT stage and pN stage (r = 0.990**, p<0.001), pT stage and grade (r = 0.231*, p<0.03), pC stage and pN stage (r = 0.920**, p<0.001), and pC stage and grade (r = 0.227*, p<0.04). A negative correlation was observed between age and pT stage (r = −0.342*, p<0.002), age and pC stage (r = −0.323**, p<0.003), age and pN stage (r = −0.317**, p<0.004), and age and area (r = −0.307**, p<0.005) (Tab. III).
Correlations between PTEN gene and proliferation marker (Ki-67) expression and clincopathological characteristics of primary HNC †
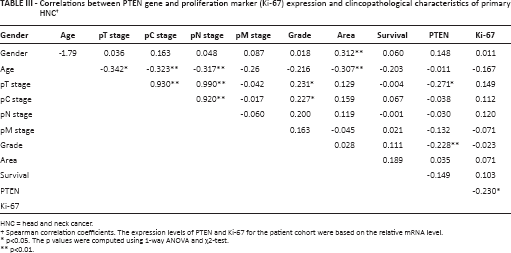
HNC = head and neck cancer.
Spearman correlation coefficients. The expression levels of PTEN and Ki-67 for the patient cohort were based on the relative mRNA level.
p<0.05. The p values were computed using 1-way ANOVA and χ2-test.
p<0.01.
However, with regard to relationships between clinicopathological characteristics and gene expression, a significant negative correlation was observed between pT stage and PTEN (r = −0.271*, p<0.02), grade and PTEN (r = −0.228*, p<0.02), and PTEN and Ki-67 (r = −0.230*, p<0.039). Moreover, we observed a positive Spearman's correlation between PTEN and Ki-67 (r = 0.230
Immunohistochemical Analysis of Ki-67
Immunohistochemical analysis was used to assess the expression of the proliferation marker Ki-67 in 81 HNC tumor tissues. Immunostaining for Ki-67 was observed in the nuclear region only and Ki-67 staining was interpreted as positive when >25% cells showed distinct nuclear staining (13).
Positive and negative controls were used to test the procedure and to check the specificity of the primary antibody and secondary antibody, respectively. Tonsil tissue was used as positive control for Ki-67. For negative control, instead of the primary antibody, phosphate-buffered saline (PBS) was applied on a duplicate slide and then treated with secondary antibody and so on.
The expression profiles of the proliferation marker Ki-67 were compared in well-differentiated, moderately differentiated, and poorly differentiated head and neck squamous cell carcinoma (HNSCC) cases. The protein level of Ki-67 was overexpressed (p<0.05) in HNSCC tissues compared with positive control tissue samples. Overexpression was more frequent in poorly differentiated tumors than well or moderately differentiated HNSCC samples (Figs. 6A, 6B and 6C). As illustrated in Figure 6D, among the 81 HNSCC samples that we examined, 19% exhibited downregulated Ki-67 expression, 75% exhibited upregulated Ki-67 levels, and 6% showed no change (Fig. 6D). The relative immunoreactive intensities of Ki-67 protein showed that 21% of cases had weak immunoreactive intensity, 30% had moderate immunoreactive intensity, and 49% had strong immunoreactive intensity. Strong immunoreactive intensity of Ki-67 was significantly more frequent (p<0.05) in HNSCC tumor samples than weak and moderate immunoreactive intensity.
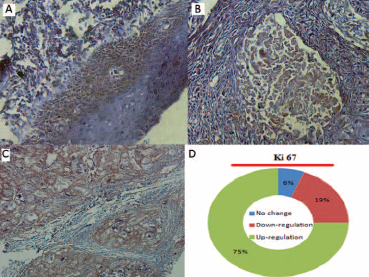
Immunohistochemistry analysis of Ki-67 expression in HNSCC tissue samples. Immunohistopathological analysis was performed to examine the Ki-67 expression in well-differentiated primary tumor
Discussion
HNC is a disease that is responsible for considerable morbidity and mortality worldwide (63). Tobacco use, alcohol consumption, reactive oxygen species, ultraviolet radiation and genetic abnormalities are the major risk factors for HNC development (64). Molecular/genetic abnormalities such as mutations and expression deregulations that could mediate an increase in the risk of HNC progression have been the focus of many studies. One recently implicated molecular factor is deregulation of different tumor suppressor genes such as PTEN, a protein/lipid phosphatase in carcinogenesis (65). PTEN plays an important role in tumor suppression. It is part of a large family of tyrosine phosphatases (4) and controls different cellular properties such as migration (66), invasion, adhesion (67) and growth (68), mainly with the help of the dual-specificity phosphatase domain. The main mechanism of tumor suppression by PTEN is the maintenance of cellular PIP-3 at low levels, thus inhibiting the PI3K-AKT pathway and contributing to apoptosis or cell cycle arrest (69, 70). PTEN has been found inactivated in a wide variety of human cancers such as lung (71), colorectal (72), prostate (19), breast (73) and gastric cancer (74). However, only 1 study with a small study cohort is available regarding the expression profiling of this gene in HNC (14). The present study was designed with a relatively large study cohort to evaluate the expression variations of PTEN in HNC patients and to correlate these with the expression levels of the proliferation marker Ki-67, in order to further illuminate the role of PTEN in the proliferation pathway.
In the first part of this study a systematic review was carried out to explore the association of PTEN expression with HNC carcinogenesis. The results of this review revealed that 48 studies focused only on PTEN expression for its role in carcinogenesis and the majority of studies (90%) studied the association of PTEN expression with different cancers (Tab. I).
In the present study the expression profiles were analyzed in 81 HNC samples along with adjacent noncancerous tissues using RT-PCR and qPCR. Significant downregulation of PTEN was observed with RT-PCR in HNC tissues compared with uninvolved control tissues. A similar pattern of downregulation was observed with qPCR. The downregulated expression of the PTEN gene had previously been reported in different cancers (26). Although the exact mechanisms of downregulated PTEN expression are unknown, the chief putative causes include mutations, deletions, copy number changes, and methylation of promoter regions (75). Mutations and deletions in PTEN are related not only to primary solid tumors, in which the modifications are somatic, but also to germline cells (42). Germinal mutations can lead to several hereditary syndromes such as Cowden syndrome, Bannayan-Riley-Ruvalcaba syndrome and Proteus syndrome. These conditions mediate the development of multiple benign tumors (hamartomas) that can progress to malignant tumors. These findings demonstrate that PTEN has a critical function in tumor suppression (42). In the present study PTEN expression was further downregulated in more advanced pT stage, pN stage, and grade of HNC tissues. So reduced expression of PTEN may result in enhanced proliferation and an uncontrolled cell cycle, which can ultimately result in more aggressive disease with the involvement of distant lymph node metastasis (54).
In the third step, we evaluated the association of the tumor suppressor gene with the proliferation pathway and we assessed the expression deregulation of the proliferation marker Ki-67 in the same study cohort with upregulated PTEN levels. Significant upregulation of Ki-67 was observed in HNC tissues compared with adjacent controls. These findings correspond to the results of an earlier study (64) where it was reported that the Ki-67 expression level was significantly increased in HNC patients. Ki-67 protein expression strictly correlates with cell proliferation and with the active phases of the cell cycle. Increased expression of Ki-67 results in an abnormal cell cycle with uncontrolled proliferation and more aggressive tumors (76). In our study Ki-67 upregulation was found to be positively correlated with tumor size, lymph node metastasis, and grade of HNC. Similar results have earlier been reported regarding associations between high Ki-67 index and clinico-histopathological parameters such as tumor size, histological grade and lymph node status (77, 78).
In the present study we also examined by immunohistochemistry the expression profile of Ki-67 in 81 HNSCC samples. Upregulation of Ki-67 was observed in HNSCC samples compared with positive controls (Tonsil tissue was used as positive control for Ki-67). This upregulation was higher in poorly differentiated tumor samples compared to well or moderately differentiated tumor samples. Upregulation of Ki-67 has been consistently observed in different types of cancer (79, 80). Nuclear staining of the malignant epithelium was seen. The staining intensity in this study ranged from strong to weak. A similar staining trend of Ki-67 was reported in SCC of the tongue (81), non-Hodgkin's lymphoma (82), breast carcinoma (83) and myoepithelial carcinoma (84). The main reason for the higher protein level of Ki-67 in HNSCC is unknown. However, previous studies have reported that Ki-67 upregulation is related to excessive proliferation, recurrence, metastasis and more aggressive tumors in different cancer types (76, 79).
For gene to gene interaction, the expression patterns of the PTEN gene were correlated with the expression levels of Ki-67 using Spearman's correlation coefficient and a significant negative correlation was observed between PTEN and Ki-67. These observations show that downregulated levels of the tumor suppressor gene PTEN result in abnormal cell cycle phase, uncontrolled division, and enhanced proliferation. Similar results have been observed in earlier studies where Ki-67 expression correlated with OGG1, APEX1 and XRCC1 (11, 64).
In conclusion, this study showed the prognostic value of PTEN and Ki-67 in patients with HNC in the Pakistani population. Our data suggest that downregulation of the PTEN gene combined with upregulation of Ki-67 may contribute to the initiation and progression of HNC in the Pakistani population.
Footnotes
Acknowledgment
All authors would like to acknowledge the patients who contributed to this research work; we also acknowledge the hospital staff (Pakistan Institute of Medical Sciences and Military Hospital Rawalpindi, Pakistan) for their cooperation.
Financial support: None.
Conflict of interest: All authors declare that they have no conflict of interests.