
Abstract
Background
The aim of this study was to evaluate the gene expression profiles of a set of prostate cancer–associated genes in prostate cancer cell lines, to determine their association with different cancer phenotypes and identify potential novel biomarkers for this disease.
Methods
Quantitative real-time PCR was used to determine the expression profiles of 21 prostate cancer–associated genes in the human prostate cancer cell lines PC-3 and LNCaP, using the nontumorigenic cell line PWR-1E as control cell line. Genes evaluated were ESM-1, SERPINE2, CLU, BGN, A2M, PENK, FMOD, CD81, DCN, TSPAN8, KBTBD10, F2RL1, TMSB4X, SNCG, CXXC5, FOXQ1, PDPN, SPN, CAV1, CD24 and KLK3. A potential biomarker from this set of genes, the FMOD gene, encoding the small leucine-rich proteoglycan fibromodulin, was selected for further evaluation in clinical samples from patients diagnosed with benign or malignant prostatic disease.
Results
Several of the evaluated genes showed significantly altered expression in the prostate cancer cell lines, compared with nontumorigenic PWR-1E cells. Further evaluation of FMOD transcript in prostate clinical samples from patients diagnosed with benign or malignant prostatic disease identified a significant difference in the expression levels of this proteoglycan between benign and malignant tissue (p<0.05).
Conclusions
A number of gene transcripts were differentially expressed by the cell lines assayed. Among them, FMOD was further evaluated in clinical samples and was found to be differentially expressed between benign and prostate cancer tissue. Further validation of FMOD transcript in a larger population is required to ascertain its usefulness as biomarker for prostate cancer.
Introduction
According to global cancer statistics, prostate cancer (PCa) is the second most common malignant tumor diagnosed in males and the fifth cause of death in the world, representing 15% (1,111,700) of total new cases and 6.6% (307,500) of cancer deaths (1). In United States, according to estimates of the American Cancer Society for 2015, PCa represents the first cancer type in males, with 220,800 estimated new cases (26%) and 27,540 estimated deaths (8.8%) (2). In Colombia, statistics from the National Cancer Institute show that prostatic adenocarcinoma is the second cause of death in Colombian males over 65 years, with an estimated prevalence rate of 12/100,000 male inhabitants and incidence rate of 6,521 cases (30/100,000 male inhabitants) (3).
The impact of PCa in the population is due in part to the lack of satisfactory methods for early diagnosis and prognosis, which results in delayed clinical treatment for this disease (4). For example, the biomarker currently used for PCa diagnosis is the prostate-specific antigen (PSA), which is considered the best tumor biomarker available, but it is also regarded as a biomarker with many drawbacks (5). Thus, new and better molecular biomarkers are urgently needed for an opportune diagnosis and adequate prediction of the clinical course of the disease, since effective treatments exist for early stages, but it is practically incurable in advanced stages (5).
In the present study, we determined the mRNA expression profiles of a panel of 21 relevant PCa-associated genes selected from a previous oligonucleotide microarray study in which we identified a large number of metastasis-associated genes in rat PCa cell lines (6). A total of 18 genes from the panel are not currently regarded as biomarkers for PCa, but they are known to be involved in complex biological pathways relevant to the cancer process, such as cell cycle regulation, apoptosis, angiogenesis, cell adhesion, extracellular matrix regulation, cytokine/growth factor/hormone receptor mediated signal transduction, and cell motility.
The expression of the selected group of genes was evaluated by reverse transcriptase quantitative polymerase chain reaction (RT-qPCR) in the human PCa cell lines LNCaP (low aggressive cancer phenotype) and PC-3 (highly aggressive cancer phenotype) using the nontumorigenic cell line PWR-1E as control cell line. To our knowledge, these genes have not been reported previously in association with PCa, thus they may represent potential novel candidate genes for this disease.
After a literature review of the genes found to be differentially expressed, we selected FMOD for further validation to determine its potential as a biomarker for PCa. FMOD gene encodes fibromodulin, a small leucine-rich proteoglycan important for extracellular matrix organization and essential for tissue repair in multiple organs (7). Although fibromodulin has been identified as a novel tumor-associated antigen in leukemia, lymphoma and leiomyoma (8, 9), knowledge about its expression in the prostate is limited. Here we evaluated the expression of FMOD gene on both Tissue qPCR Arrays and prostatic tissue specimens, to get insights into its potential value as a biomarker for PCa. We also performed end point PCR and subsequent sequencing to verify that PCa cell lines truly expressed the FMOD transcript.
Methods
Cultured Cell Lines
Androgen-sensitive human metastatic prostate adenocarcinoma LNCaP Clone FGC cells (ATCC® CRL-1740), human bone metastasis-derived PCa PC-3 cells (ATCC® CRL-1435), nontumorigenic human prostatic epithelial PWR-1E cells (CRL-11611) and adult normal human dermal fibroblasts (PCS-201-012) were obtained from the ATCC (Manassas, VA, USA). LNCaP cells were routinely maintained in a complete growth medium consisting of RPMI 1640 (Gibco/Invitrogen, Carlsbad, CA, USA) supplemented with 10% fetal bovine serum (FBS; Gibco/Invitrogen) and 1% penicillin-streptomycin (Gibco/Invitrogen). PC-3 cells were maintained in phenol red-positive F-12K modified medium (ATCC) containing 10% FBS and 1% penicillin-streptomycin. PWR-1E cells were maintained in keratinocyte serum-free medium (Life Technologies) supplemented with 50 μg/mL bovine pituitary extract, 5% L-glutamine and 5 ng/mL epidermal growth factor. PCS-201-012 cells were maintained in DMEM supplemented with 10% FBS. Cells were grown as monolayers in T-25 tissue culture flasks, in a humidified atmosphere containing 5% CO2 at 37°C and passaged once/twice a week. For all the experiments, cells were harvested at low passage numbers: LNCaP cells between passages 23 and 26, PC-3 cells between passages 28 and 31, PWR-1E between passages 18 and 22, and PCS-201-012 cells at passages 8 to 12.
Panel of PCa-Associated Genes
The gene panel evaluated in this work included 21 genes: endothelial cell-specific molecule 1 (ESM-1), serpin peptidase inhibitor 2 (SERPINE2), clusterin (CLU), biglycan (BGN), α2-macroglobulin (A2M), proenkephalin (PENK), fibromodulin (FMOD), CD81 molecule (CD81), decorin (DCN), tetraspanin 8 (TSPAN8), kelch repeat and BTB (POZ) domain containing-10 (KBTBD10), coagulation factor II (thrombin) receptor-like 1 (F2RL1), thymosin beta 4 (TMSB4X), synuclein gamma (SNCG), CXXC finger protein 5 (CXXC5), forkhead box Q1 (FOXQ1), podoplanin (PDPN) and syalophorin (SPN). Genes previously regarded as metastasis-associated genes, CD24 molecule (CD24) and caveolin-1 (CAV1), and the current biomarker for PCa diagnosis, kalikrein 3/PSA (KLK3/PSA), were included in the study for comparison and validation purposes. The reference genes hypoxanthine-guanine phosphoribosyl transferase-1 (HPRT1) and β-actin (ACTB) were included for normalization of gene expression.
Primer Design and PCR Array
For qPCR, primers specific for each gene were designed with Primer-BLAST (10) using sequences from GenBank database. All primers were designed to span at least 1 exon–intron boundary to avoid detection of residual genomic DNA.
For end point PCR assays and sequencing, primers for FMOD were designed to amplify a sequence of 864 bp between the first and second exon of this gene. For mRNA expression analysis of the 21 genes in the 3 prostatic cell lines, primers for each target and reference genes were arrayed in PCR plates, in triplicates. Primers were synthesized by Eurofins MWG Operon (Ebersberg, Germany). Sequences for primers used in quantitative PCR and end point PCR are presented in Table I.
Primer sequences for PCR assays
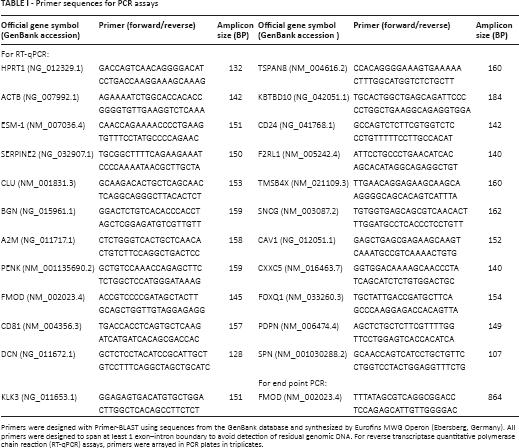
Primers were designed with Primer-BLAST using sequences from the GenBank database and synthesized by Eurofins MWG Operon (Ebersberg, Germany). All primers were designed to span at least 1 exon–intron boundary to avoid detection of residual genomic DNA. For reverse transcriptase quantitative polymerase chain reaction (RT-qPCR) assays, primers were arrayed in PCR plates in triplicates.
Total RNA Extraction and Quality Control
Total RNA was isolated from cell lines LNCaP, PC-3, PWR-1E and PCS-201-012, grown to approximately 80% confluence, using TRI-Reagent (Ambion), following the manufacturer's instructions. The concentration and purity of the extracted total RNA was assessed spectrophotometrically by measuring the OD260 and OD260/280 ratio, respectively, in RNase-free H2O using a NanoDrop 2000c (Thermo Scientific). Three replicates of each RNA sample were measured, and the measured concentrations were averaged. For all samples, the OD260/280 ratio was ~2.0. Total RNA samples were stored at −80°C until used.
cDNA Synthesis and RT-qPCR
RNA samples from cell lines were processed for reverse transcription using the QuantiTect Reverse Transcriptase kit (Qiagen). First, to eliminate any contaminating genomic DNA, 1 μg of total RNA was incubated with genomic DNA Wipeout Buffer (Qiagen) for 2 minutes at 42°C. The reverse transcription master mix, containing QuantiTect RT enzyme, QuantiTect RT Buffer and RT Primer Mix (oligo-dT and random primers), was prepared and added to the template RNA. Samples were incubated at 42°C for 15 minutes, followed by inactivation at 95°C for 3 minutes. A 20-μL final volume of cDNA was stored at −20°C until used in qPCR.
qPCR reactions for each samples were carried out in triplicate, in 48-well optical PCR plates (Applied Biosystems), using QuantiTect® SYBR® Green PCR Master Mix (Qiagen) in a StepOne thermocycler (Applied Biosystems), with an initial denaturing step at 95°C for 15 minutes, followed by 40 cycles of amplification of 95°C for 15 seconds, 55°C for 45 seconds and 60°C for 1 second. Negative controls (nontemplate control and negative reverse transcriptase control) were also included. Relative changes in gene expression for each target gene in the 3 cell lines were calculated with the Sequence Detection System 2.1 software (Applied Biosystems), using the comparative CT method (2-ΔΔCT). Expression levels for each target gene were normalized to the expression levels of the reference genes HPRT1 and β-actin. Melting curves for all samples were acquired for quality control purposes.
FMOD and KLK3/PSA Transcript Levels in Clinical Samples
Based on the gene expression results from the cell line studies, we selected FMOD as a potential biomarker and decided to further analyze its transcript expression in clinical samples and compare it with the expression of the KLK3/PSA gene.
Tissue qPCR Arrays (PCa cDNA panel)
TissueScan® qPCR Array plates were purchased from Origene Technologies Inc. (Rockville, MD, USA). Panels included cDNA obtained from 39 different patients covering 2 disease stages and normal tissues (10 cancer, 23 benign prostatic hyperplasia and 6 normal). TissueScan® qPCR Arrays are panels of normalized cDNA prepared from pathologist-verified human tumor tissues. According to the vendor, the cDNAs were prepared from high quality prostatic tissues. After suspension of lyophilized cDNAs, qPCR was performed to analyze the transcript expression of the FMOD and KLK3/PSA genes in the cDNA panel of clinical samples. PCR reactions were carried out using QuantiTect® SYBR® Green PCR Master Mix (Qiagen) in a StepOne thermocycler (Applied Biosystems), with an initial denaturing step at 95°C for 15 minutes, followed by 40 cycles of amplification of 95°C for 15 seconds, 55°C for 45 seconds and 60°C for 1 second. Relative mRNA expression quantification for FMOD and KLK3/PSA were calculated with the Sequence Detection System 2.1 software (Applied Biosystems), using the comparative CT method (2-ΔΔCT). Melting curves for all samples were acquired for quality control purposes, and expression levels for each target gene were normalized to the reference gene β-actin.
Prostatic Tissue Biopsies
For these experiments, prostatic tissue specimens were obtained with local ethics approval and after a signature was collected on informed consent forms from patients undergoing diagnosis by histology of needle-biopsy cores at the Hospital Universitario del Caribe in the city of Cartagena, Colombia. A tissue biopsy core for gene expression analysis was obtained from each participating patient subjected to diagnostic transrectal ultrasound-guided prostate biopsy, which was performed by an experienced radiologist, using a spring-loaded biopsy gun (Anvotech®) and 18-gauge Tru-Cut® needle (Carefusion, UK). Tissue biopsy specimens were later classified into benign prostatic hyperplasia (BPH) and PCa groups, based on the pathology reports of the respective patients, and further confirmed by histological examination of matched “mirror” biopsy cores taken from the same zone at the time of the biopsy procedure. To preserve RNA integrity, prostate tissue biopsy specimens from patients were immediately immersed in RNAlater® (Life Technologies) in the operating room, stored overnight at 4°C and then frozen at −80°C until used for RNA extraction. For RNA isolation, biopsy specimens stored in RNAlater® were thawed at room temperature, excess RNAlater® was removed, and samples were immediately submerged in RNA isolation lysis solution (TRI-Reagent; Ambion), and homogenized with a TissueRuptor (Qiagen) following the manufacturer's instructions. A total of 48 prostate tissue samples, 1 per patient, consisting of 20 BPH tissue biopsies and 28 PCa tissue biopsies (PCa), were subjected to total RNA extraction. Concentration and purity of total RNA samples was assessed by spectrophotometry at OD260/OD280 ratio with a NanoDrop 2000c (Thermo Scientific). To eliminate any contaminating genomic DNA, 1 μg of total RNA was incubated with genomic DNA Wipeout Buffer (Qiagen) for 2 minutes at 42°C, and then reverse transcribed into first-strand cDNA in a 20-µL reaction volume, using QuantiTect Reverse Transcriptase kit (Qiagen) containing a mix of oligo-dT and random primers. Samples were incubated at 42°C for 15 minutes, followed by inactivation at 95°C for 3 minutes and stored at −20°C. cDNA was used for subsequent qPCR to analyze the transcript expression of FMOD and KLK3/PSA. PCR reactions for each sample were carried out in triplicate, in 48-well optical PCR plates (Applied Biosystems), using QuantiTect® SYBR® Green PCR Master Mix (Qiagen) in a StepOne thermocycler (Applied Biosystems), with an initial denaturing step at 95°C for 15 minutes, followed by 40 cycles of amplification of 95°C for 15 seconds, 55°C for 45 seconds and 60°C for 1 second. Negative controls (nontemplate control and negative reverse transcriptase control) were also included. Relative mRNA expression quantification for FMOD and KLK3/PSA were calculated with the Sequence Detection System 2.1 software (Applied Biosystems), using the comparative CT method (2-ΔΔCT). Melting curves for all samples were acquired for quality control purposes, and expression levels for each target gene were normalized to the expression levels of the reference genes HPRT1 and β-actin.
End Point PCR Assays and Sequencing of FMOD Gene Fragment
To verify that prostatic cell lines LNCaP, PC-3 and PWR-1E indeed expressed the FMOD transcript, end point PCR was carried out using cDNA prepared from each of these cell lines and primers designed to amplify a specific fragment of 864 bp between the first and second exon of the FMOD gene. The human normal dermal fibroblast cell line PCS-201-012 was used as a positive control for the PCR reaction, as it is widely known that skin fibroblasts express the FMOD gene (11). Conventional PCR amplification was carried out with GoTaq® Green Master Mix (Promega) in a 25-μL reaction volume containing 12.5 μL of PCR mix, 0.2 μM of each primer and 5 μL of cDNA. PCR reactions were carried out in a Perkin-Elmer thermocycler with a denaturing cycle at 94°C for 5 minutes, followed by 30 cycles of 94°C for 1 minute, 55°C for 30 seconds and 72°C for 30 seconds, with a final 7-minute extension step at 72°C. Amplified products were separated in 2% agarose gel, then purified using the QIAprep Spin Ml 3 Kit (Qiagen, Valencia, CA, USA) and subjected to DNA sequencing in both directions (Genewiz Technical Services, South Plainfield, NJ, USA) with the same primers used in the amplification. Sequencing data were compared with the published FMOD gene sequence deposited in the GenBank database, using the BLASTN 2.2 search program.
Statistical Analysis
Statistical significance of differences in gene expression for each target gene between each of the PCa cell lines and the nontumorigenic cell line was analyzed by Student's t-test; all observations are derived from at least 3 independent experiments. For experiments using the cDNA panel, differences in expression levels of genes between the cancer group and the benign or the normal group were determined with the nonparametric Mann-Whitney test, as data did not pass the D'Agostino-Pearson omnibus normality test. For prostate tissue specimens, as the 2 groups of samples have unequal variances and unequal sample sizes, and the data passed the D'Agostino-Pearson omnibus normality test, statistical significance of differences in gene expression between the BPH and PCa groups was determined using an unpaired t-test with Welch's correction. Expression values for FMOD in clinical samples were plotted on a receiver operator characteristic (ROC) curve to analyze the extent to which the relative FMOD mRNA expression was able to differentiate cancer from benign disease. An area under the curve was calculated (from 0.0 to 1.0), and a coordinate table was used to select a favorable intersection point of sensitivity (ordinate) and specificity (abscissa), which corresponded to the cutoff. ROC curves were generated using the DeLong mathematical model (12) and compared in a 2-tailed test. Statistical analysis and graphs were performed with GraphPad Prism (GraphPad Software Inc, San Diego, CA, USA), and a p value <0.05 was considered statistically significant.
Results
Gene Expression Profile of a Group of PCa–Associated Genes in PCa Cell Lines
Expression data for gene targets analyzed by qPCR are presented in Table II. Overall, quantitative PCR results showed that prostatic cell lines with different cancer phenotypes had different expression profiles for the set of genes tested. In detail, transcripts for genes CAV1 and ESM-1 were highly expressed in the aggressive PC-3 cell line but undetected in the low aggressive LNCaP cell line, while A2M and KLK3 were at high expression in LNCaP but undetected in PC-3 cells. In both LNCaP and PC-3 cells, transcripts for CD81, CXXC5, KBTBD10 and FMOD were found overexpressed, while transcripts for SERPINE2 and DCN were found underexpressed. CAV1, ESM-1, CD24 and F2RL1 were found overexpressed only in PC-3, whereas KLK3/PSA and A2M were found overexpressed exclusively in LNCaP. Transcripts for CLU, BGN and SNCG were not differentially expressed among the 3 cell lines, while transcripts for PENK, TSPAN8 and PDPN were undetected in the 3 cell lines evaluated. KLK3/PSA, the biomarker for PCa diagnosis, was also evaluated and found highly expressed by LNCaP cells and undetected in PC-3 cells, a finding that has been reported before, thus validating our gene expression results (13-14-15).
Expression data for targets analyzed by quantitative PCR
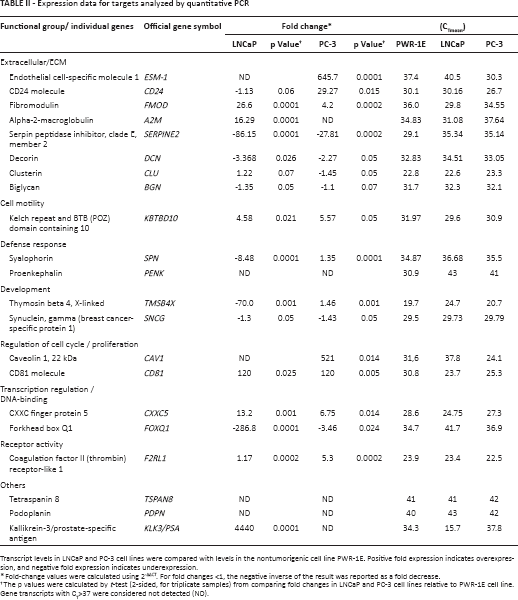
Transcript levels in LNCaP and PC-3 cell lines were compared with levels in the nontumorigenic cell line PWR-1E. Positive fold expression indicates overexpression, and negative fold expression indicates underexpression.
Fold-change values were calculated using 2-ΔΔCT. For fold changes <1, the negative inverse of the result was reported as a fold decrease.
The p values were calculated by t-test (2-sided, for triplicate samples) from comparing fold changes in LNCaP and PC-3 cell lines relative to PWR-1E cell line. Gene transcripts with CT>37 were considered not detected (ND).
FMOD and KLK3/PSA transcript expressions were further evaluated and compared in the different prostatic cell lines. Expression of FMOD was also analyzed in the fibroblast cell line PCS-201-012, a cell line known to express fibromodulin. Results are shown in Table III.
FMOD and KLK3/PSA transcript expression profile in cultured cell lines and clinical samples
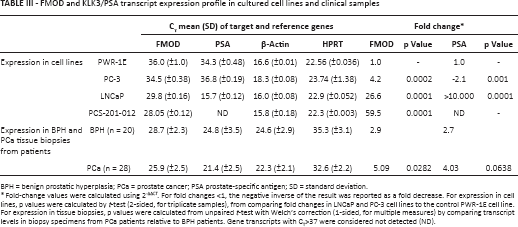
BPH = benign prostatic hyperplasia; PCa = prostate cancer; PSA prostate-specific antigen; SD = standard deviation.
Fold-change values were calculated using 2-ΔΔCT. For fold changes <1, the negative inverse of the result was reported as a fold decrease. For expression in cell lines, p values were calculated by t-test (2-sided, for triplicate samples), from comparing fold changes in LNCaP and PC-3 cell lines to the control PWR-1E cell line. For expression in tissue biopsies, p values were calculated from unpaired t-test with Welch's correction (1-sided, for multiple measures) by comparing transcript levels in biopsy specimens from PCa patients relative to BPH patients. Gene transcripts with CT>37 were considered not detected (ND).
FMOD and KLK3/PSA Transcript Expression in a Commercial cDNA Panel from Clinical Prostate Tissue Samples
To evaluate the potential of FMOD as a biomarker for PCa, transcript expressions of FMOD and KLK3/PSA genes were evaluated in a commercial panel of cDNA prostatic clinical samples (TissueScan™ Prostate Cancer qRT-PCR Array/HPRT101; Origene Technologies). The cDNA panel comprised 39 samples covering 6 normal, 23 BPH and 10 cancer tissues. A significant difference was identified in the expression levels of FMOD between normal tissue and PCa tissue (p = 0.0363) and between BPH tissue and PCa tissue (p = 0.0480) (Fig. 1A). Analysis of KLK3/PSA transcript expression in the same array panel allowed us to determine that its expression levels were also significantly higher in the PCa group than in the groups of samples both of normal tissue (p = 0.0280) and of BPH tissue (p = 0.01349) (Fig. 1B).
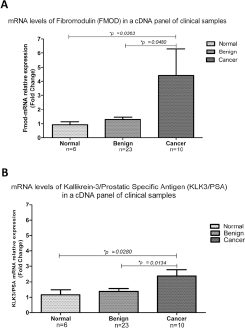
Relative mRNA levels of FMOD and KLK3/PSA in a cDNA panel derived from 39 patients. Reverse transcriptase quantitative polymerase chain reaction (RT-qPCR) analysis revealed an increase in FMOD (
FMOD and KLK3/PSA Transcript Expression in Human Prostate Tissue Biopsies
To further study the expression of FMOD in malignant vs. benign prostate tissues, qPCR was performed in biopsies from patients diagnosed either with PCa or BPH. When patients were grouped into PCa and BPH categories, expression levels of FMOD were significantly higher in the group of PCa patients than in the group of BPH patients (Tab. III; Fig. 2A) (p = 0.0282; unpaired t-test with Welch's correction). Thus, FMOD transcript levels were differentially expressed between PCa and BPH patients. Analysis of KLK3/PSA transcript expression in the same prostate tissue specimens allowed us to determine that differences in the expression levels of KLK3/PSA were not significant between the PCa and BPH groups (p = 0.0638) (Tab. III; Fig. 2B) (p = 0.0638; unpaired t-test with Welch's correction).
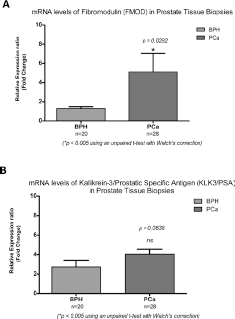
FMOD and KLK3/PSA transcript levels in prostatic tissue. Transcript levels for FMOD (
ROC Curve Analysis
Relative expression values of FMOD transcript in biopsies and clinical samples included in the cDNA panel were used to construct an ROC curve. Analysis of the FMOD ROC curve (Fig. 3) shows a moderate specificity (54.84%) but higher sensitivity (75.67%) at a cutoff set at 1.937 of relative expression. The area under the curve was 0.7538 (SE = 0.06553; 95% confidence interval, 0.6253-0.8822). The positive predictive value was 80% (24/30 patients), whereas the negative predictive value was 54.8% (17/31 patients).
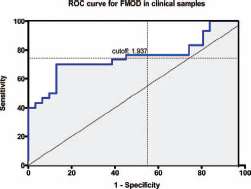
Receiver operator characteristic (ROC) curve for FMOD expression in clinical samples. ROC curve for FMOD expression (blue); area under the curve: 0.7538; n = 61; positive (prostate carcinoma [PCa]) 30 patients, negative (benign prostatic hyperplasia [BPH]) 31 patients. With a cutoff of 1.937, the relative FMOD-mRNA expression had a sensitivity (detection of malignant samples) of 75.67% and a specificity (detection of benign samples) of 54.84%.
DNA Sequencing of FMOD Transcript from Prostatic Cell Lines
An 864-bp fragment of the FMOD gene was amplified from cDNA prepared from each of the prostate cell lines, and the human normal dermal fibroblast cell line PCS-201-012 used as a positive control for FMOD expression. Subsequent DNA sequencing of the amplified fragments was carried out. BLAST analysis of the amplified DNA sequences matched with the published human cDNA sequence for FMOD transcript variant 1 (GenBank reference NM_002023), thus confirming that FMOD transcript was indeed expressed by the human PCa cell lines in culture.
Discussion
The exact molecular mechanisms by which PCa progresses from an androgen-dependent stage to a metastatic phenotype are not fully understood, and this remains an active area of research in PCa. In this study, we evaluated the transcript expression of a group of genes in the PCa cell lines LNCaP and PC-3, with the object of identifying genes associated with different cancer phenotypes, which could serve as potential biomarkers for PCa. Among the genes relevant to an aggressive metastatic phenotype identified in this study were CAV1, CD24, ESM-1 and F2RL1, found overexpressed only by the aggressive PC-3 cells, with CAV1 and ESM-1 undetected in the low aggressive LNCaP cells. Of these genes, CAV1 (16, 17) and CD24 (18-19-20) have been previously associated with metastasis of PCa in published articles; thus they were validated in our study. CAV1 encodes the protein caveolin-1 implicated in multiple cellular functions including molecular trafficking, cell adhesion and signal transduction, as well as in the development of PCa (21); it has also been detected in blood, where its level has a significant value for diagnosis and prognosis of PCa (22). CD24 encodes a cell surface glycosyl phosphatidylinositol-linked sialoglycoprotein, considered a cancer stem cell surface marker (23). CD24 has been recently associated with metastasis in various cancer types (24, 25), including PCa (18, 19), and its overexpression has been suggested as a predictor of relapse and poor outcome in this cancer (20).
Among the genes that have not been previously associated with metastatic PCa, we found that the most overexpressed in the PC-3 cell line was endothelial cell-specific molecule 1 (ESM-1), also known as endocan, whose gene product can regulate adhesion of circulating cancer cells to the endothelial vasculature, an essential process for invasion. In addition, ESM-1 can interact with several angiogenic growth factors, regulating their activities and enhancing metastatic abilities (26, 27); thus, endocan represents an interesting marker to evaluate in association with disease prognosis, as has been reported for hepatocellular carcinoma (28), or may represent a potential parameter for monitoring tumor response to antiangiogenic therapy, as has been observed in renal cancer (29).
Another gene transcript, F2RL1, overexpressed in the PC-3 cell line, is a member of the large family of 7-transmembrane-region receptors that couple to guanosine-nucleotide-binding proteins, and it has been shown to be associated with new blood vessel formation during retinal development and in ischemic retinopathy (30). However, there is no information regarding the involvement of this gene in PCa. Thus, it may represent a novel candidate biomarker gene for PCa.
Gene transcripts that were overexpressed in both cell lines included CD81, CXXC5, KBTBD10 and FMOD. CD81 is a member of the tetraspanin family, a large group of ubiquitously expressed membrane proteins that contain 4 transmembrane domains, short N- and C-terminal cytoplasmic domains, 2 extracellular loops and a small intracellular loop (31). Tetraspanin proteins are implicated in a broad range of physiological processes as well as in pathological conditions such as cancer invasion and metastasis (32, 33). CD81 transcript has been previously shown to be expressed by LNCaP and PC-3 cells, and the protein has been identified in the cell membrane in these 2 cell types, thus confirming our quantitative PCR results (34). Recent studies have shown that CD81 functions as a positive regulator for cell motility in breast cancer and melanoma cells (35, 36). However, there are no current reports addressing the role of CD81 in PCa.
In similar fashion, there is no published information about the expression in the prostate of CXXC5 and KBTBD10, also overexpressed by PC-3 cells. The CXXC5 gene encodes a transcriptional activator with a zinc-finger domain localized to the 5q31.3 chromosomal region, which has been recently found overexpressed in metastatic melanomas and in breast and thyroid cancers (37). kelch repeat 1 (KBTBD10), which has not been previously associated with PCa, encodes a protein that is overexpressed in transformed rat fibroblasts, which induces the formation of elongated pseudopods, which represent structures required for cell motility and invasion, features involved in the metastatic process (38, 39).
One gene that was expressed at increased levels in both cancer cell lines was FMOD, a member of the family of small leucine-rich proteoglycans (SLRPs), normally produced in collagen rich tissues (40). SLRPs are important components of the extracellular matrix and they are required for tissue maintenance (41). In many cancer types, the altered expression of one or more SLRP, such as fibromodulin, decorin, biglycan, among others, has been suggested as relevant for disease diagnosis and/or prognosis (42). For decorin (DCN), its role as antiproliferative molecule has been observed in PCa (43), where it induces a mechanism of tumor repression through the down-regulation of the epidermal growth factor receptor (EGFR), which leads to caspase-3 activation and subsequent apoptosis (44). In addition, it has been shown that expression of decorin, as well as other proteoglycans such as biglycan, is frequently repressed in cancer cells, existing an inverse correlation between cancer growth and expression of SLRPs (45). Accordingly, in this study, we found lower expression of DCN in the metastatic cell lines compared with the nontumorigenic cell line.
In contrast, the high expression of FMOD transcript by LNCaP and PC-3 cells, compared with the nontumorigenic PWR-1E cells, suggests that this proteoglycan may serve as a biomarker gene for metastatic potential. It has been recently shown that fibromodulin, along with other members of the SLRP family of proteoglycans, are not only involved in collagen fibrillogenesis and cell adhesion, but also contribute to modulate the activity of transcription factors, suppression of tumor growth and apoptosis prevention (42, 46). Overexpression of FMOD transcript was reported in B-cell chronic lymphocytic leukemia (CLL-B), and it has been suggested as a target for therapeutic intervention in this disease (9, 47, 48).
Overall, the results of this study provide support that prostatic cell lines may be useful models for studying the biological effects of differential gene expression in a controlled and easily manipulated in vitro system, as has been shown before (49, 50). Some of the genes that we identified as differentially expressed in this study deserve further investigation, to determine whether they represent novel biomarkers for this disease. In the case of FMOD, it has not been previously associated with the pathogenesis of PCa or other solid tumors (49). We have previously reported the overexpression of transcripts for this gene in PCa cells from rat origin (6), and in this study we evaluated its expression in human PCa cell lines and clinical samples. We report a significant elevation of tissue FMOD mRNA expression in PCa patients compared with patients with a benign histology. Thus, FMOD holds the potential to discriminate between normal or benign tissue and PCa. Although the sensitivity (correctly detected cancer patients) found in our series (75.67%) can be regarded as acceptable, the 54.84% moderate specificity (correctly detected patients without cancer) may prevent FMOD transcript from replacing or even supplementing other pathological procedures. Since our sample population was small, further studies are needed in a larger cohort of samples to determine the real usefulness of FMOD as a histology biomarker for PCa.
Since FMOD encodes a secreted proteoglycan which may be detectable in other body fluids, such as prostatic secretions, urine or blood, it would be interesting to determine whether expression of FMOD at the protein level is able to differentiate PCa patients from patients with benign disease. Our results point out the importance of continuing the validation of FMOD, both at the transcript and at the protein level (in serum and urine). Validation will require the use of a larger cohort of patients, to define the real value of FMOD as a biomarker for PCa. We are currently working toward this end.
Footnotes
Financial support: This work was financially supported by the Administrative Department of Science, Technology and Innovation/COLCIENCIAS (grant #1107-459-21483, contract #462-2008), and University of Cartagena grants #1673-2008 and #4682-2011 awarded to Niradiz Reyes as principal investigator, head of the Genetics and Molecular Biology Research group.
Conflicts of interest: The authors declare that they have no competing interests.