
Abstract
Purpose
To provide information about the role of microRNAs in the pathogenesis of renal cell carcinoma (RCC) and their diagnostic and prognostic utility as cancer biomarkers.
Methods
A literature search was performed in the PubMed and Web of Science databases using the keywords “renal cancer/renal cell carcinoma/kidney cancer” and “miR*/miRNA*/microRNA*”. Articles dealing with the role of miRNAs in the pathogenesis of RCC, diagnostic miRNAs and prognostic miRNAs were separated.
Results
MiRNAs act both as oncogenes and tumor suppressors. They regulate apoptosis, cell growth, migration, invasion, proliferation, colony formation and angiogenesis through target proteins involved in several signaling pathways, and they are involved in key pathogenetic mechanisms such as hypoxia (HIF/VHL dependent) and epithelial-to-mesenchymal transition. Differentially expressed miRNAs can discriminate either tumor tissue from healthy renal tissue or different RCC subtypes. Circulating miRNAs are promissing as diagnostic biomarkers of RCC. Information about urinary miRNAs associated with RCC is sparse. Detection of a relapse is another implication of diagnostic miRNAs. The expression profiles of several miRNAs correlate with the prognosis of RCC patients. Comparison between primary tumor tissue and metastasis may help identify high-risk primary tumors. Finally, response to target therapy can be estimated thanks to differences in miRNA expression in tissue and serum of therapy-resistant versus therapy-sensitive patients.
Conclusions
Our understanding of the role of microRNAs in RCC pathogenesis has been increasing dramatically. Identification and validation of their gene targets may have direct impact on developing microRNA-based anticancer therapy. Several microRNAs can serve as diagnostic and prognostic biomarkers.
Introduction
Renal cell carcinoma (RCC) accounts for 2%-3% of all malignant tumors (1). Despite a steady increase in relative survival, it is still one of the most lethal urological malignancies, with 5-year relative survival 71.8% (2). At the time of diagnosis, 17% of tumors are locally advanced and 17% are metastatic, with 5-year relative survival rates of 64.2% and 12.3%, respectively (2). Biomarkers for early detection, prognosis and follow-up of RCC are needed as there is no reliable diagnostic modality other than radiological imaging.
MicroRNAs are short noncoding single-strand RNAs that regulate gene expression at the posttranscriptional level by binding to their target messenger RNA (mRNA) and causing mRNA inhibition and/or degradation (3). They have been shown to be involved in a number of critical biological processes including cell development, differentiation and apoptosis. They can have oncogenic or tumor suppressor effects by inhibiting the protein production of their tumor suppressor or oncogenic targets, respectively (4). Different miRNA expression has been associated with many human cancers including RCC (5). Every miRNA has numerous potential targets and multiple miRNAs may target the same mRNA. Because of the increasing interest in miRNAs as potential cancer biomarkers, we aimed to provide an up-to-date review on the role of miRNAs in the pathogenesis of RCC with emphasis to their diagnostic and prognostic attributes.
Methodology
A thorough literature search was performed in the PubMed and Web of Science databases using the keywords “renal cancer/renal cell carcinoma/kidney cancer” and “miR*/miRNA*/microRNA*”; the search was restricted to articles published between 2004 and 2015. A total of 258 articles were found dating from 2008 (first relevant paper) to 2015 (April). During the first selection, all abstracts were reviewed and articles were excluded according to previously selected exclusion criteria: animal models, diagnostic/prognostic significance not proven, no abstract available, meeting abstracts, review articles, editorials or comments, articles ahead of print. After removing duplicates and performing the selection, 135 articles were analyzed (81, 30 and 33 discussing pathogenesis, diagnostic and prognostic miRNAs, respectively – some of them overlapping). The final selection omitted 27 articles that were considered irrelevant by the first author (did not provide additional information or could be confusing to the reader). The remaining 108 articles were summarized for the review (Fig. 1).
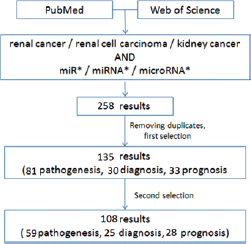
Workflow of evidence acquisition.
Results
MiRNAs in the Pathogenesis of RCC
MiRNAs Related to Hypoxia and VHL/HIF Pathway
Inactivation of the VHL gene is a typical sign of clear-cell RCC (ccRCC); it is responsible for virtually all familial ccRCC and two-thirds of sporadic ccRCC (6). VHL mutation and loss of its product, VHL protein, leads to unregulated expression of HIF-1α and HIF-2α, with subsequent induction of tumorigenic target proteins including VEGF, PDGF, TGFα and Glut 1 (7). VHL-dependent regulation has been observed in several miRNAs (miR-210, miR-155, let-7i, miR-8a) (8). MiR-210 is HIF-1 dependent (hypoxia induced), but some tumors without evidence of VHL inactivation also have elevated miR-210 levels, suggesting other mechanisms of HIF activation. In addition to HIF-1, HIF-2 can regulate miR-210 in the absence of HIF-1 (9). The association between miR-210 expression and patient survival indicates its influence on tumor behavior through alteration of gene expression rather than its role as a marker of tumor hypoxia only (8). MiR-210 targets iron-sulfur cluster protein (ISCU1,2) which is involved in the mitochondrial electron transport chain as a potential mechanism for regulating the anaerobic pattern of respiration seen in tumors. MiR-210 also stimulates cell migration and the invasive potential of RCC cells, as shown by silencing of miR-210 expression (10). A strong inverse correlation between miR-92a and VHL mRNA levels was found, indicating an alternative mechanism of VHL gene inactivation (11). MiR-138 inhibits the expression of HIF-1α in ccRCC cells, leading to increased apoptosis and reduced migration of tumor cells (12). The VHL and HIF-1α genes are likely direct targets of miR-17-5p and miR-224 (13).
There is a strong anti-correlation between the miR-200 family (miR-200a/200b/200c/429/141) and VEGF, suggesting regulation of HIF and its downstream targets by these miRNAs. Loss of this regulation may be responsible for activation of the HIF pathway (14). Proline oxidase (a mitochondrial tumor suppressor) acts through generation of reactive oxygen species and decreased HIF signaling. Overexpression of miR-23b downregulates the suppressor, and miR-23b can therefore function as an oncogene in renal cancer (15).
MiRNAs and Epithelial-to-Mesenchymal Transition (EMT)
EMT increases the invasive and metastatic potential of epithelial cells. Decreased E-cadherin (through its repressors ZEB1 and ZEB2) and increased expression of vimentin lead to loss of adhesion and increased motility of tumor cells. Modulating EMT by the miR-200 family has been consistently described both in primary RCC and metastasis of RCC (16, 17). The possible target is ZEB1, which promotes tumor invasion and migration through E-cadherin silencing. Additionally, miR-141 targets cell division cycle (CDC) 25 phosphatases, important regulators of the cell cycle. Its loss facilitates genomic instability at an early stage of RCC development (18). However, modulating the EphA2/p-FAK/p-Akt/MMP2/9 signaling cascade seems to be crucial for miR-141 tumor-suppressive activity (19). Upregulation of miR-141 with subsequent EMT reversal could explain the anticancer effect of honokiol (isolated from Magnolia spp. bark) on RCC cell metastasis, suggesting a possible therapeutic strategy (20).
MiR-215 is one of the most downregulated miRNAs in metastatic RCC when compared to primary RCC. Its target (SIP1/ZEB2) has been shown to be involved in EMT. Transfection of kidney cancer cells with miR-215 decreases cell migration and affects cell proliferation (21). The E-cadherin regulators ZEB2 and BMI1 (together with the inhibitor of apoptosis survivin) are possible targets of the suppressor miR-708. Its restoration in RCC cell lines decreases cell growth, clonability, invasion and migration and increases apoptosis primarily through survivin regulation (22). EMT is promoted by hypoxia-induced downregulation of miR30-c, too (23). Restoration of miR-138 in RCC cell lines leads to decreased vimentin expression at both the mRNA and protein levels, with significant inhibition of cell migration and invasion activities (24). EZH2 is another target oncogene of miR-138, inducing cell senescence of renal cancer cells (25).
MiRNAs and Proliferation, Invasion, Apoptosis and Angiogenesis
MiR-21 directly targets genes involved in the cell adhesion pathway, leading to degradation of intra- and extracellular matrix and abnormal cell growth patterns (14). Its key role in regulating cell apoptosis results from targeting multiple apoptosis-related genes including TIMP3, FASL and PDCD4 (26). Knockdown of miR-21 activates the caspase pathway and induces cell apoptosis in RCC (27). Aberrantly expressed miR-21 also regulates cell invasion through the TCF-21-KISS1 pathway. Anti-miR-21 upregulates KISS1 protein, with a subsequent decrease in cell invasion ability (28). Another pathogenetic mechanism of miR-21 function is presented by Akt kinase/TORC1 activation through posttranscriptional regulation of PTEN, resulting in increased cancer cell proliferation and migration (29). Finally, miR-21 controls the expression of cyclin D1 through NF kappa B-dependent transcription (30).
Expression of miR-155 is upregulated in RCC and miR-155 may function as an oncogene. Its suppression inhibits cell proliferation and migratory activity and induces apoptosis in renal cancer cells. Potential target genes are the suppressor genes SOCS-1 and BACH1 (31).
Oncogenic miR-23b-3p directly targets PTEN. Inhibition of miR-23b-3p induces PTEN gene expression with a concomitant reduction of PI3-kinase, total Akt and IL-32, and lower miR-23b-3p may be associated with better prognosis (32). The effect of overexpressed miR-17-92 cluster (miR-17-5p and miR-20a) on tumor cell proliferation was studied in primary and metastatic RCC cell lines. Its oncogenic effect may be explained by collaboration with the MYC oncogene, inhibition of PTEN or driving a proliferative signal by ectopic expression of the single miR-17-5p (33). Growth, invasion and migration of RCC cells are significantly increased after miR-122 transfection (34). Inhibition of endogenous miR-183 (upregulated in RCC tissues) suppresses cell proliferation, colony formation, migration and invasion of RCC cell lines in vitro. MiR-183 directly targets a tumor suppressor, phosphatase 2A. Upregulated miR-183 increases cell growth and metastasis and suppresses caspase activity (35).
MiR-584 acts as a tumor suppressor and is downregulated in RCC cell lines. It decreases cell mobility and viability through inhibition of the ROCK-1 oncogene. ROCK-1 is activated by Rhoa A and is associated with cell invasion in different cancers. In ccRCC, higher ROCK-1 mRNA expression is associated with shorter survival (36).
MiR-205 inhibits the proto-oncogenic Src family of protein kinases. Overexpression of miR-205 in cancer cells leads to inhibition of proliferation and cell motility factor and activation of STAT3 (37). Another target of miR-205, ZEB2, indicates its role also in EMT (38). Other tumor suppressor miRNAs (miR-34a, miR-101, miR-199a, miR-1285, miR-1826, miR-187, miR-135a, miR-218, miR-143/145 cluster, miR-133b, miR-199a-3b) act through downregulation of different oncogenes including c-MYC, Notch1, EZH2, protein kinase GSK3 beta, TGM2, beta-catenin, MEK1, B7 homolog 3, caveolin-2, hexokinase-2, matrix metallopeptidase 9 and c-Met (39-40-41-42-43-44-45-46-47-48-49-50). Downregulation of tumor-suppressive miR-1 and miR-133a leads to upregulation of oncogenic transgelin-2, which enhances cell proliferation and invasion (51). Similarly, downregulation of miR-145 leads to upregulation of ADAM17, a metalloprotease that is overexpressed in many cancer types including RCC (52). Matrix metallopeptidase 11 and the oncogenes ANGPT2 and NEDD9 are other targets of miR-145 (53, 54). Transfection of RCC cell lines with miR-99a induced G1-phase arrest. Since the mammalian target of rapamycin (mTOR) was identified as a direct target of miR-99a, the tumor suppressive role of miR-99a may be mediated primarily through mTOR regulation (55). Glut1 production is directly regulated by miR-1291 through SLC2A1 (56). A relationship between miR-30a downregulation and increased tumor angiogenesis by targeting the DLL4 endothelial ligand has been observed (57). WEE1 protein kinase (a mitosis inhibitor) is a common target of miR-424 and miR-381. Its downregulation (caused by the synergistic effect of both miRNAs) leads to Cdc2 activation and subsequent inhibition of cell proliferation and mitosis and abrogated G2/M arrest (58). MiR-381 also increases the sensitivity of RCC cells to 5-FU chemotherapy (59).
The association of miRNAs with possible novel regulatory pathways (e.g., Yin Yang 1 activation by miR-34a downregulation) has been suggested recently (60).
An interesting (and yet not fully understood) feature of miRNAs is the capability of a single miRNA to serve either as a tumor suppressor or oncogene depending on the type of cancer. MiR-7, which has been described as a tumor suppressor in several human cancers, has been characterized as an oncogene in RCC (61).
Recently, an anticancer effect of the quercetin and hyperoside combination (QH) on RCC cells has been shown. Besides a decrease in transcription factor levels, inhibition of oncogenic miR-27a was observed. Transfection of cells with miR-27a partially reversed the effects of QH (62). The anticancer activity of metformin may be explained by increased expression of miR-26a, which inhibits cell proliferation through downregulation of Bcl-2 and cyclin-D and upregulation of PTEN (63). The most recent papers describe the tumor suppressor effect of miR-506, miR-377, miR-184 and miR-125a-5p (64-65-66-67).
Diagnostic miRNAs
Differential Expression of miRNAs in RCC and Nontumorous Renal Tissue
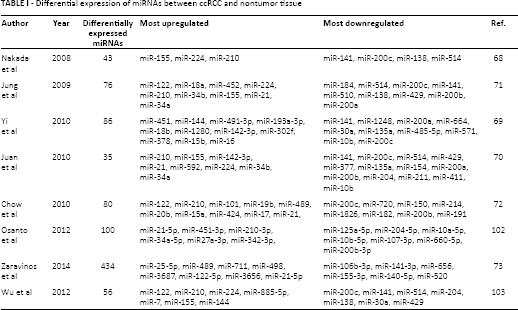
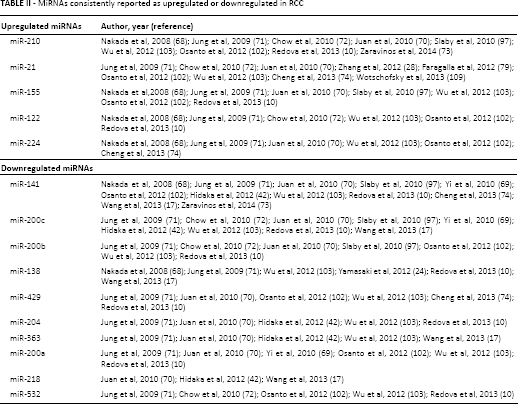
Many microRNAs are differentially expressed between RCC subtypes and normal kidney tissue (Tab. I). Using a platform of 470 miRNAs, Nakada et al (68) identified 43 miRNAs that were differentially expressed between ccRCC and normal kidney and 57 miRNAs that were differentially expressed between chromophobe RCC (chRCC) and normal kidney. MiR-141 and miR-200c were the most significantly downregulated miRNAs in ccRCC (68). Thirty-eight upregulated and 48 downregulated miRNAs in cancer tissue were detected in another study using a platform of 847 miRNAs in patients with ccRCC and healthy controls (69). Juan et al (70) found 26 downregulated and 9 upregulated miRNAs in ccRCC (including miR-21, miR-210 and miR-155, as commonly found in other cancers). Jung et al (71) identified 33 miRNAs with at least 2-fold change between ccRCC and nonmaligmant tissue. Chow et al (72) identified 80 differentially expressed miRNAs in ccRCC compared to normal tissue, 33 of them classified as a high signal group. MiR-122 and miR-200c were the most dysregulated. Zaravinos et al (73) examined miRNA expression profiles in ccRCC, a smaller cohort of papillary RCC (pRCC) and chRCC, and upper tract urothelial carcinoma versus normal kidney tissue. In ccRCC, miR-3648, miR-143-3p, miR-25-5p, miR-628-3p, miR-921 and miR-210 exhibited the best discriminatory ability versus normal kidney (73). In a study by Cheng et al (74), 8 miRNAs were selected for tissue and serum analysis. MiR-34a, miR-21 and miR-224 were significantly upregulated whereas miR-141, miR-149 and miR-429 were significantly downregulated. MiR-129-3p has been described as a promising diagnostic biomarker discriminating ccRCC tissues from normal tissues with 73.5% accuracy (75). Low miR-129-3p levels have been associated with short disease-free survival (DFS) and overall survival (OS). Analysis of dysregulated miRNAs and miRNA-mRNA dysregulation pairs may help identify disease-specific miRNAs. In a study by Hao et al (76), 5 potential biomarkers were identified (miR-425, miR-136, miR-340, miR-335 and miR-320d) (76). Table II summarizes up- and downregulated miRNAs that have been consistently reported among various studies.
Differential expression of miRNAs between ccRCC and nontumor tissue
MiRNAs consistently reported as upregulated or downregulated in RCC
MiRNA Expression in Different RCC Subtypes
MiRNA signatures can distinguish RCC subtypes (and also oncocytoma). In the study by Zaravinos et al (73), despite the small cohorts, very good discriminatory miRNAs (AUC >0.8, p<0.05) were also found in pRCC (miR-3687, miR-25-5p) and chRCC (miR-3687, miR-4284, miR-141-3p) versus controls. Youssef et al (77) developed a 4-step decision tree based on a group of miRNA pairs that – based on their different expression – can classify a sample as 1 of 2 possible outcomes. Table III shows the miRNA pairs in consecutive steps. The system has a sensitivity of 97% in distinguishing normal kidney from RCC, 100% for ccRCC, 97% for pRCC, and 100% accuracy in distinguishing oncocytoma from chRCC.
Four-step decision tree discriminating normal tissue, RCC subtypes and oncocytoma (77)
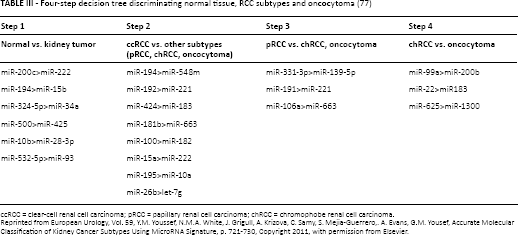
ccRCC = clear-cell renal cell carcinoma; pRCC = papillary renal cell carcinoma; chRCC = chromophobe renal cell carcinoma.
Reprinted from European Urology, Vol. 59, Y.M. Youssef, N.M.A. White, J. Grigull, A. Krizova, C. Samy, S. Mejia-Guerrero,. A. Evans, G.M. Yousef, Accurate Molecular Classification of Kidney Cancer Subtypes Using MicroRNA Signature, p. 721-730, Copyright 2011, with permission from Elsevier.
Petillo et al (78) focused on the comparison between the subtypes with the greatest genomic similarity (chRCC/oncocytoma, pRCC/ccRCC). Table IV summarizes both comparisons. Oncogenic miR-21 has different expression among RCC subtypes, with the highest levels being observed in ccRCC and pRCC. Its expression can distinguish ccRCC and pRCC from chRCC and oncocytoma with 90% specificity and 83% sensitivity (79). In a study by Wach et al (80) examining 9 selected miRNAs, the combination of miR-145, miR-210, miR-200c and miR-502-3p correctly discriminated between tumor and normal tissue (accuracy of 92.9%), the combination of miR-145 and miR-502-3p predicted the RCC entity correctly in 95% of patients (ccRCC vs. pRCC), and the combination of miR-210 and let-7c was able to correctly predict the pRCC subtype (pRCC1 vs. pRCC2) in 92.3%.
miRNAs discriminating ccRCC vs. pRCC and chRCC vs. oncocytoma (78)
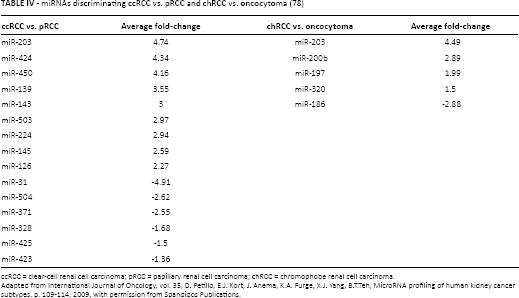
ccRCC = clear-cell renal cell carcinoma; pRCC = papillary renal cell carcinoma; chRCC = chromophobe renal cell carcinoma.
Adapted from International Journal of Oncology, vol. 35, D. Petillo, E.J. Kort, J. Anema, K.A. Furge, X.J. Yang, B.T.Teh, MicroRNA profiling of human kidney cancer subtypes, p. 109-114, 2009, with permission from Spandidos Publications.
Circulating miRNAs as Potential Biomarkers of RCC
Serum miR-210 has been investigated as a biomarker for the diagnosis and the detection of progression of ccRCC. A study involving 34 ccRCC patients and 23 healthy controls found significantly higher serum levels of miR-210 in the patient group, with an AUC of 0.77 and a sensitivity and specificity of 65% and 83%, respectively (81). No association between miR-210 levels and age, sex, tumor size or existence of metastasis was found in the study. In another study, serum miR-210 levels yielded an AUC of 0.874 with a sensitivity of 81% and a specificity of 79.4%. In 10 samples 1 week after surgery, the average serum level of miR-210 was significantly decreased (82). Wulfken et al (83) compared miRNA profiles in serum and tissue of RCC patients and identified 36 increased circulating miRNAs that were overexpressed in corresponding tumor tissues. Seven miRNAs were selected as diagnostic biomarkers (miR-106b, miR-1233, miR-1290, miR-210, miR-7-1, miR-320b and miR-93). The level of miR-1233 was significantly increased in patients with RCC, although the diagnostic information was below expectations (sensitivity 77%, specificity 37.6%, AUC 0.588) and benign tumors did not show different miR-1233 levels (83).
MiR-378 and miR-451 have been put forward as promising serum biomarkers in RCC by Redova et al (84). Combination of miR-378 and miR-451 in serum enabled the identification of RCC with a sensitivity of 81%, a specificity of 83%, and an AUC of 0.86. However, Hauser et al (85) did not confirm a different level of miR-378. Also, miR-378 was not correlated with pT-stage.
A significant difference in plasma levels of miR-508-3p was found in RCC patients compared with healthy controls (86). MiR-509-5p was downregulated both in RCC tissue and plasma of RCC patients (87). In a study by Cheng et al (74), miR-34a, miR-21 and miR-224 were significantly upregulated in the sera of patients with RCC (compared with patients having benign lesions), whereas miR-141 was downregulated (74). The serum levels of miR-21 significantly correlated with the stage of ccRCC. Teixeira et al (88) observed higher plasma levels of miR-221 and miR-222 in RCC patients. Patients having metastases presented higher circulating levels of miR-221 than patients with no metastases. A significantly shorter OS in patients with higher expression levels of miR-221 was observed (88).
Recently, Wang et al (89) introduced a panel of 5 serum miRNAs for the early detection of RCC, including miR-193a-3p, miR-362, miR-572, miR-28-5p and miR-378. The AUCs for the combination were 0.807 (training set) and 0.796 (validation set).
Urinary miRNAs as Potential Biomarkers of RCC
There is limited information about urinary miRNAs in RCC patients. Von Brandenstein et al (90) described miR-15a, which is related to protein kinase C alpha (PKCα), as being upregulated in benign oncocytoma but downregulated in RCC. PKCα is a component of a transcription complex in tumors; it directly binds to the primary transcript of miR-15a in the nucleus and suppresses miR-15a. Therefore, miR-15a is upregulated in RCC but downregulated in oncocytoma. The miR-15a urinary levels are high in patients with RCC but undetectable in oncocytoma or urinary tract infections (90).
MicroRNAs as Biomarkers of RCC Prognosis (Tab. V)
Better clinicopathological features have been reported with high miR-210 expression (lower stage and grade) (9). Based on miR-210 ccRCC tissue levels, patients were separated into 3 groups, and a better OS was observed in the high miR-210 group. Samaan et al (91) reported shorter OS and a greater chance of disease recurrence in patients with miR-210 overexpression; however, after adjusting for tumor size and TNM stage the statistically significant association was lost (91).
Suggested prognostic miRNAs in renal cell carcinoma
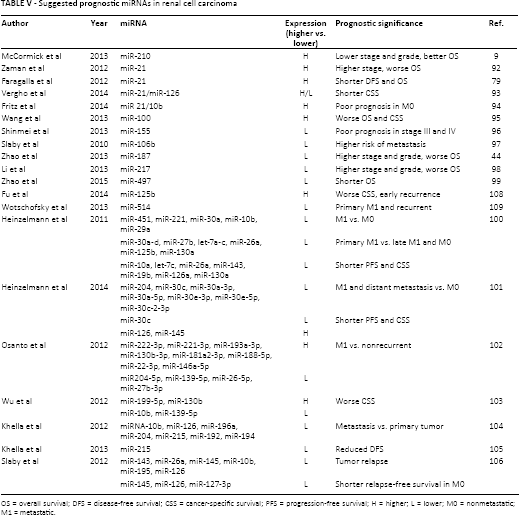
OS = overall survival; DFS = disease-free survival; CSS = cancer-specific survival; PFS = progression-free survival; H = higher; L = lower; M0 = nonmetastatic; M1 = metastatic.
A correlation was found between miR-21 expression and survival of RCC patients: all patients with low miR-21 expression survived 5 years, while only 50% of patients with high miR-21 expression survived. Higher expression of miR-21 was associated with more advanced stage of RCC (92). Significantly shorter DFS and OS in patients with high miR-21 expression was confirmed by another study involving 121 patients with different RCC subtypes (highest miR-21 in ccRCC and pRCC) (79). In a study by Vergho et al (93), a significant correlation of miR-21 upregulation and miR-126 downregulation with metastasis and cancer-specific survival (CSS) was found (93). The miR(21/10b) ratio has been shown to be an independent prognostic factor for M0 ccRCC. A high miR(21/10b) ratio was associated with poor prognosis, suggesting the need for stricter surveillance in high-risk M0 patients according to the miR(21/10b) ratio (94). High miR-100 expression in RCC tissue was identified as an independent poor prognostic marker of both OS and CSS (95). In patients with stage III and IV ccRCC, low expression levels of miR-155 correlated with poor prognosis (96). MiR-106b is significantly overexpressed in ccRCC tissue; however, its expression levels are significantly lower in tumors of patients who develop metastasis and miR-106b may be a potential predictive marker of early metastasis after nephrectomy (97). Lower expression of several tumor suppressive miRNAs is also associated with a worse prognosis (44, 98, 99).
Of 33 miRNAs discriminating metastatic and nonmetastatic ccRCC, miR-451, miR-221, miR-30a, miR-10b and miR-29a showed the most significant downregulation. Additionally, a group of 4 miRNAs (let-7a, let-7c, miR-26a, miR-30c) distinguished the course of the disease (primary metastatic, late metastatic, nonmetastatic). Low expression levels of miR-26a, miR-10a, miR-143, miR-19b and let-7c showed a strong correlation with poor progression-free survival (PFS) and CSS, (100). A similar study comparing primary metastatic ccRCC and distant ccRCC metastases versus nonmetastatic ccRCC showed 14 differently expressed miRNAs. Downregulated miR-30c and upregulated miR-126 and miR-451 showed a significant correlation with PFS and CSS (101). Osanto et al (102) found 12 miRNAs to be uniquely discriminating between a metastatic and a nonrecurrent subgroup of patients. According to the difference between the miRNA expression in metastatic and localized renal tumors, 4 miRNAs were chosen to build a metastatic tumor signature: miR-10b, miR-139-5p (downregulated), miR-130b and miR-199b-5p (upregulated) (103). The validation test showed that the signature appeared to be more powerful in identifying concurrent metastases (81%) than subsequent/future metastasis of the primary tumors (69%); however, 22 of 29 patients who had metastatic disease had high-risk primary tumors while 6 of 6 with no metastasis had low-risk tumors predicted by the signature (sensitivity 76%, specificity 100%). Another study of an independent set of 20 pairs of metastatic ccRCC and matched primary tumors from the same patients showed as the most significantly differentially expressed miRNAs miR-10b, miR-126, miR-196a, miR-204, miR-215, miR-192 and miR-194 (104). A further study of miR-215, miR-192 and miR-215 by the same authors found both a convergent effect (the same molecule can be targeted by several miRNAs) and a divergent effect (the same miRNA can control multiple targets). Lower expression of miR-215 was associated with significantly reduced DFS time (105).
For the detection of early relapse after nephrectomy, miR-143, miR-26a, miR-145, miR-10b, miR-195 and miR-126 were confirmed as being downregulated in RCC patients who developed tumor relapse. MiR-127-3p, miR-145 and miR-126 significantly correlated with relapse-free survival of nonmetastatic patients (106). Prolonged DFS for higher miR-126 levels and lower levels in metastatic tumors were confirmed in a recent study by Khella et al (107). High tumor miR-125b indicated poor survival and early recurrence after nephrectomy for patients with ccRCC, especially with advanced-stage disease (108).
MiR-122 (upregulated) and miR-514 (downregulated) were differently expressed between samples of nonmetastatic and metastatic ccRCC. The expression of miR-514 was particularly downregulated in primary metastatic tumors and those that recurred (109).
MiR-21, miR-126 and miR-221 can predict CSS in ccRCC patients after nephrectomy with thrombectomy in case of inferior vena cava thrombus (110).
MiRNAs as Biomarkers of Treatment Response
The microRNA signature in peripheral blood may stratify patients with advanced RCC according to their response to first-line treatment with sunitinib. Twenty-eight and 23 of 287 analyzed miRNAs were associated with poor response (progression before 6 months) or prolonged response (progression after 18 months), respectively (111). In the poor response model pre- and posttreatment levels of miR-192, miR-193a-3p and miR-501-3p were compared; the prolonged response model included pretreatment miR-410b and miR-1181c and miR-424c fold change.
In a study by Berkers et al (112), miR-141 downregulation-driven EMT in ccRCC was linked to an unfavorable response to sunitinib therapy. Reintroduction of miR-141 in vitro led to EMT reversal and increased sensitivity to a hypoxic environment.
Two groups of patients with metastatic RCC treated with sunitinib (marked sensitivity vs. resistance to sunitinib) were compared in a recent study by Prior et al (113). MiR-942, miR-628-5p, miR-133a and miR-484 were overexpressed in sunitinib-resistant patients. MiR-942 significantly discriminated between the 2 patient groups. Time to progression and OS were significantly reduced in patients with miR-942 expression above the mean. MiR-30a is a potent inhibitor of autophagy (which contributes to cancer resistance to treatment). Exogenous expression of miR-30a in RCC cells enhanced sorafenib-induced cytotoxicity, causing substantial cell apoptosis (114). MiR-200c could sensitize ccRCC cells to sorafenib and imatinib by targeting antiapoptotic heme oxygenase 1 (HO-1). A correlation was found between miR-200c and HO-1 levels and drug resistance (115).
Conclusion
MiRNAs are involved in various pathogenetic mechanisms of RCC development. Although some of them directly affect particular signaling pathways, the exact roles and gene targets of many differentially expressed miRNAs still have to be elucidated. The reverse effect of either knockdown or restoration of dysregulated miRNAs in vitro may herald the era of new therapeutic targets. Different expression of miRNAs in tumor tissue, serum/plasma and urine make miRNAs attractive biomarkers for diagnosis and follow-up; several studies have confirmed their consistent up- or downregulation in RCC. The use of a combination of miRNAs rather than a single miRNA is desirable to identify suitable biomarkers for clinical practice. MiRNA analysis of the primary tumor might be an important tool for individual prognosis prediction. Specific miRNA signatures in nonmetastatic, primary metastatic and recurrent RCC may predict the course of the disease. In the management of advanced RCC, the identification of treatment-sensitive versus resistant tumors could lead to tailored therapy.
Footnotes
Financial support: None.
Conflict of interest: The authors have nothing to disclose.