
Abstract
Purpose
Single nucleotide polymorphisms (SNPs) are an important cause of functional variation in proteins leading to tumorigenesis. We aimed to identify candidate biomarkers with polymorphisms in gastric cancer (GC).
Methods
The SNP microarray profile GSE29996 including 50 GC samples and 50 normal controls, and gene expression data GSE56807 consisting of 5 GC samples and 5 controls were downloaded from the Gene Expression Omnibus database. After preprocessing of raw data, GC-associated SNPs were identified using the Cochran-Armitage trend test, and differentially expressed genes (DEGs) were screened out using the limma package in R. Significant DEGs with risk associated SNP loci were screened using the Fisher combination test. Gene ontology function and pathway enrichment analyses were performed for DEGs with risk associated SNP loci by GenCLip online tool. Transcriptional regulatory analysis was also conducted for transcription factor and target DEGs.
Results
A total of 79 DEGs with risk associated SNP loci were identified from GC samples compared with normal controls. These DEGs were mainly enriched in anatomical structure development, including embryo development. Additionally, DEGs were significantly involved in the NO1 pathway, including actin, alpha 1, skeletal muscle (ACTA1). In the regulatory network, transcription factor forkhead box L1 (FOXL1) regulated 26 DEGs with risk associated SNP loci, including Iroquois homeobox 1 (IRX1) rs11134044, sex determining region Y (SRY)-box1 (SOX1) rs9549447 and msh homeobox 1 (MSX1) rs41451149.
Conclusions
IRX1, SOX1 and MSX1 with risk associated SNP loci may serve as candidate biomarkers for diagnosis and prognosis of GC.
Introduction
Gastric cancer (GC) is one of the most common human cancers and is the second leading cause of cancer-related death in the world (1). Approximately 738,000 people are subjected to the malignant tumor each year, but the 5-year survival rate in the United States is less than 15% (2). To date, no effective treatment is available for GC, and identification of early stage GC is difficult because this disease is biologically and genetically heterogeneous. Moreover, it is naturally resistant to many anticancer drugs, and surgical results following chemotherapy for patients with GC have been disappointing. To improve the effectiveness of therapy, an increasing number of studies have tried to identify new candidate cancer biomarkers, which would be important for diagnosis and prognosis of GC.
In tumor development, activation of oncogenes, inactivation of tumor suppressor genes and alteration of cell cycle regulators play a key role in tumorigenesis. Moreover, single nucleotide polymorphisms (SNPs) are an important cause contributing to functional variation in proteins and leading to tumorigenesis, including GC (3, 4). A previous report has shown that X-ray repair cross-complementing group 1 gene (XRCC1) variants c.910 A>G and c.1804 C>A are potentially associated with GC susceptibility in Chinese Han people (5). More recently, it has been shown that tumor protein 53 (TP53) gene is a tumor suppressor gene, and its inactivation is involved in GC development (6). As we know, TP53 is a cell-cycle checkpoint protein which plays a regulatory role in apoptosis and cell proliferation (7). Importantly, the TP53 Arg72Pro polymorphism is potentially related to increased risk of GC (8). Additionally, phospholipase C epsilon 1 gene rs2274223 A>G polymorphism has been demonstrated as a novel susceptibility biomarker for GC (9). Interestingly, DNA-methyltransferase (DNMT)-3A rs36012910 A>G polymorphism is associated with susceptibility to GC and might be a potential biomarker for prediction of GC (10). Although several biomarkers with a potential role in tumorigenesis have been detected with diagnostic and prognostic value in GC, there are very few molecular markers used in clinical application for GC treatment.
With the aim to find novel candidate biomarkers associated with cancer risk, we performed integration analysis of SNP and gene expression microarray profiles in GC samples compared with normal control. Differentially expressed genes (DEGs) with risk associated SNP loci were identified from GC samples, and gene ontology (GO) function and pathway enrichment analyses of these DEGs were conducted. Finally, a transcriptional regulatory network was constructed for DEGs with risk associated SNP loci and target genes.
Materials and methods
Microarray Data
The SNP array data for GSE29996 (11) containing 50 GC samples and 50 normal controls were downloaded from the Gene Expression Omnibus (GEO; http://www.ncbi.nlm.nih.gov/geo/) database, which is based on the GPL6801 ([Genome Wide SNP_6] Affymetrix Genome-Wide Human SNP 6.0 Array). Gene expression microarray data GSE56807 (12) including 5 GC samples and 5 normal controls were obtained from GEO database, which is based on the platform of GPL5175 ([HuEx-1_0-st] Affymetrix Human Exon 1.0 ST Array [transcript (gene) version]).
Data Preprocessing
Quality control analysis for SNP raw data was performed based on the criteria of SNPs and samples both with call rates more than 80%. The genotyping of SNPs with call rates more than 80% was used for further data analysis.
Gene expression raw data were preprocessed as follows: probe sets redefinition and normalization. Probe ID was converted to gene symbol using annotation information, and replicate probes for 1 gene were summarized by mean value. For both GC sample and control, missing values were imputed using the K-nearest neighbor averaging method within impute package in R language (available at http://bioconductor.org/packages/release/bioc/html/impute.html) (13). Log 2-transformed expression intensity was normalized by quantile normalization in R preprocessCore package (available at http://bioconductor.org/packages/release/bioc/html/preprocessCore.html) (14). The normalized result was shown in a box plot (Fig. 1).
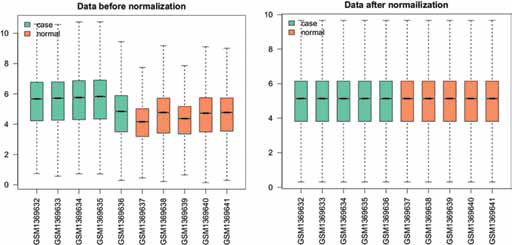
Data normalization: the green boxes represent the expression values of the gastric cancer samples, and the orange boxes represent the expression values of the normal controls.
Genome-wide Association Study of SNPs in GC
To study the association between SNPs and GC, genome-wide association analysis was performed with the use of the Cochran-Armitage trend test via PLINK software (available at http://pngu.mgh.harvard.edu/~purcell/plink/) (15). SNPs with a p value less than 0.05 were considered as predictive risk associated SNPs. The global view of p values for all predictive risk associated SNPs was shown with a Manhattan plot using the Gap package in R (16). Because some genes are larger than others and may receive more SNPs, a minimum-SNP algorithm was used to select SNPs with a minimum p value as SNP loci of the genes. Finally, the accession number of probes was converted to a gene symbol using the ID Converter tool (17).
Identification of DEGs in GC
To identify critical genes in GC development, DEGs were detected using the limma package in R (available at http://www.bioconductor.org/packages/release/bioc/html/limma.html) (18) comparing the expression profile between GC samples and normal control. The p values were adjusted using the Bonferroni-Hochberg algorithm. Genes were considered to be differentially expressed in GC if |log 2 fold change (FC)| was >1 and adjusted p value was <0.01.
Integration Analysis of Cancer-Related SNPs and DEGs
To further study critical genes in GC, we selected common genes between genes with risk associated SNPs and significant DEGs. The p values from the 2 tests were combined for DEGs with SNP loci which were calculated by Fisher combination test (19), using the formula as follows: χ2 = −2Σ2i = 1 ln(pi). In the formula, p1 represents the p value calculated in SNP genotyping and p2 is the p value calculated in identification of DEGs. Moreover, −2 ln pi has a chi-square distribution with 4 degrees of freedom, and p values were calculated using distr package (available at http://distr.r-forge.r-project.org/) (20). The common genes with p values less than 0.05 were considered as key genes in GC.
Functional Annotation of DEGs with SNP Locus
To study the functions of DEGs with SNP locus, GO function and pathway enrichment analysis were performed using the GenCLip online tool (available at http://ci.smu.edu.cn/GenCLiP2.0/analysis.php) (21). The cutoffs were p value <0.05 and q value <0.05. The enrichment network of GO terms was visualized using Cytoscape software (http://cytoscape.org/) (22).
Construction of transcriptional regulatory network
To search transcription factor (TF) binding sites of DEGs with SNP locus, we applied the TRANSFAC database (http://www.gene-regulation.com/pub/databases.html) (23) and University of California Santa Cruz (UCSC) genome database (http://genome.ucsc.edu/) (24). A transcriptional regulatory network was constructed based on gene expression profile and regulatory relationships using Cytoscape software (22) according to the regulatory interaction and the differential expression values of each TF and DEGs with SNP locus.
Results
Results of data preprocessing
After normalization of gene expression profile, expression values of 17,786 genes in 10 samples were obtained, which are shown in the box plot in Figure 1. In addition, we obtained 86,8261 SNPs in 100 samples based on SNP microarray annotation information.
Identification of DEGs and genes with risk associated SNP locus
By applying statistical analysis, a total of 1,990 DEGs were screened out between GC samples and normal controls, including 1,695 up-regulated and 295 down-regulated genes. To search for GC-associated SNP loci, we applied the Cochran-Armitage trend test for SNPs and found that 686 SNP loci were associated with GC. Moreover, the SNPs obtained were annotated on genes, and 81 genes with risk associated SNP loci were identified based on the minimum algorithm.
Identification of DEGs with risk associated SNP loci
After integration analysis between genes with risk associated SNP locus and DEGs in the gene expression profile, we obtained common genes (DEGs with risk associated SNP locus) as key genes in GC. According to the criteria of combined p value less than 0.05 as calculated with the Fisher combined test, we selected 79 DEGs with risk associated SNP loci in GC samples, including 13 up-regulated and 66 down-regulated genes. The top 10 DEGs with risk associated SNP loci are listed in Table I.
Top 10 differentially expressed genes (DEGs) with single nucleotide polymorphism (SNP) locus in gastric cancer
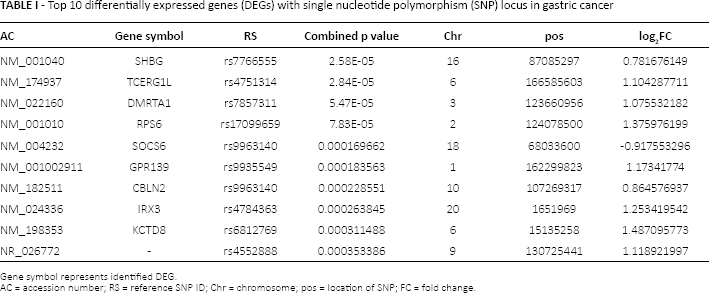
Gene symbol represents identified DEG.
AC = accession number; RS = reference SNP ID; Chr = chromosome; pos = location of SNP; FC = fold change.
Functional annotation of DEGs with risk associated SNP
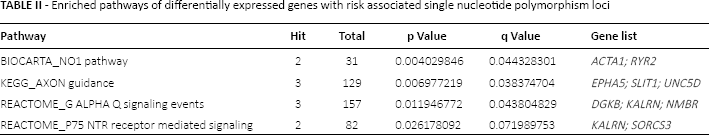
To study the function of DEGs with risk associated SNP loci, the GenClip 2.0 tool was applied, and 46 of 79 DEGs were classified into 2 gene clusters involved in functions of the central nervous system and DNA methylation. Additionally, according to the criterion of p value less than 0.05, 79 DEGs with risk associated SNP were significantly enriched in 21 GO terms. Based on the number of common genes in enriched GO terms, an enrichment network was also constructed (Fig. 2). In the network, the DEGs related to anatomical structure development were closely associated with DEGs in other GO terms. Moreover, a total of 79 DEGs were mainly enriched in 4 pathways (Tab. II), including the nitric oxide (NO) pathway, axon guidance pathway, G alpha (q) signaling events and p75 NTR receptor–mediated signaling pathway.
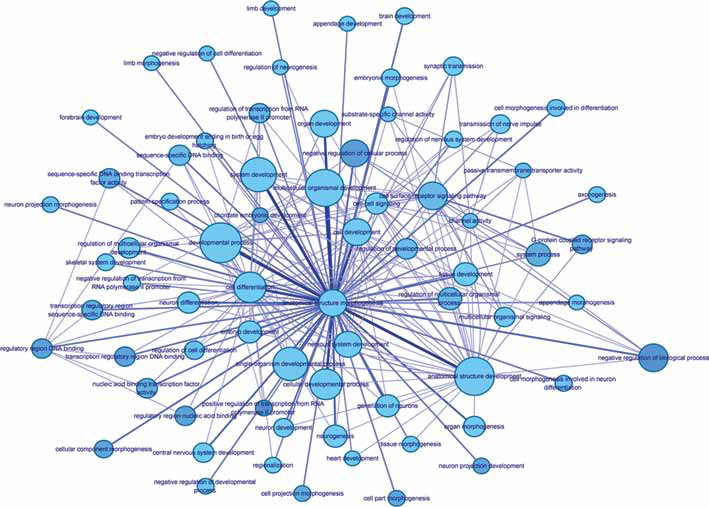
Enrichment network of gene ontology functions of differentially expressed genes with single nucleotide polymorphism loci. Nodes represent enriched function. The size of nodes is proportional to the number of genes involved in enriched terms. The shade of the nodes is proportional to the p value. The edge connecting two nodes represents that there are common genes in enriched terms. The thickness and shade of connecting lines are proportional to the number of common genes.
Enriched pathways of differentially expressed genes with risk associated single nucleotide polymorphism loci
Transcriptional regulatory network of TFs and target DEGs
To identify GC-associated TFs and their potential target genes, transcriptional regulatory database TRANSFAC and UCSC target gene database data were applied to understand the comprehensive gene regulations at the level of transcriptional regulation. Thus, we identified 8 TFs regulating 79 DEGs with risk associated SNPs, including Iroquois homeobox 1 (IRX1), T, sex determining region Y (SRY)-box1 (SOX1), SRY-box11 (SOX11), forkhead box L1 (FOXL1), POU class 4 homeobox 1 (POU4F1), even-skipped homeobox 1 (EVX1) and msh homeobox 1 (MSX1). Target genes of GC-associated TFs were screened from the UCSC database, and a regulatory network of TF FOXL1 and targets was constructed (Fig. 3). In the network, FOXL1 regulated 26 target DEGs which were up-regulated in GC samples compared with normal controls, including actin, alpha 1, skeletal muscle (ACTA1) gene, IRX1, SOX1, SOX11, MSX1 and EVX1.
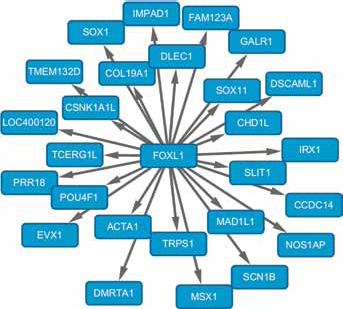
The transcriptional regulatory network of FOXL1 and its target genes. The nodes represent target genes.
Discussion
GC is a very serious disease, but the precise underlying pathogenesis remains to be defined. To identify candidate biomarkers for diagnosis and prognosis of GC, we performed integration analysis of SNP and gene expression microarray profiles. A total of 79 DEGs with risk associated SNP loci were screened from GC samples compared with normal controls. Functional annotation showed that these genes were significantly enriched in anatomical structure development. Combined with transcriptional regulatory analysis, we found that 8 TFs were involved in GC regulation, and FOXL1 regulated 26 DEGs with risk associated SNP locus, including IRX1 rs11134044, SOX1 rs9549447, SOX11 rs4268937, EVX1 rs10951156, MSX1 rs41451149 and ACTA1 rs875630.
FOXL1, an evolutionary conserved transcriptional regulator, is characterized by the presence of a DNA-binding domain forkhead box (25). A growing body of evidence has indicated that FOXM1 plays an important role in maintenance of homeostasis between apoptosis and cell proliferation (26). More recently, it has been shown that overexpression of FOXL1 is associated with carcinogenesis, including lung cancer (27), prostate cancer (28) and breast cancer (29). Furthermore, FOXL1b expression has been shown to serve as an independent predictor of poor survival in GC (30). Accordingly, FOXL1 may play an important role in tumorigenesis through regulating apoptosis and cell proliferation.
From the transcriptional regulation results, MSX1, SOX1, IRX1 and another 23 DEGs with SNP loci were regulated by FOXL1. Functional annotation of these DEGs showed that MSX1, SOX1 and IRX1 were significantly enriched in embryo development-related functions. MSX1 is a homeobox gene and functions as a transcriptional regulator in the developmental process. Its product has been found to regulate cell growth, differentiation, proliferation and apoptosis during vertebrate embryogenesis (31). Recent findings suggest that MSX1 interacts with p53 and inhibits tumor growth via the induction of apoptosis (32). Moreover, SNPs in the microRNA-binding site of MSX1 play a vital role in development of nonsyndromic orofacial clefts (NSOCs), and MSX1 polymorphisms may be regarded as potential biomarkers for the evaluation of infants’ risk of NSOCs (33). As a result, MSX1 carrying the rs41451149 polymorphism may participate in development of GC.
SOX1 is a member of the sex-determining region Y (SRY)-box family which plays a critical role during embryonic development (34). Emerging evidence has shown that SOX1 may function as a tumor suppressor by inhibiting cell growth and invasion through interfering with Wnt/β-catenin signaling in hepatocellular carcinoma (35) and cervical cancer (36). Disappointingly, any association between SOX1 polymorphisms and GC has rarely been reported in previous studies. However, we found significantly differential expression of SOX1 rs9549447 in GC samples. Thus, SOX1 might be an important gene in regulating tumorigenesis.
In addition, IRX1 is a tumor suppressor gene which is located on a cancer susceptibility locus and belongs to the Iroquois homeobox gene family. In a previous study, IRX1 was significantly down-regulated in GC via promoter methylation in the development of carcinogenesis (37). Its tumor-suppressing functions, such as inhibition of tumor growth and invasion of GC, have been confirmed in several reports (38). Importantly, loss of heterozygosity, 1 type of genetic variation, in IRX1 is highly presented in GC (37). Thus, IRX1 rs11134044 might be associated with development of GC. In addition, ACTA1 has been shown to be involved in buccal cancer (39) and nemaline myopathy (40). Interestingly, mutations in ACTA1 including ACTA1-L94P and ACTA1-G259V can cause severe recessive myopathy (40). Moreover, pathway enrichment analysis indicated that ACTA1 was mainly involved in the NO1 pathway. Thus, NO production is reported to increase because inducible NO synthetase is overexpressed in gastric adenocarcinoma (41). Accordingly, ACTA1 rs875630 may be associated with GC through the NO1 pathway. However, the absence of validation of these results by experiments is a major limitation in the preliminary study.
In summary, integrating SNP with gene expression profiles identified 79 DEGs with risk associated SNP locus in GC samples compared with normal control. There were 26 DEGs regulated by TF FOXL1, including IRX1 rs11134044, SOX1 rs9549447 and MSX1 rs41451149. The 3 genes with risk associated SNP loci may be associated with GC development and have potential to be used as candidate biomarkers for diagnosis and prognosis of GC. However, the results need to be confirmed by experiments such as with RT-PCR and in clinical applications in future.
Footnotes
Financial support: No grants or funding have been received for this study.
Conflict of interest: All authors declare that they have no conflict of interest to state.