
Abstract
Aims
We developed an outcomes model to select patients for renal cell cancer vaccine immunotherapy.
Materials and methods
We examined clinical data from 2 phase II studies of modified vaccinia Ankara as vector to express 5T4 (MVA-5T4), calculated progression-free survival (PFS) and overall survival (OS), and created risk groups based on the number of factors involved.
Results
Median OS was 12.4 months; median PFS was 3.6 months. Significant factors (p<0.05) included neutrophils (both), bone metastases (OS), ECOG performance status (OS), lactate dehydrogenase levels (both), prior therapy with tyrosine kinase inhibitors plus immunotherapy (OS), Fuhrman grade (OS), and 5T4-specific ELISPOT response (PFS). By group, median OS was not reached in patients with favorable risk (censored at cutoff), was 13.7 months in those with intermediate risk and 4.0 months in those with poor risk.
Conclusions
Further validation of this model will identify the patients most likely to respond to MVA-5T4 and provide a framework for outcomes models for other vaccine therapies.
Introduction
Renal cell carcinoma (RCC) is the most prevalent primary malignancy of the kidney (1). Approximately 20%-30% of patients who present with RCC have metastatic disease, which has a poor prognosis (1). In addition, the incidence rate of RCC has increased steadily in the past decade. In 2014, over 63,000 new cases are anticipated, and the 5-year survival rate for metastatic RCC (mRCC) patients remains only 10%-12% (2).
Conventional therapies for mRCC include chemotherapy and hormone therapy, but such treatments have achieved low response rates (<10%) and have made little impact on overall survival (OS) (1). Efficacy and tolerability data for sunitinib, sorafenib, pazopanib, temsirolimus, everolimus and axitinib have provided pivotal first- and second-line data supporting the benefits of novel targeted therapies for the management of mRCC (3–4–5–6–7–8). Immunotherapy using interferon-α (IFN-α) and interleukin-2 (IL-2) are also staples in mRCC management (9). IFN-α has been shown to stimulate the activity of cytotoxic T cells and natural killer cells and to promote macrophage activation and cytokine production (10). IL-2 has been shown to promote T cell immunologic memory. Although immunotherapy treatments are more promising than conventional therapies, they have achieved response rates of only <30% and a median OS of ~1 year (9).
5T4 is a tumor-associated antigen expressed on cell surfaces, making it a potential target for antibody-mediated and T cell effector responses (9). As a nonmutated self-antigen, 5T4 is expressed at high levels in trophoblastic cells in the placenta and at low levels in nonpregnant adult tissues (10). However, it is also expressed in >80% of carcinomas, making it a useful marker of malignancy (10). Studies have shown that the 5T4 antigen is also retained in metastatic cancer tissues (11). To activate immunity, however, 5T4 must be presented to the body as a foreign antigen. The modified vaccinia Ankara (MVA) has been selected as a safe vector engineered to express the 5T4 antigen.
Two independent phase II studies have demonstrated MVA-5T4 to be safe and highly immunogenic as monotherapy or in combination with IFN-α or IL-2 (10, 11). However, a randomized phase III trial evaluating MVA-5T4 alone and in combination with IFN-α and IL-2 did not demonstrate a significant difference in OS between MVA-5T4 and placebo groups among its >700 mRCC patients (9). Although the primary end point of that study was not met, some patients responded well to the treatment, suggesting that better patient selection is critical for optimizing the benefit of this therapy (9).
This study evaluated data from 2 phase II studies to create a clinical outcomes model for progression-free survival (PFS) and OS. We analyzed patients treated with MVA-5T4 alone, MVA-5T4 plus IFN-α, or MVA-5T4 plus IL-2, to investigate correlations between pretreatment clinical factors and PFS and OS. Although such models have been created for other specific mRCC treatments (12, 13), this is the first to be developed specifically for MVA-5T4. Once validated, this model has the potential to assist in the precise selection of patients most likely to respond to MVA-5T4 and provide a framework for creating similar outcomes models for other vaccine therapies.
Methods
Patient characteristics
Both phase II studies were conducted in accordance with the Declaration of Helsinki and good clinical practice. Patients gave signed, informed consent before study entry. The patient population for this analysis included 53 patients with histologically confirmed clear cell or papillary mRCC who were treated with MVA-5T4 alone, MVA-5T4 plus IFN-α, or MVA-5T4 plus IL-2. Other eligibility criteria included previous treatments for RCC, Karnofsky performance status ≥80%, serum calcium ≤10 mg/dL, total white cell count ≥3×10⁹/L, and hemoglobin ≥9 mg/dL (10, 11). For additional inclusion and exclusion criteria, refer to the original studies (10, 11).
Treatment plan
All patients were administered MVA-5T4 into the deltoid muscle at a dose of ~5×10⁸ plaque-forming units. Patients in the MVA-5T4 plus IFN-α treatment group were also administered IFN-α 3 times per week on alternating days as a subcutaneous (s.c.) injection (10). IFN-α dose on week 1 was 6×10⁶ units, and subsequent doses consisted of 9×10⁶ units (10). Patients in the MVA-5T4 plus IL-2 treatment group were also administered IL-2 in 8-week cycles as a s.c. injection at a dosage of 250,000 units/kg per day for 5 consecutive days in week 1 and 125,000 units/kg per day for 5 consecutive days during weeks 2-6, followed by 2 weeks off (11). Maximum treatment times for both studies were 48 weeks. For additional inclusion and exclusion criteria, refer to the original studies (10, 11).
Statistical analysis
This study collected the baseline demographic clinical and laboratory data from both studies. Laboratory values were standardized against institutional upper and lower limits of normal values when necessary.
A total of 50 patients were analyzed. Distributions of OS and PFS were estimated using the Kaplan-Meier product-limit method; median OS and PFS are reported, along with 95% confidence intervals (95% CIs). Kaplan-Meier plots were displayed with the number of persons at risk at specified time points.
PFS was calculated from the date of first initiation of therapy until the date of progression or death. OS was calculated from date of first initiation of therapy until the last day of follow-up or death. Patients who did not develop the outcome of interest by the cutoff date or who were lost to follow-up were counted as censored values.
Univariate and multivariate analyses
The correlations between OS and PFS and each of the variables were analyzed using the log-rank tests in univariate analysis after all of the continuous variables were categorized according to previous clinical trials (10, 11). For multivariate analyses, the Cox proportional-hazards model with step-wise variable selection at a significance level of 0.15 for entering and removing variables was used to assess multiple factors simultaneously. There were missing values for some exploratory variables (<5%), so the case deletion method was used in all regression analyses (14). The final models were validated through 2-step bootstrap resampling procedures (15). In the first step, 200 samples randomly selected from the original study population without replacement were used for step-wise Cox regression to identify the risk factors. The frequency of each variable included in the models from 200 bootstrap samples was calculated and ranked. In the second step, we fitted the Cox regression model with the selected risk factors from the first step using 200 bootstrap random samples from the original study population without replacement (16). Regression parameters and 95% CIs are given. Once the risk factors were determined, and the final model was formed, points were assigned to each risk factor of death based on the regression coefficients, by dividing each respective regression coefficient in the final Cox model by the smallest coefficient and then rounding to the nearest integer (17). Each patient was assigned to 1 of 3 risk groups – the low-risk group, medium-risk group or high-risk group – according to their total risk score. Survival curves were estimated for each of these groups, and the groups were compared using the log-rank test. The p values from pairwise comparison among these groups were presented after Sidak adjustment for multiple tests. A p value <0.05 was considered to indicate statistical significance.
Results
Outcomes
Baseline characteristics of the patients are given in Table I. A total of 53 patients were entered into studies, but 3 were excluded from statistical analysis due to progression of disease before start of treatment. Fifty percent of patients received MVA-5T4 plus IL-2, 26% received MVA-5T4, and 24% received MVA-5T4 plus IFN-α. There was a ≥24-month gap from time of diagnosis to treatment for more than half of the patients (60%).
Demographic And Clinical Patient Characteristics Of Study Population
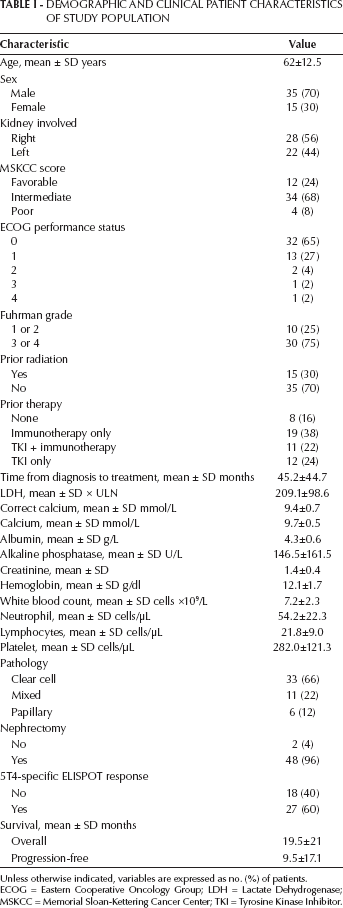
Unless otherwise indicated, variables are expressed as no. (%) of patients.
ECOG = Eastern Cooperative Oncology Group; LDH = Lactate Dehydrogenase; MSKCC = Memorial Sloan-Kettering Cancer Center; TKI = Tyrosine Kinase Inhibitor.
Univariate analysis
Demographic, clinical and laboratory variables associated with the univariate analysis are described in Tables II (OS) and III (PFS). Figure 1A shows the Kaplan-Meier curve for OS. Median OS was 12.4 months (95% CI, 7.46-16.53 months). Of the 50 patients evaluated, 41 failed treatment, and 9 were censored. Fourteen factors were determined to be significant risk factors for OS. They included treatment with TroVax, prior therapy, prior tyrosine kinase inhibitor (TKI) and immunotherapy, ECOG performance status ≥1, Fuhrman grade level 3/4, presence of bone metastasis, presence of lymph node metastasis, >2 metastatic sites, neutrophils ≥69 cells/µL, lymphocytes <25 cells/µL, platelets ≥300 cells/µL, lactate dehydrogenase (LDH) ≥1.5 × upper limit of normal (ULN), alkaline phosphatase >120 g/L and clear cell pathology.
Univariate Analysis Of Demographic And Clinical Patient Characteristics And Overall Survival (Os)
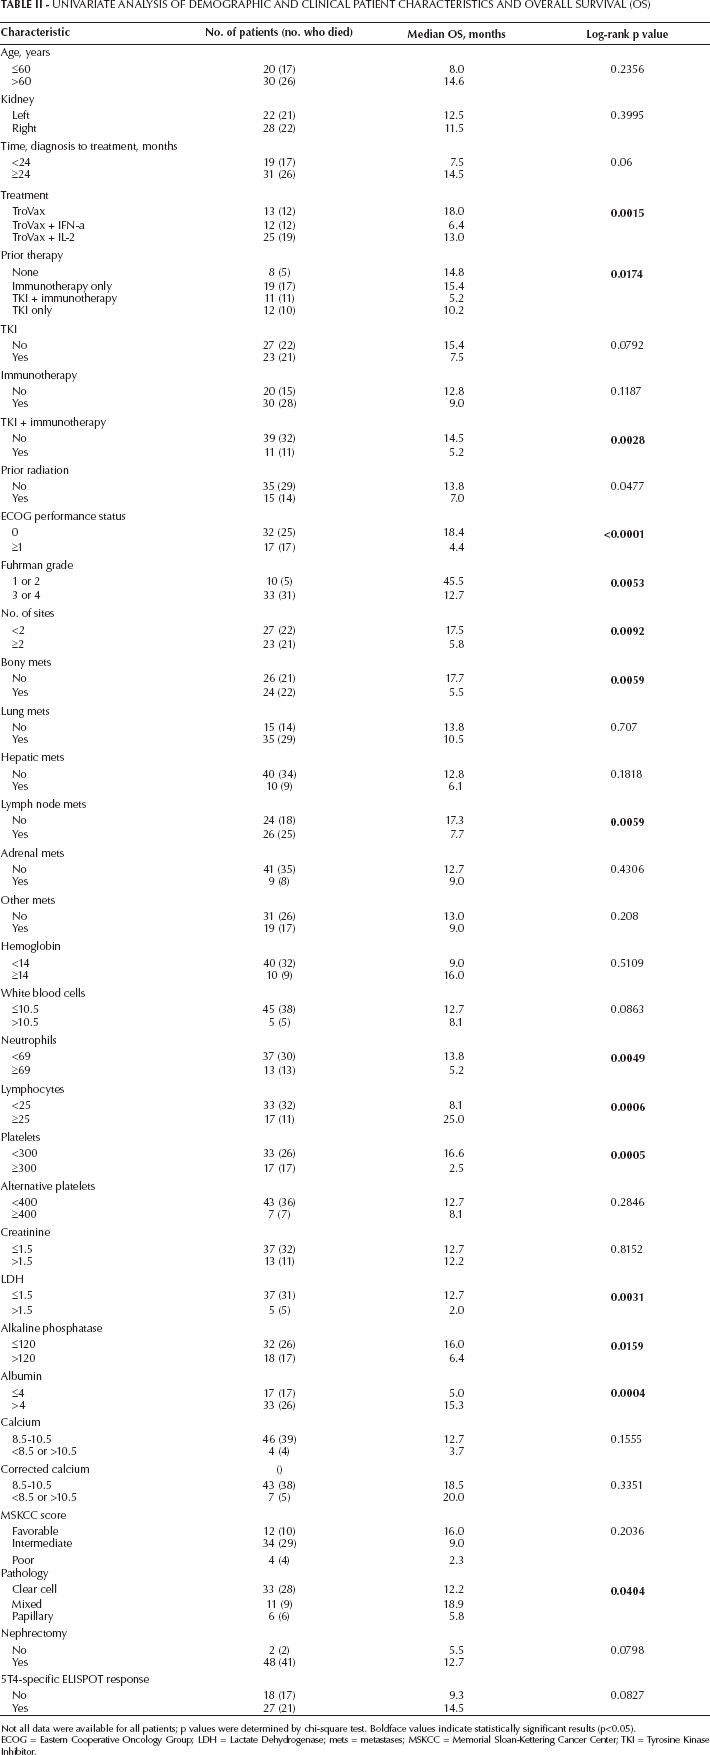
Not all data were available for all patients; p values were determined by chi-square test. Boldface values indicate statistically significant results (p<0.05).
ECOG = Eastern Cooperative Oncology Group; LDH = Lactate Dehydrogenase; mets = metastases; MSKCC = Memorial Sloan-Kettering Cancer Center; TKI = Tyrosine Kinase Inhibitor.
Univariate Analysis Of Demographic And Clinical Patient Characteristics And Progression-Free Survival (Pfs)
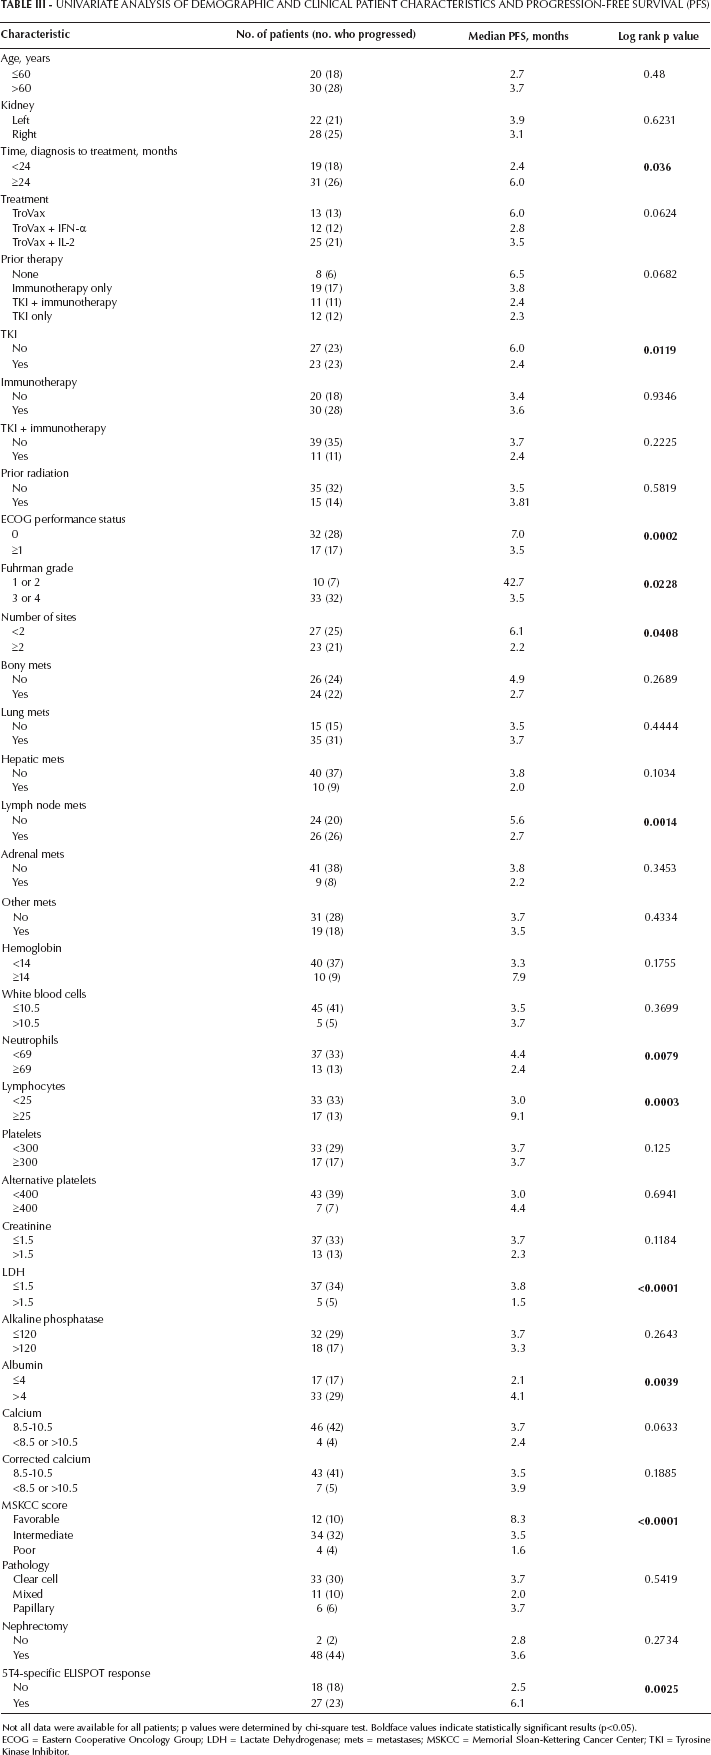
Not all data were available for all patients; p values were determined by chi-square test. Boldface values indicate statistically significant results (p<0.05).
ECOG = Eastern Cooperative Oncology Group; LDH = Lactate Dehydrogenase; mets = metastases; MSKCC = Memorial Sloan-Kettering Cancer Center; TKI = Tyrosine Kinase Inhibitor.
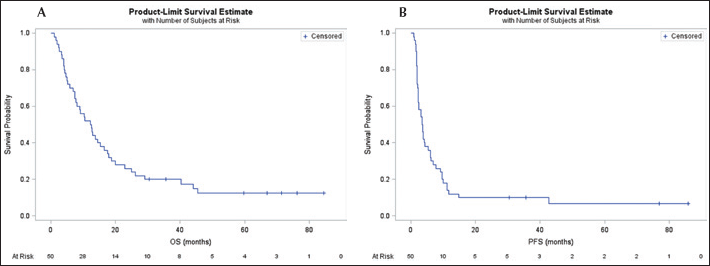
Kaplan-Meier survival curves: A) overall survival (OS); B) progression-free survival (PFS).
Figure 1B shows the Kaplan-Meier curve for PFS. Median PFS was 3.6 months (95% CI, 2.27-5.37 months). Of the 50 patients evaluated, 46 failed treatment, and 4 were censored. Thirteen factors were determined to be significant risk factors for PFS. They included time from diagnosis to treatment <24 months, prior TKI, ECOG performance status ≥1, Fuhrman grade level 3/4, presence of lymph node metastasis, lung metastasis, >2 metastatic sites, neutrophils ≥69 cells/µL, lymphocytes <25 cells/µL, LDH ≥1.5 × ULN, albumin <4 g/L, Memorial Sloan-Kettering Cancer Center (MSKCC) score and 5T4-specific ELISPOT response.
Multivariate analysis
Risk factors identified in the univariate analysis were entered into a multivariate analysis model. We found 6 factors that retained their significance for OS: Eastern Cooperative Oncology Group (ECOG) performance status ≥1, Fuhrman grade level 3/4, LDH ≥1.5 × ULN, neutrophils ≥69 cells/µL, prior TKI plus immunotherapy and the presence of bone metastases (Tab. IV). For PFS, 4 factors retained significance: time to treatment ≥24 months, neutrophils ≥69 cells/µL, LDH ≥1.5 × ULN and 5T4-specific ELISPOT response (Tab. V). The results from 2-step bootstrap Cox regression analysis also showed that risk factors selected from the original study population matched the top-ranked risk factors with the highest frequencies of inclusion in 200 bootstrap sample models for OS and PFS. The estimated regression coefficients from the 200 bootstrap samples were close to the original model (Tabs. IV–V–VI).
Multivariate Analysis Of Risk Factors Associated With Overall Survival
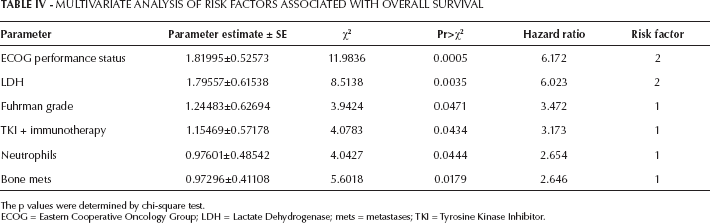
The p values were determined by chi-square test.
ECOG = Eastern Cooperative Oncology Group; LDH = Lactate Dehydrogenase; mets = metastases; TKI = Tyrosine Kinase Inhibitor.
Multivariate Analysis Of Risk Factors Associated With Progression-Free Survival
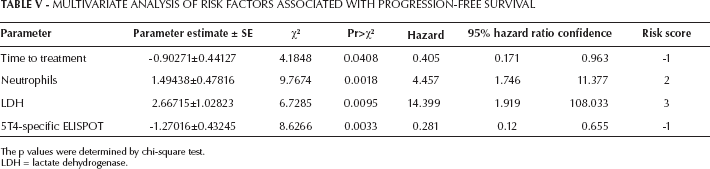
The p values were determined by chi-square test.
LDH = lactate dehydrogenase.
Bootstrap Parameter Means Of Factors Associated With Overall And Progression-Free Survival
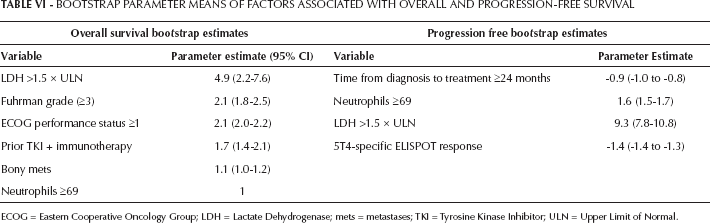
ECOG = Eastern Cooperative Oncology Group; LDH = Lactate Dehydrogenase; mets = metastases; TKI = Tyrosine Kinase Inhibitor; ULN = Upper Limit of Normal.
Risk factor analysis
Based on the 6 OS and 4 PFS risk factors and weighted points according to the regression coefficients in multivariate models, patients were segregated into 3 risk categories – low risk, medium risk or high risk – according to the number of risk factors for each patient. Eight factors were noted to confer risk in the OS model. Patients with 0 factors were categorized as low-risk, 1-3 factors as medium-risk, and 4-8 factors as high-risk. The results from pairwise comparison using the log-rank test showed a significant difference in the survival distribution of OS between the low-risk and high-risk groups (p=0.05) and between the medium-risk and high-risk groups (p<0.01). As Figure 2A shows, the 1-year vs. 3-year survival rates of patients was both 60% for the low-risk group, 59% vs. 9% for the medium-risk group, and both 0% for the high-risk group (Fig. 2A). For PFS, 5 factors were noted to confer risk. Patients with 0 factors were categorized as low-risk, 1-2 factors as medium-risk, and 3-5 factors as high-risk. The results from pairwise comparison using the log-rank test showed a significant difference in the survival distribution of PFS between the low-risk and medium-risk groups (p=0.0013) groups and between the low-risk and high-risk groups (p<0.01). The 1-year vs. 3-year survival rates of patients was 16% vs. 10% for the low-risk group; rates decreased to 0 for patients in the medium-risk and high-risk groups (Fig. 2B).
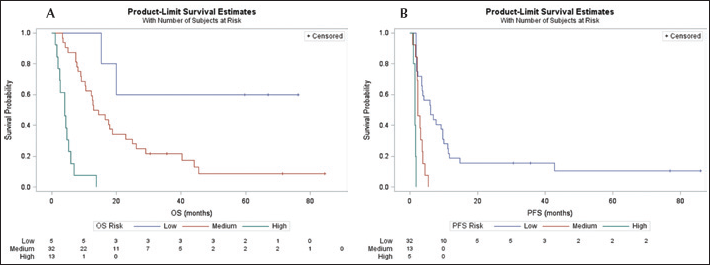
Survival estimates by risk group. A) overall survival (OS); B) progression-free survival (PFS).
Because of loss to follow-up before death or missing date of death, 14% of patients (7/50) analyzed for OS and 8% of patients (4/50) analyzed for PFS were censored.
Discussion
We have identified a set of univariate and multivariate risk factors that can be used to predict the effect on OS and PFS of treatment with MVA-5T4 for RCC, either as monotherapy or combined with IL-2 or IFN-α. We created a risk-factor model that can also be used to predict survival outcomes.
Our univariate analysis uncovered a number of factors predictive of OS and PFS. Factors influencing both survival measures included ECOG performance status ≥1, Fuhrman grade level 3/4, >2 metastatic sites, neutrophils ≥69×108 cells/L, lymphocytes ≥25×108 cells/L, and LDH ≥1.5 × ULN. In general, these results agree with those of previous univariate analyses (1, 18–19–20). A review by Carles et al remarked that there is broad consensus that time from diagnosis to treatment, performance status, and levels of calcium, hemoglobin, LDH and neutrophils are predictors of survival in previously treated RCC patients (21). Two studies of RCC patients treated with vascular endothelial growth factor (VEGF) receptor inhibitors found a set of predictive factors similar to ours, with direct overlap in finding performance status, neutrophils and LDH to be significant (22, 23). A study of inflammatory markers in RCC found performance status, neutrophils, lymphocytes and albumin, among other factors, to predict survival (24). In a study of >1,000 RCC patients, Mozter et al found a list of predictive factors that largely overlaps with ours, including platelets, lymphocytes, LDH and lymph node metastases (25).
In our multivariate analysis, we found just 2 factors prognostic for both OS and PFS: neutrophil and LDH levels. Longer time to treatment and 5T4-specific ELISPOT response were also prognostic for PFS, and ECOG performance status, higher Fuhrman grade, bone metastases and prior TKI plus immunotherapy for OS. As with our univariate analysis, these results are in good agreement with those of previous studies (15, 21–22–23–24–25). LDH was predictive in a recent study by Mozter et al (25), as were bone metastases and prior immunotherapy. Platelets and calcium were significant predictive factors in the multivariate analyses of most of these studies, although we did not find this in our study. The difference could be a reflection of our small sample size or of different factors affecting the response to treatment with vaccine therapy (our study) compared with TKIs (25) or VEGF receptor inhibitors (22, 23).
Once we entered the prognostic factors from the multivariate analysis into our risk-factor model, we found marked differences in OS and PFS at 1 and 3 years for the different groups: favorable risk, intermediate risk and poor risk. Sixty percent of patients with favorable risk were alive at 1 year, compared with no patients with poor risk. One of the earliest risk-factor models for RCC found a similar result: 71% of patients with favorable risk vs. 12% of patients with poor risk alive at 1 year (26). This is in line with the results of Choueiri et al (22), who found that 67% of patients with favorable risk vs. 16% of patients with poor risk were alive at 1 year.
Although we only had 50 patients in our study, our model found significant differences in OS and PFS for patients in the low-risk group, as well as marked differences in 1-year and 3-year survival. Even though the results need to be validated in a larger sample, these results suggest that baseline clinical factors can assist in appropriate treatment selection.
According to regression coefficients indicating different amounts of contribution to the hazard, a different “score” was assigned to each individual risk factor when defining the risk-factor groups. Pairwise comparison using the log-rank test showed statistically (boundary) significant differences among the risk groups in survival distributions of OS and PFS. The cutoff values for groups were chosen arbitrarily according to the distribution of total risk scores of the patients. Further study with external validation is necessary to confirm the results.
Conclusion
Although this was a retrospective analysis of a small sample, our model, in agreement with data from previous studies, suggests that precise selection of patients based on levels of risk and specific clinical factors can identify those mostly likely to benefit from MVA-5T4 therapy for advanced RCC. The risk factors we identified are determined during routine clinic visits and laboratory tests and can therefore give inexpensive, objective guidance about potential treatment response and prognosis. Our results need to be validated in a larger population, but this model holds the potential to prove useful not only for selecting patients to receive MVA-5T4 but also for other vaccine therapies.
Footnotes
Acknowledgments
We thank Fangqian Ouyang and Jessica Williams for their valuable assistance with the statistical models.