
Abstract
Background
PSF1 is a subunit of the GINS complex which is essential for establishment of DNA replication forks, and the progression of the replisome. Previous studies have shown a close relationship between PSF1 and cell cycle in the proliferation of immature cells as well as tumors. The purpose of this study was to measure PSF1 expression in hepatocellular carcinoma (HCC) tissues, and determine the effects of down-regulation of PSF1 expression on growth of cancer cells, the cell cycle, apoptosis and cell invasiveness.
Methods
Samples from 137 HCC tissues, 67 from adjacent nontumor tissue and 15 from normal liver were studied using immunochemistry. The HepG2 cell line was used for knockdown experiments studied by RT-PCR, real-time PCR, apoptosis and invasiveness assays.
Results
PSF1 was overexpressed in HCC tissues compared with normal liver tissues. High PSF1 expression correlated with a more aggressive phenotype as well as worse prognosis in HCC patients. Knockdown of PSF1 expression using small interfering RNA (siRNA) slowed the growth of cancer cell by suppressing the cell cycle progression as well as increasing apoptosis, especially early apoptosis. In addition, the invasiveness of HepG2 cells was also reduced by down-regulation of PSF1.
Conclusions
These results suggest that the inhibition of PSF1 might provide new therapeutic approaches for HCC.
Introduction
It has become increasingly clear that the appropriate regulation of the eukaryotic cell cycle is essential (1, 2). The origin recognition complex (ORC) is considered to play an important role in the initiation of DNA replication. ORC acts to recruit proteins required for chromatin loading of the minichromosome maintenance 2-7 complex (MCM2-7). The MCM2-7 complex and Cdc45 unwind the parental DNA duplex, allowing DNA polymerases to initiate DNA synthesis (3). GINS is a complex recently discovered by using a variety of genetic screens in Saccharomyces cerevisiae. It consists of SLD5, PSF1, PSF2 and PSF3 components, and is well conserved evolutionarily (4). Recently, GINS was reported to be involved, during and after initiation of DNA, with replication regulatory factors such as CDC45 which interact with MCM in replisome progression complexes (RPCs) (5). In yeast, the GINS complex associates with the MCM2-7 complex and CDC45, and this so-called C-M-G complex (CDC45-MCM2-7-GINS) regulates both the initiation and the progression of DNA replication (6–7–8–9–10).
PSF1, predominantly expressed in highly proliferative organs and immature cell lineages, is essential for early embryogenesis, spermatogonia (11) and hematopoietic stem cells (12) after birth. Additionally, PSF1 has been found to be overexpressed in intrahepatic cholangiocarcinoma tissues (13), aggressive melanoma tissues (14) and breast cancer tissues (15).
Although several studies have suggested that PSF1 plays a role in cancers as described above, its expression in hepatocellular carcinoma (HCC) has not been examined. The aim of this study was to measure PSF1 expression in HCC tissues, and determine the effects of down-regulation of PSF1 expression on growth of cancer cells, the cell cycle, apoptosis and cell invasiveness.
Materials and Methods
Patients, specimens and cell lines
Samples from 137 HCC tissues, 67 from adjacent nontumor tissue and 15 from normal liver were studied. All specimens were from the Institute of Pathology, The First Affiliated Hospital, Xi'an Jiao tong University (with detailed clinical data) including tissue microarrays (TMAs) (US Biomax) (part with clinical data). The samples for reverse transcriptase polymerase chain reaction (RT-PCR) and real-time RT-PCR were obtained from patients who underwent surgical resections. All samples were immediately frozen and stored in liquid nitrogen. Informed consent was obtained from all patients, and this study was approved by our institutional review board of the First Affiliated Hospital, School of Medicine, Xi'an Jiao tong University.
The HepG2 human hepatoblastoma cell line (Liver Cancer Institute, Fudan University Shanghai, China) was cultured in a RPMI 1640 medium with 10% superior placental bovine serum (Sijiqing, HangZhou, China) at 37ºC with 5% CO2.
RT-PCR analysis
Total RNA was isolated from the samples using the RNAfast200 Total RNA Extract Kit (Fastgene, ShangHai, China), and 2 μg of RNA was reverse transcribed to cDNA by the RevertAid First Strand cDNA Synthesis Kit (Fermentas, MBI, Lithuania). Primers for the PSF1 gene were as follows: 5′-CAACGAGGATGGA CTCAGACAAG-3′ (forward) and 5′-CGAAGCAAGCGGTCATACAGG-3′ (reverse). Primers for the β-actin gene were as follows: 5′-ACTATCggCAATgAgCg gTTCC-3′ (forward) and 5′-CTgTgTTggCATAgAggTCTTTAC g-3′ (reverse). PCR was performed in 25 μL reaction buffer with a 3-minute pretreatment at 94ºC, 30 PCR cycles of denaturing at 94ºC for 30 seconds, annealing at 58ºC for 30 seconds and extension at 72ºC for 45 seconds. The PCR products were resolved on a 1.5% agarose gel.
Real-time PCR
Total RNA was isolated and reverse transcribed as described above. Quantitative real-time PCR was performed with a SYBR PremixExTaq RT-PCR Kit (TaKaRa, DaLian, China) on a real-time quantitative PCR System (Bio-Rad, Richmond, CA, USA). The relative PSF1 levels in each sample were normalized to glyceraldehyde-3-phosphate dehydrogenase (GAPDH) cDNA and calculated using 2 (−ΔΔCT) by comparing the amount of mRNA of each tumor sample to the adjacent nontumor sample. Real-time PCR was used to examine the efficiency of PSF1 knockdown. We used the following primer sets: 5′-CAAGGTCATCCATGACAACTTTG-3′ (forward) and 5′-GTCCA CCACCCTGTTGCTGTAG-3′ (reverse) for GAPDH, and 5′-TTCCCTGAGATTC AGATTGACTG-3′ (forward) and 5′-GGTCATAGACCAAAGTATAAAGC-3′ (reverse) for PSF1. The PCR was performed in 25 μL of reaction buffer with a 30-second pretreatment at 95ºC, 40 PCR cycles of denaturing at 95ºC for 5 seconds and annealing at 60ºC for 30 seconds.
Immunohistochemistry
In brief, after heat-induced epitope retrieval, the sections were incubated with goat polyclonal anti-PSF1 antibody (Santa Cruz Biotechnology, Santa Cruz, CA, USA) at a dilution of 1:50. Subsequently, sections were incubated with HRP-labeled secondary antibody (1:100) (Boster, WuHan, China) at 37oC for 30 minutes. 3,3′-Diaminobenzidine (DAB) was used as a chromogen, and sections were counterstained with hematoxylin.
Western blotting
Cells were lysed in ice-cold RIPA lysis buffer. Equal amounts of proteins were loaded onto sodium dodecyl sulfate (SDS)–polyacrylamide gels. Proteins were transferred onto polyvinylidene difluoride membranes (Millipore, MA, USA), blocked with 5% non-fat dry milk, then exposed to anti-PSF1 (1:1,000, Santa Cruz Biotechnology, Santa Cruz, CA, USA) or anti-β-actin antibody (1:2,000, Santa Cruz Biotechnology, Santa Cruz, CA, USA). Blots were developed with peroxidase-labeled anti-goat antibodies (1:2,000, Zhongshan, Beijing, China). Signals were detected on X-ray film using an ECL detection system (Pierce, Rockford, IL, USA).
Transfection of siRNA
Small interfering RNA (siRNA) specific to human PSF1 and negative control siRNA were synthesized by Shanghai GenePharma Co (ShangHai, China). We used two primer sets: siPsf1A, 5′-AAA ACC AGU CUG AUG UGA ATd TdT-3′ and siPsf1B, 5′-AAA GAU CUC UUG CUA CUU AdT dT-3′. Transfection of siRNA was carried out with Lipofectamine 2000 (Invitrogen, Carlsbad, CA, USA) as described by the manufacturer. Transfection efficiency was determined by real-time PCR. The cells were analyzed on a FACS Calibur flow cytometer equipped with Cell Quest software (Becton Dickinson, San Jose, CA, USA).
Cell cycle analyses
Forty-eight hours after transfection, cells were trypsinized, collected and washed twice with phosphate-buffered saline (PBS). Cells were fixed in cold 70% ethanol for about 5 hours at 4ºC. After treatment with RNase A (0.5 mg/mL), cells were labeled with 5 μg/mL propidium iodide (PI) and analyzed by FACS Calibur flow cytometer (Becton Dickinson, San Jose, CA, USA). Experiments were done in triplicate.
Cell proliferation assay
Cell viability was measured by MTT assay. HepG2 cells were seeded at 5×10³ per well in 96-well flat-bottom plates 1 day before transfection. The MTT assay was performed just before transfection, as well as 24, 48 and 72 hours after transfection. For the assay, 20 μL of 5 mg/mL MTT was added to each well and incubated for 4 hours before 150 μL of dimethyl sulfoxide (DMSO) was added. A microplate reader (Bio-Rad, Hercules, CA, USA) was to measure the absorbance values at 570 nm.
Apoptosis assay
Apoptosis was assayed quantitatively using an annexin V assay kit (Beyotime, Shanghai, China). Briefly, cells were incubated and treated as described previously for the cell cycle analysis. Cells were sampled at 48 hours after the end of treatment. Approximately 1x10⁵ cells were resuspended in binding buffer (10 mM HEPES/NaOH, pH 7.4, 140 mM NaCl, 2.5 mM CaCl2) and then stained with annexin V (green fluorescence) and PI (red fluorescence negative) at room temperature for 30 minutes in the dark. Cells were immediately analyzed with a FACS Calibur flow cytometer (Becton Dickinson) using CellQuest software. Cellular status was defined as follows: LL cells were classified as live, LR were early apoptotic, UR were late apoptotic and UL were dead.
Migration assay
To detect the effect of PSF1 on cell migration in vitro, a modified monolayer-wounding cell migration assay was used. HepG2 cells were seeded at 5×10⁵ per well in 6-well flat-bottom plates 1 day before transfection. The day after the cultures reached confluence, cells were transfected with siPSF1-1 and siPSF1-2. HepG2 cells were scraped with a sterile single-edged razor blade and washed twice with PBS before being exposed to serum-free medium. HepG2 cells were cultured at 37ºC with 5% CO2. After 24 hours, 5 microscopic fields were randomly chosen from each experiment. Image-ProPlus software (version 4.5.1; US) was used to measure the maximum distance of migration (wound edge to the farthest migrated cell).
Statistical analysis
Data from immunohistochemical staining were evaluated using Fisher's exact test and the nonparametric Wilcoxon rank sum test, as well as receiver operating characteristic (ROC) curve analysis for clinical correlation. Other results were expressed as means ± standard deviation (SD). The data were analyzed by 1-way ANOVA. Pair-wise comparisons were conducted by Student's t-test and Newman-Keuls test. Statistical significance was set at a p value <0.05. All analyses were performed using SPSS version 16.0 (SPSS Inc., Chicago, IL, USA).
Results
Expression of PSF1 in HCC and borderline tumor tissues
PSF1 mRNA levels were found to be elevated in 91.5% of HCC specimens compared with 8.5% of adjacent nontumor tissues (Fig. 1A). To further confirm these data, we evaluated the PSF1 mRNA levels in these samples by real-time PCR of 24 HCC tissues and adjacent nontumor tissues. mRNA levels in HCC were nearly 5 times those in adjacent nontumor tissues (Fig. 1B) (p<0.05). We concluded that the expression of PSF1 in HCC was clearly higher than in adjacent nontumor tissue.
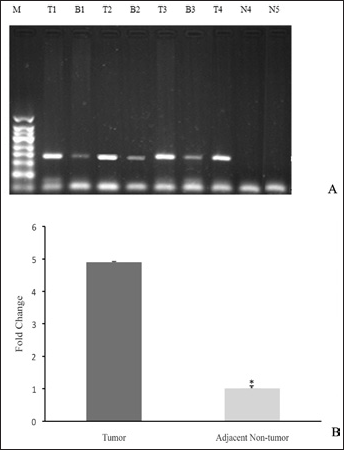
PSF1 expression in tissues. A) PSF1 expression in hepatocellular carcinoma (HCC), adjacent nontumor and normal liver tissues analyzed on agarose gels. B) Real-time PCR was used to confirm the data. (GAPDH was used as an internal control; mRNA expression in adjacent nontumor tissue was used for normalization.) *p<0.05 (n = 24, mean ± SEM). M = 50-bp marker; T = tumor tissue; B = adjacent nontumor tissue; N = normal liver tissue.
PSF1 protein expression correlates with prognosis
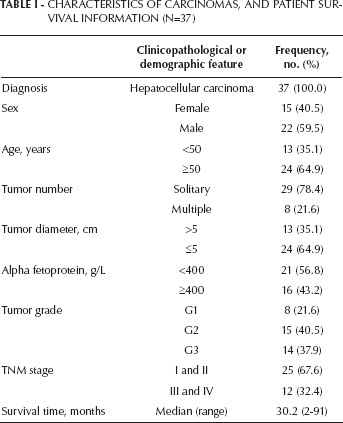
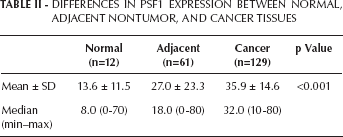
To examine PSF1 expression in HCC tissues, we performed an immunostaining analysis of PSF1 expression in specimens from 137 HCC tissues, 67 borderline tumors and 15 normal liver tissues. The characteristics of carcinomas and patient survival information are shown in Table I. PSF1 immunohistochemical staining of HCC tissue specimens was significantly higher compared with the adjacent nontumor liver samples (Fig. 2; Tab. II). The relationship between the level of PSF1 expression and clinicopathological parameters was also investigated. The results showed that a high PSF1 expression was associated with a high probability of portal vein invasion (Tab. III). ROC curve analysis for selection of cutoff scores was used for evaluating the TNM stage, tumor grade and outcome of the patients. PSF1 expression only correlated to the grade of the tumors. Levels were lowest in the most highly differentiated carcinomas, and increasing with poor differentiation (Tab. IV). Moreover, patients with higher PSF1 protein levels tended to have worse survival times. Twelve of 16 of the patients (75%) who survived 3 or more years were found to have PSF1-negative tumors, while only 4 (25%) of those patients had PSF1-positive tumors (p=0.009).
Characteristics Of Carcinomas, And Patient Survival Information (N=37)
Differences In Psf1 Expression Between Normal, Adjacent Nontumor, And Cancer Tissues
Psf1 Expression And Clinicopathological And Demographic Features In Hcc Patients
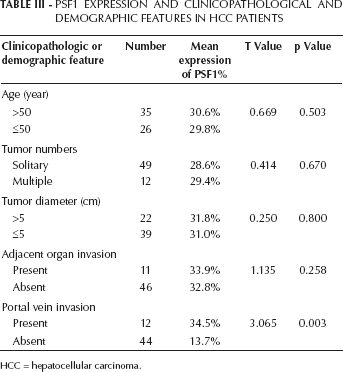
HCC = hepatocellular carcinoma.
Roc Curve Analyzed For Associations Between Psf1 And Tnm Stage, Tumor Grade And Survival Status In Hcc Patients
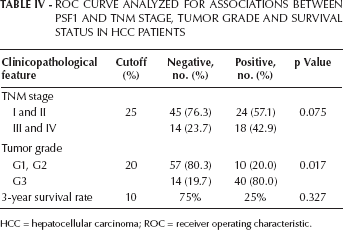
HCC = hepatocellular carcinoma; ROC = receiver operating characteristic.
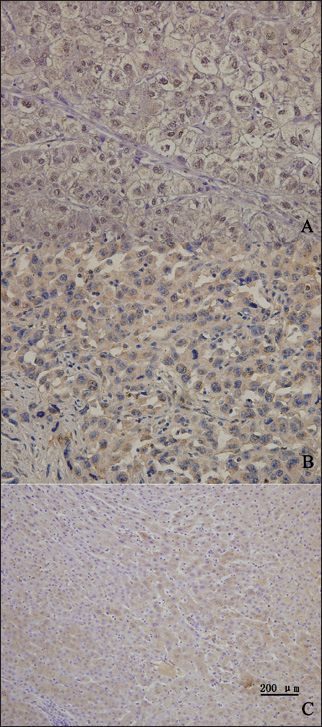
A) Immunohistochemical staining showing an example of poorly differentiated hepatocellular carcinoma (HCC) with strong PSF1 expression. B) Immunohistochemical staining showing an example of a well-differentiated HCC with moderate nuclear PSF1 expression. C) expression of PSF1 in normal liver tissue. PSF1 levels were scored by 2 independent observers blinded for clinical parameters. Slides were screened semiquantitatively for the percentage of positivity and the intensity of the signal. At least 100 cells were counted for each punch. The percentage of positive cells per number of cells counted was assessed in 10 groups from 0 (0-9%) to 9 (91%-100%). Intensity of the signal was graded semiquantitatively in 4 groups from 0 (no positivity) to 3 (strong positivity). A case was considered positive if it belonged to at least to group 1 with a percentage ≥10%, irrespective of intensity.
Medical charts were available from 37 of 137 patients. Of these 37 patients, 28 (76%) died of the disease, and 9 (24%) were alive without disease. The median follow-up was 30 months. The results suggested that patient's with tumors that had high PSF1 expression showed a trend toward a shorter survival (p=0.009) (Fig. 3). The data suggest that PSF1 expression might be a prognostic marker.
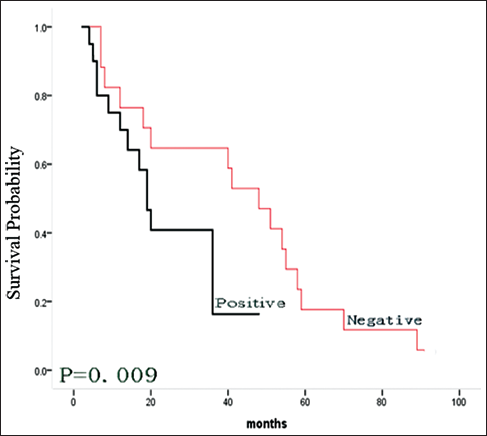
The PSF1 expression levels and survival rates in patients with hepatocellular carcinoma (HCC). The survival rates were determined using the Kaplan-Meier method, and were compared by means of the log rank test. The red line indicates a survival curve for patients with negative PSF1 expression, and the black line indicates survival of those who were positive.
PSF1 knockdown leads to changes in biological characteristics of HepG2 cell line
To assess whether PSF1 is involved in the appearance of biological characteristics of the HepG2 cell line, we used siRNA methodology to silence 2 different coding regions of the human PSF1 mRNA sequence. The efficiency of PSF1 knockdown at 48 hours determined by real-time PCR (Fig. 4A) for siPSF1-1 was about 75.8, and for siPSF1-2, it was about 77.5 (p<0.05). The results were normalized by NC. Figure 4B shows the results of the Western blots. As shown in Figure 4C, with the red line and green line corresponding to siPSF1-1 and siPSF1-2, respectively, showed that down-regulation of PSF1 expression in HepG2 cells significantly inhibited cell proliferation compared with the blank and mock transfected cells, at least at 72 hours. The results show that PSF1 is involved in cell proliferation. Flow cytometry was used to assess whether down-regulation of PSF1 expression in HepG2 cells was associated with alterations in cell cycle progression. The percentage of HepG2 cells in S phase in PSF1 siRNA-transfected cells was increased relative to the blank and mock transfected cells (Fig. 4D). These results indicated that down-regulation of PSF1 expression suppressed cell cycle progression in HepG2 cells. PSF1 probably takes part in regulating S phase progression.
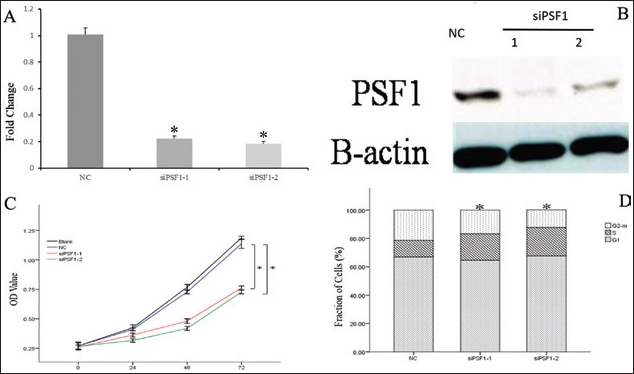
Effects of down-regulation of PSF1 on cell proliferation, cell cycle arrest, apoptosis and invasiveness on HepG2 cells. A) Real-time PCR for PSF1 expression after silencing by one of 2 siRNAs (siPSF1-1 and siPSF1-2) or a control siRNA (NC) (*p<0.05, mean ± SEM, n=3). B) The efficiency of PSF1 knockdown examined by Western blotting. C) Down-regulation of PSF1 and cell proliferation (*p<0.05, mean ± SEM, n=3). OD = optical density. D) Down-regulation of PSF1 and cell cycle arrest (*p<0.05, means ± SEM, n=3).
As can be seen from Figure 5, the percentage of apoptotic cells in the siPSF1-1 and siPSF1-2 groups accounted for 28.33% and 44.26% of total cells (early apoptosis: 24.19%, 40.45%), respectively, while it was 27.25% (early apoptosis: 6.42%) in the NC group. The results showed that silencing PSF1 expression increased HepG2 cell apoptosis, especially early apoptosis.
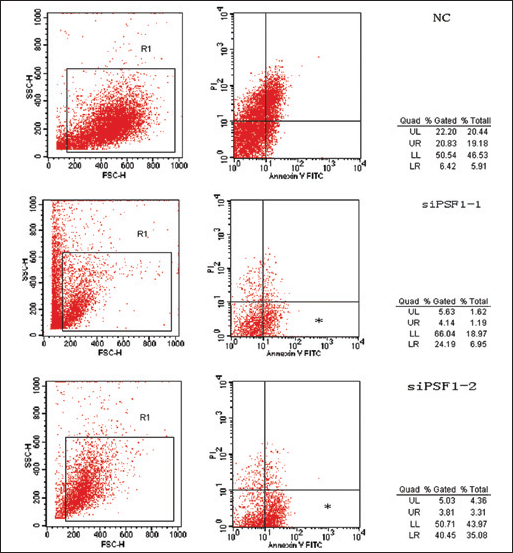
Scatter plots showing effects of down-regulation of PSF1 on cell apoptosis, especially early cell apoptosis (*p<0.05, mean ± SEM, n=3).
To determine whether knockdown of PSF1 affected the invasiveness of HepG2 cells, wound healing assays were performed. As seen in Figure 6, the migration distances of cells in siPSF1-1 and siPSF1-2 groups were 173 and 164 μm, respectively, which were much lower than that in the NC group (297 μm; p<0.05). Therefore, knockdown of PSF1 reduced the invasiveness of HepG2 cells.
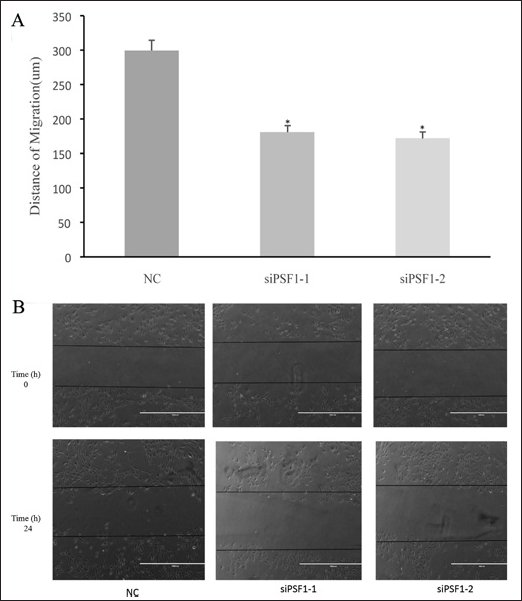
Effects of down-regulation of PSF1 on the migration of HepG2 cells. A) *p<0.05, mean ± SEM, n=3. B) Representative images of the migration assay.
Discussion
PSF1, a recently described gene, is a subunit of the GINS complex, which is known to be involved in the regulation of the cell cycle (3). Recent research has shown that PSF1 is closely correlated with cell cycle progression and immature cell proliferation (12). It also plays a role in tumor progression (2).
In the current study, we first detected the expression level of PSF1 in HCC and adjacent non-HCC liver samples and found that PSF1 was more highly expressed in the HCC samples compared with the others. It has been reported that several pre-replicative complex proteins are overexpressed in cancer and serve as good tumor markers (16). Based on these findings, the present data suggest that PSF1 might be useful as a new HCC biomarker for diagnosis of HCC progression and patient prognosis.
We found that down-regulation of PSF1 expression using siRNA inhibited cell growth by delaying DNA replication. This result is consistent with the finding that reduced PSF1 expression slowed cell growth in HeLa cells and MDA-MB-231 breast cancer cells by increasing the number of cells in the S phase (15, 17). It is crucial that chromosomal DNA is precisely duplicated during S phase of the cell cycle. Defects in this regulation have been linked to a variety of cancers (18). Our results suggest that PSF1 overexpression might be involved in cell growth of several cancers in addition to HCC by promoting changes in cell cycle progression. Moreover, knockdown PSF1 increased the numbers of apoptotic cells, and reduced invasiveness. Thus, PSF1 may have multiple biological functions other than DNA replication in mammalian cells.
Many studies have indicated that down-regulation of pre-RC proteins like Orc6 sensitized colon cancer cells to the effects of 5-fluorouracil (5-FU) and cisplatin (19). Based on these reports, our data suggest that PSF1 may serve as a new target for HCC therapy. Further studies are required to confirm this, and to elucidate the contributions of PSF1 in the other characteristics of tumors.