
Abstract
We aimed to identify key genes associated with prostate cancer using RNA-sequencing (RNA-seq) data. RNA-seq data, including 1 cancer sample and 1 adjacent normal sample, were downloaded from the NCBI SRA database and the differentially expressed genes (DEGs) were identified with the software Cufflinks. Functional enrichment analysis was performed to uncover the biological functions of DEGs. Regulatory information was retrieved from the IPA database and a network was established. A total of 147 DEGs were obtained, including 96 downregulated and 51 upregulated DEGs. Gene ontology (GO) function and Kyoto Encyclopedia of Genes and Genomes (KEGG) pathway enrichment analysis suggested that metabolism and signal transduction were the 2 major functions that were significantly influenced. Moreover, an interaction network was built. In conclusion, a number of DEGs was identified and their roles in the pathogenesis of cancer were supported by previous studies. More studies are necessary to further validate their usefulness in the diagnosis and treatment of prostate cancer.
Keywords
Introduction
Prostate cancer is one of the most common cancers among men in the United States and is the second leading cause of cancer-related death in men (1). Localized prostate cancer may be cured with surgery or radiation therapy, but the disease recurs in approximately 20%–30% of patients. For men with metastatic castration-resistant prostate cancer, the median survival ranges between 1 and 2 years (2–5). A wide range of treatments, such as chemotherapy (6), immunotherapy (7), and combined therapy has been developed, but the outcomes are hardly ideal.
Uncovering the pathogenesis of prostate cancer is an important premise to develop a therapy, and many achievements have been made in this direction. True et al proposed overexpressed CD90/THY1 as a biomarker for prostate cancer (8). Taylor et al carried out concordant assessment of DNA copy number, mRNA expression, and focused exon resequencing in prostate cancer and found NCOA2 as a new oncogene as well as a potential tumor suppressor (9). Sreekumar et al identified sarcosine as a potentially important metabolic intermediary of cancer cell invasion and aggressivity with metabolomics profiling (10). The study by Khan et al revealed a role for miR-128 in prostate cancer with quantitative proteomic profiling (11).
High-throughput technologies, such as transcriptomics, proteomics, and metabolomics are powerful tools to identify biomarkers for detection, prognosis, and treatment (12). RNA-seq is a revolutionary tool for transcriptomics using deep-sequencing technologies (13). It provides a far more precise measurement of the levels of transcripts and their isoforms than other methods. Therefore, RNA-seq data were analyzed in the present study to identify differentially expressed genes (DEGs) associated with prostate cancer. Functional enrichment analysis and regulatory network analysis were both performed, and were beneficial for improving our understandings of the underlying biological mechanisms of prostate cancer.
Materials and Methods
RNA-seq data and treatment
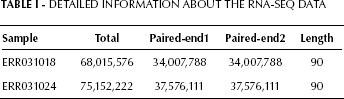
RNA-seq data were downloaded from NCBI SRA, and included 1 prostate cancer sample (No. ERR031018) and 1 adjacent normal sample (No. ERR031024). Complete transcriptomic landscapes of the samples were from the Chinese population. Raw data were collected with HiSeq 2000 (Illumina) and the reading length was 90 bp. Detailed information is shown in Table I.
Detailed Information about the RNA-SEQ Data
Screening of differentially expressed genes (DEGs)
The sequencing quality was assessed with Fastx_toolkit V2.1.12 (http://hannonlab.cshl.edu/fastx_toolkit) according to the following 2 aspects: sequencing quality distribution of bases, and base composition distribution. Then, transcriptome data was mapped into the reference genome with TopHat V1.3.2 (14) and Bowtie V0.12.9 (15). The Cuffdiff module from Cufflinks software package (16) was chosen to calculate the RPKM value (reads per kilobase of exon model per million mapped reads) in order to identify DEGs. The parameters were set up according to the default settings of Cuffdiff. FDR <0.05 was set as the cutoff criterion.
Functional enrichment analysis
Functional annotations were performed for each DEGs and then clusters of orthologous groups (COG) classification was conducted (17, 18). Gene ontology (GO) and Kyoto Encyclopedia of Genes and Genomes (KEGG) enrichment analysis were performed with the package GO stats (19) of R language to identify significantly overrepresented terms. Cytoscape 2.8 (20) was adopted to visualize pathways to directly observe the distribution of DEGs in the whole pathway.
Establishment of regulatory networks
A range of factors regulated gene and protein expression levels and activity. To deepen our understandings of the underling mechanisms, regulatory relationships were retrieved from IPA (Ingenuity Pathway Analysis) and then a network was established via Cytoscape 2.8.
Results
Identification of DEGs
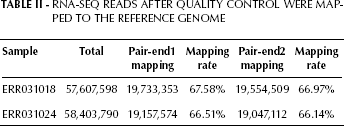
After data quality assessment and screening, about 66% reads were mapped to the reference genome (details are shown in Tab. II). The expression level was then determined with Cufflinks.
RNA-SEQ Reads after Quality Control Were Mapped to the Reference Genome
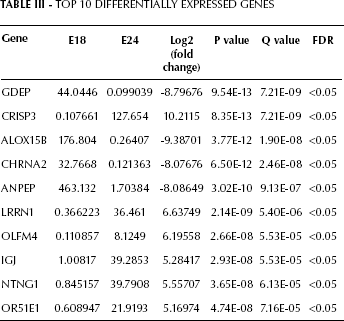
A total of 147 genes meeting the requirements were determined as DEGs, including 51 upregulated genes and 96 downregulated genes. Detailed information of the top 10 DEGs is shown in Table III.
TOP 10 Differentially Expressed Genes
Functional enrichment analysis
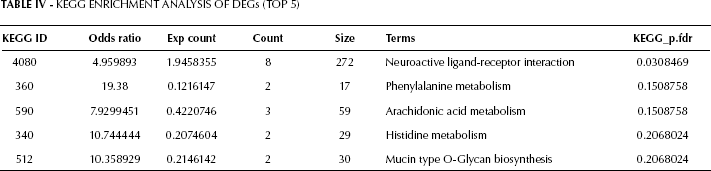
Functional annotations and enrichment analysis of DEGs was performed. KEGG enrichment analysis results are shown in Table IV. The top 5 terms were: neuroactive ligand-receptor interaction, phenylalanine metabolism, arachidonic acid metabolism, histidine metabolism, and mucin type O-Glycan biosynthesis. Notably, 4 of these terms were related to metabolism, while the other 1 was associated with signal transduction.
Kegg Enrichment Analysis of DEGs (TOP 5)
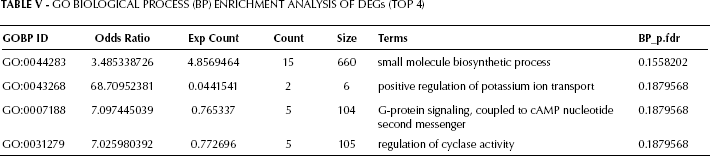
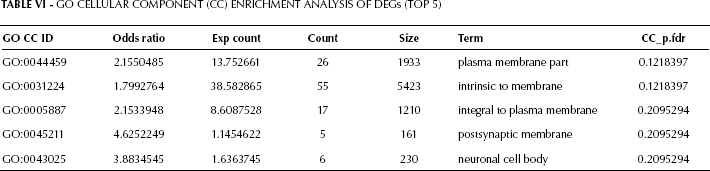
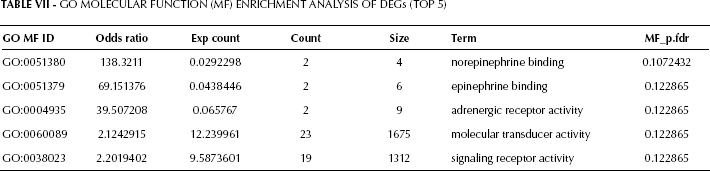
GO enrichment analysis results are shown in Tables V, VI, and VII. The top 4 biological pathways’ terms were: small molecule biosynthetic process, positive regulation of potassium ion transport, G-protein signaling coupled to cAMP nucleotide second messenger, and regulation of cyclase activity (Tab. V). Accordingly, metabolism and signal transduction were the 2 major functions affected in prostate cancer tissue compared with normal tissue. Cellular component analysis (Tab. VI) and molecular function analysis (Tab. VII) further confirmed the alterations in signal transduction.
Go Biological Process (BP) Enrichment Analysis of DEGs (TOP 4)
Go Cellular Component (CC) Enrichment Analysis of DEGs (TOP 5)
Go Molecular Function (MF) Enrichment Analysis of DEGs (TOP 5)
The distribution of DEGs in a complete KEGG pathway was visualized, and a typical illustration is shown in Figure 1.
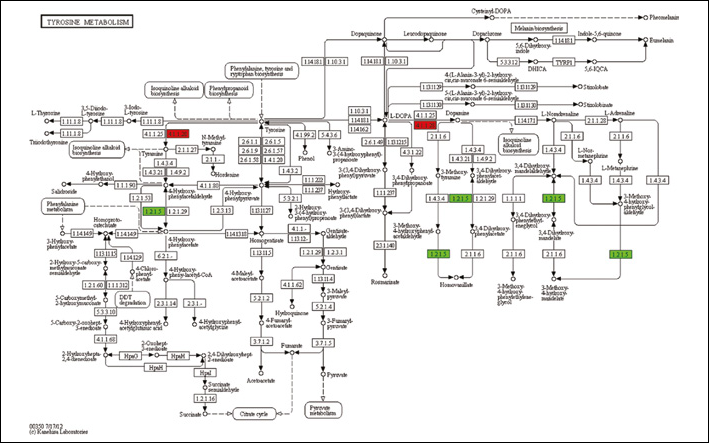
A typical illustration of the distribution of DEGs in the KEGG pathway. Red color indicates upregulated DEGs and green color indicates down-regulated DEGs.
Regulatory networks
The interactions between regulators and DEGs were retrieved from the IPA database and were then displayed via Cytoscape 2.8 (Fig. 2). In total, 6 types of relationships were assigned: complex, enzyme, transcription regulator, ligand-dependent nuclear receptor, group, and other.
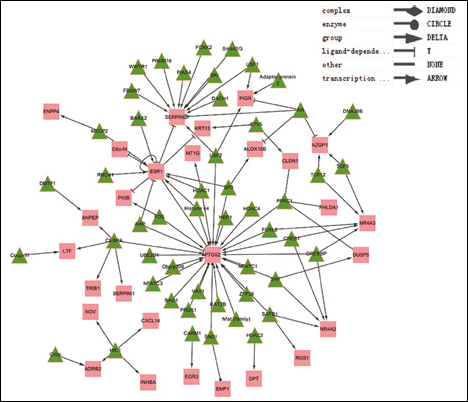
The regulatory network of the DEGs. Green triangles represent regulators and red squares represent DEGs.
Discussion
Deep sequencing-based transcriptome analysis improves the detection of differentially expressed genes, sequence variants, and novel fusion transcripts, thus holding a promising future in cancer research. In the present study, the RNA-seq data was analyzed to investigate key genes, pathways, and regulatory mechanisms associated with prostate cancer. A total of 147 DEGs were acquired, of which 51 were upregulated and 96 downregulated. Functional enrichment analysis revealed that metabolism and signal transduction were the top 2 functions significantly disturbed. The detected genes might be potential biomarkers for prostate cancer.
Prostaglandin-endoperoxide synthase 2 (PTGS2) is a key enzyme in prostaglandin biosynthesis, and is involved in inflammation (21) and mitogenesis (22). Previous studies indicated that the PTGS2 gene is silenced in prostate cancer by epigenetic hypermethylation and that it can be used as a prognostic marker (23–25). In the present study, PTGS2 was downregulated in prostate cancer. As shown in Figure 2, PTGS2 is regulated by a range of factors such as histone deacetylase 4 (HDAC4), forkhead box L2 (FOXL2), and estrogen receptor 1 (ESR1).
ESR1 is a ligand-activated transcription factor implicated in several pathological processes like cancer. It localizes into the nucleus and then forms a homodimer or a heterodimer with the estrogen receptor 2. It has been reported that ESR1 is downregulated in prostate cancer and is correlated with tumor progression (26). Several studies also pointed out that promoter methylation of ESR1 contributed to its altered expression (27, 28).
The cysteine-rich secretory protein 3 (CRISP3) is regarded as a potential biomarker for prostate cancer (29). It's a secreted protein produced in the male reproductive tract and is involved in sperm maturation. Bjartell et al reported that strong immunostaining for CRISP-3 is common in HG-PIN and is preserved in most PCa specimens (30). CRISP-3 and beta-microseminoprotein are independent predictors of recurrence after radical prostatectomy for localized prostate cancer (31).
Alanyl (membrane) aminopeptidase (ANPEP, CD13) is involved in the metabolism of regulatory peptides in different cell types. ANPEP is considered as a prognostic factor for non-small cell lung cancer (32, 33) and a therapeutic target in liver cancer stem cells (34). Chang et al found that ANPEP can form a complex with the tumor-associated antigen L6, thus modulating cell migration and invasion (35). CD-marker expression profiles can be used to distinguish heterogeneous prostate cancer cells (36). The upregulation of ANPEP is reported in gastric cancer (37) and is also validated in prostate cancer in the present study.
Olfactomedin 4 (OLFM4) is an antiapoptotic factor that promotes tumor growth and is an extracellular matrix glycoprotein that facilitates cell adhesion (38). Kobayashi et al reported that OLFM4 promotes S-phase transition in the proliferation of pancreatic cancer cells (39). In accordance with its roles in cell adhesion, Besson et al confirmed OLFM4 as a new non-metastatic tumor marker by analyzing different stages of colorectal cancer with a quantitative proteomic approach (40). OLFM4 suppresses prostate cancer cell growth and metastasis via negative interaction with cathepsin D and SDF-1 (41), a fact that may explain the downregulation of OLFM4 in prostate cancer.
Functional enrichment analysis revealed that several metabolism pathways are disturbed in prostate cancer (42). The involvement of arachidonic acid metabolism in prostate cancer PC3 cell growth has been reported by Hassan and Carraway (43). Chaudry et al found that diacylglycerol formation in prostate cancer is about 4-fold greater than that in benign prostatic tissue, which may promote tumorigenesis through activation of protein kinase C (44). Hong et al reported that modulation of arachidonic acid metabolism by curcumin may contribute to the anti-inflammatory and anti-carcinogenic actions (45).
Overall, a range of DEGs were found in the present study, some of which have been suggested as potential biomarkers for prostate cancer. Besides, functional enrichment analysis provided information about the changes in the process of tumorigenesis. Meanwhile, regulatory network analysis revealed the underlying regulatory mechanisms. Clearly, more experimental works is necessary to confirm the roles of DEGs in prostate cancer.