
Abstract
Purpose
We retrospectively analyzed ABCG2 expression levels in patients with metastatic colorectal cancer (CRC) to investigate the interaction between ABCG2 expression and the tumor response to oxaliplatin and 5-fluorouracil (FOLFOX).
Methods
Forty-three patients with CRC with liver metastasis who received first-line FOLFOX treatment at our institution between 2008 and 2010 were enrolled. ABCG2 expression was assessed by immunohistochemistry. Tumor response was determined using the modified Response Evaluation Criteria in Solid Tumors criteria.
Results
At least 50% tumor shrinkage was observed in 16/43 patients (37.2%), including a complete response in 1 patient. According to the intensity of ABCG2 expression and the percentage of tumor cells expressing ABCG2, 21 tumors displayed high ABCG2 expression. Among these tumors, only 2 (9.5%) exhibited partial responses to FOLFOX; conversely, 63.6% of tumors with low ABCG2 expression (14/22) responded to FOLFOX. Primary and corresponding metastatic samples were available for 15 patients, and 13 of the metastatic tumors had higher ABCG2 expression than the corresponding primary tumors, but only 1 of these tumors responded to FOLFOX (7.7%).
Conclusions
ABCG2 expression is associated with the tumor response to FOLFOX in patients with metastatic CRC. ABCG2 may be a selective marker for the efficacy of FOLFOX in treating CRC.
Introduction
In the past 10-15 years, colorectal cancer (CRC) treatment has rapidly and significantly improved, including the advancement of chemotherapy and surgical techniques (1-3). The survival of patients with metastatic CRC (mCRC) can be extended from 6 months with supportive care to 18 months with the FOLFOX (oxaliplatin and 5-fluorouracil [5-FU]) or FOLFIRI (leucovorin, 5-FU, and irinotecan) regimen. However, resistance of cancer cells to chemotherapeutic agents might result in the majority of patients developing postchemotherapy metastatic disease relapses (4, 5). The induction of drug uptake or export, drug-detoxifying mechanisms, quantitative and qualitative modifications of drug targets, cell cycle arrest, alterations of DNA replication or reparation mechanisms, and modulation of apoptosis are known to be associated with resistance of cancer cells to chemotherapy (6, 7).
One of the likely mechanisms of cellular resistance to a broad spectrum of cytotoxic drugs is the overexpression of drug efflux transport proteins that extrude several substances including anticancer agents and/or their metabolites out of the tumor cells, resulting in decreases of intracellular drug concentrations to a noncytotoxic level. These transporters can pump the majority of the commonly and currently used antitumor agents out of tumor cells (8-11). For example, enhanced activity of the ABCG2 transporter may decrease the accumulation of SN-38 and result in resistance to irinotecan (11).
Recently, the efficacy of oxaliplatin, a drug commonly used in colon cancer treatment, was revealed to be associated with the expression of ABCG2 in an ex vivo study (12). In the present study, we demonstrated that tumors with high ABCG2 expression responded poorly to FOLFOX, which is the standard chemotherapy regimen for CRC.
Material and Methods
Clinical data
A total of 43 patients with colorectal cancer with liver metastases who received first-line therapy with FOLFOX in Taipei Veterans General Hospital from 2008 to 2010 were enrolled in this study. Our protocol was reviewed and approved by the institutional review board at our medical center. Written informed consent was obtained for each patient. Patients who received preoperative chemoradiotherapy and required emergency surgery were excluded. The clinical data included the following information: 1) gender, age, family history, and major medical problems for each enrolled patient; 2) the location(s), size(s), gross appearance, stage(s), differentiation, and important pathological and prognostic features of the tumor(s); and 3) types of operations, complications, recurrence, and follow-up conditions.
These patients received a minimum of 6 courses of FOLFOX, and they were monitored every 3 months after therapy. The follow-up protocol included physical examination, digital rectal examination, carcinoembryonic antigen measurement, chest x-ray, abdominal sonography, and computerized tomography.
Clinical response was determined after 6 courses of FOLFOX by radiological examination (computerized tomodensitometry or magnetic resonance imaging). The Response Evaluation Criteria in Solid Tumors criteria were adopted for evaluating responses (13), which were classified as partial response (PR), stable disease (SD), progressive disease (PD), or complete response (CR). Patients with SD or PD were defined as nonresponders. Responses to therapy were also evaluated retrospectively by independent radiologists.
Immunohistochemistry
In 28 cases, the tissue samples were only from primary tumor resection. In another 15 cases, the tissue samples were from both metastatic and primary tumors at surgery.
Formalin-fixed, paraffin-embedded tissue sections (4 μm in size) were stained with human anti-ABCG2 antibody (Cell Signaling, #4477). Briefly, the sections were deparaffinized by xylene and progressively rehydrated in decreasing concentrations of alcohol. After the endogenous peroxidase activity had been blocked, sections were incubated in 1% hydrogen peroxidase in methanol for 30 minutes, followed by exposure to the primary antibody at 1:50 dilution for 1 hour. The bound antibody was detected using a biotinylated rabbit antibody to mouse immunoglobulin and the avidin-biotin complex conjugated with horseradish peroxidase. Immune complexes were visualized with 3,3′-diaminobenzidine, and 1 section that stained strongly was included in each run as the positive control. Negative control slides were made without the primary antibody. Example slides are shown in Figure 1.
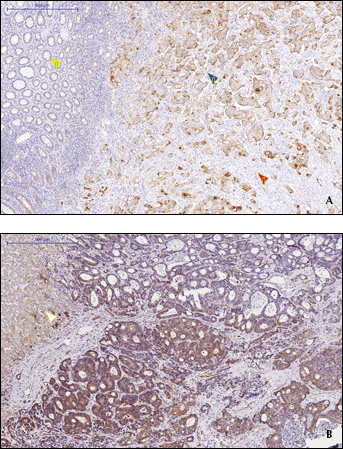
A) Representative example of ABCG2 expression in a primary tumor: 50% of the tumor cells displayed moderate expression (blue arrow; ++). The red arrow denotes the absence of ABCG2 expression in the stromal tissues. The yellow arrow denotes the weak ABCG2 expression in the normal glands. B) Representative example of ABCG2 in a metastatic tumor: 75% of the tumor cells displayed moderate expression (++). The white arrow denotes normal hepatocytes.
Statistical analysis
The primary endpoint in our analysis was the tumor response to FOLFOX according to the expression level of ABCG2. The group distribution for each clinicopathological trait was compared by the 2-tailed Fisher exact test and the chi-square test. Comparisons of numerical values were performed using Student's t-test. Data are expressed as mean ± standard deviation. Statistical significance was defined as p<0.05. All analyses were performed with SPSS for Windows version 13.0.
Results
The patient population consisted of 31 men (72.1%) and 12 women (27.9%). The mean age of the patients at the time of tumor resection was 64.1±12.1 years (range 30-82 years; median, 65.7 years). The median number of FOLFOX cycles administered was 11 (range 6-34).
Of the 43 patients, at least 50% tumor shrinkage was observed after FOLFOX therapy in 16 patients, including a CR in 1 patient. Eleven patients maintained SD for 6.2±3.4 months. Sixteen patients (37.2%) had PD even while receiving treatment.
The expression pattern of ABCG2 in tumors is described in Tables I and II. Five tumors were negative for ABCG2. Nine tumors exhibited ABCG2 expression in more than 75% of their cells. Twenty-one tumors displayed ABCG2 expression in 25%-75% of their cells, and 8 tumors displayed ABCG2 expression in less than 25% of their cells. Regarding the intensity of ABCG2 expression, 3 tumors had strong expression, 17 had moderate expression, 18 had weak expression, and 5 had no expression. In an analysis combining the intensity of ABCG2 expression and the percentage of tumor cells that expressed ABCG2, an ABCG2 score ranging from 0 to 6 was generated. The definition of high ABCG2 expression was set as a score of 4, and at this threshold, 21 tumors displayed high ABCG2 expression.
Tumor Folfox Response According to Intensity and Percentage of ABCG2 Expression
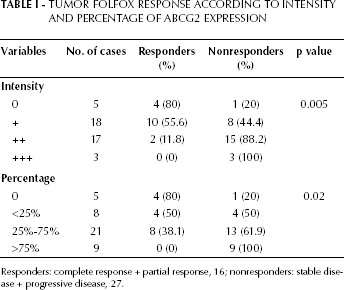
Responders: complete response + partial response, 16; nonresponders: stable disease + progressive disease, 27.
ABCG2 Expression Pattern in Primary Colon Cancer
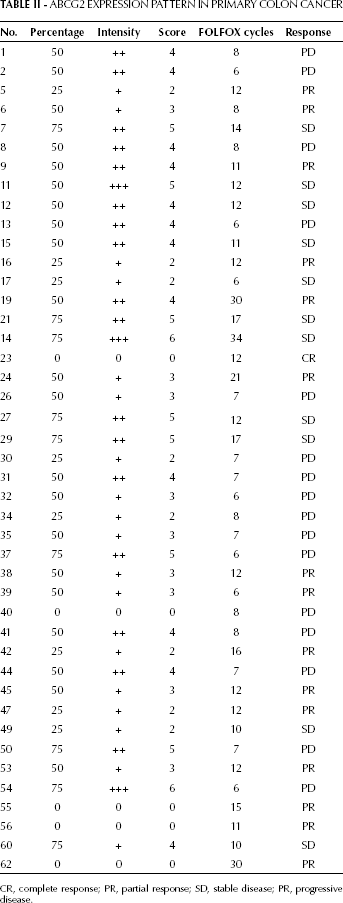
CR, complete response; PR, partial response; SD, stable disease; PR, progressive disease.
Among the 21 tumors with high ABCG2 expression, only 2 (9.5%) showed a PR to FOLFOX; conversely, 63.6% of tumors with low ABCG2 expression (14/22) responded to FOLFOX (p=0.001). As shown in Table I, both the intensity of ABCG2 expression and the proportion of cells that expressed ABCG2 were significantly associated with the tumor response to FOLFOX. In this series, primary tumors and corresponding metastatic samples were obtained from 15 patients, and 13 metastatic tumors had higher ABCG2 expression than the corresponding primary tumors. Of the 13 metastatic tumors with higher ABCG2 expression, only 1 responded to FOLFOX (7.7%).
Discussion
Our results provide clinical evidence that the tumor response to FOLFOX is associated with the expression of ABCG2 in patients with colon cancers.
The expression of ABCG2 in tumors has been assessed by immunohistochemistry, and ABCG2 expression was detected in 21 different cancers including colon cancer (14). According to the definition used in previous studies (14, 15), in our series up to 88% of tumors (38/43) displayed ABCG2 expression. Further, we classified the tumors according to the proportion of cells with ABCG2 expression and the intensity of ABCG2 expression. We found that tumors with high ABCG2 expression were resistant to the FOLFOX regimen, as only 2 tumors (9.5%) exhibited a PR to FOLFOX; conversely, up to 63.6% of tumors with low ABCG2 expression responded to the FOLFOX regimen.
More interestingly, the intensity of ABCG2 expression was more significantly associated with tumor response than the proportion of cells expressing ABCG2 among patients receiving FOLFOX. Previous studies revealed that cancer stem cells can activate ABC transporters, including ABCG2, resulting in the acquisition of resistance to anticancer agents such as 5-FU and irinotecan (16-18). Like a previous study that revealed that ABCG2 was not expressed by fibroblasts (14), our series demonstrated that ABCG2 expression was absent in stromal tissues. In contrast to a previous study indicating that ABCG2 mRNA expression in cancer tissues was 6-fold lower than that in normal colorectal tissues (19), we found that ABCG2 expression was weaker in the normal mucosa than in cancer tissues.
Within our series of 15 sets of matched primary tumors and metastatic tissues, we found that ABCG2 expression was higher in metastatic tissues than in the corresponding primary tissues. Consistent with the relatively low ABCG2 expression level in the normal mucosa, our findings indicated that enhanced ABCG2 expression plays a role in the metastatic progression of colon cancer. However, an inconsistency with previous reports was noted regarding the ABCG2-mediated sensitivity of oxaliplatin. Our results were similar to the findings of Ceckova et al (20), but opposite to those of Theile et al (12). These discrepancies are not well understood, and they need to be analyzed and elucidated in a larger study.
The potential causative factors for the overexpression of ABCG2 are still not clear. Gene amplification or chromosomal rearrangement resulting in transcriptional activation has been observed in several ABCG2-overexpressing cell types (21, 22). In addition, the tumor tissues in our study were obtained from patients who did not receive chemotherapy prior to resection, and thus the overexpression of ABCG2 was not the result of treatment or treatment failure.
There were some limitations to our study. Firstly, in 15/43 cases tissue samples were collected from the metastatic and primary tumor site at surgery and were retrospectively examined. The retrospective samples were not collected from metastatic sites, which may have affected the analysis of a concordance between primary and metastatic tumors. Because there was a discrepancy between primaries and metastatic lesions, a large-scale study comparing the concordance between primary and metastatic tumors is needed. Secondly, tumor shrinkage analysis was only performed in patients who received more than 6 courses of FOLFOX treatment, but the responses of patients who received more than 12 FOLFOX courses are unknown. Thirdly, because some patients also received other types of chemotherapy after the failure of FOLFOX, the survival difference was not analyzed to confirm the prognostic value of ABCG2 in patients with mCRC.
In conclusion, the expression pattern of ABCG2, particularly its intensity, might be an indicator of chemoresistance in patients with mCRC who received FOLFOX. Large cohort studies are needed to confirm the value of ABCG2 in predicting chemoresistance in patients with colon cancer.