
Abstract
The cementation of implant-supported restorations always poses the risk of excess cement retained in the peri-implant sulcus despite careful clinical control. Excess cement can become the basis of colonization by oral microorganisms. As a result of the biofilm formation peri-mucositis or peri-implantitis may develop.
Complications were observed in the routine prosthetic restoration of implants when a methacrylate-based cement was used. These developed a few weeks after cementation of the suprastructure and caused bleeding on probing as well as suppuration from the peri-implant tissue. In the revision therapy, excess cement in the peri-implant sulcus was found in many cases. This excess cement was sampled from ten patients and investigated for biofilm formation. For this purpose, the cement samples were collected and analyzed for bacterial in situ colonization by 16S rDNA-based methods. In laboratory experiments, the methacrylate-based cement and two other dental cements were then investigated for their proneness to form biofilm. The results of the in situ and in vitro investigations revealed a strong tendency towards bacterial invasion of the methacrylate-based cement by opportunistic species and pathogens.
Introduction
The cementation of implant-supported restorations offers a number of advantages compared with screw-retention, especially in view of the esthetic design of the restoration. However, a drawback which is not to be neglected is the risk of excess cement left in the tissue (1-4). Most publications on this subject are contributions suggesting a clinical protocol for the cementation procedure and the subsequent clinical control (5-8). Apart from a few case reports (2, 3, 9), there are very few data on the consequences of excess cement for the peri-implant hard and soft tissue.
According to clinical studies, cement-retained suprastructures are associated with a lower bleeding index and less peri-implant bone loss (10). However, in a study by Wilson the presence of excess cement correlates with the occurrence of sulcus bleeding and/or suppuration (4). In 81% of the cases these clinical signs were diagnosed.
In the scientific literature there are already indications that methacrylate-based materials may promote the formation of a biofilm (11, 12). As Verran et al and Ramage et al reported, both bacteria and Candida have a high adhesion to acrylate-containing dental restorations (13, 14). Thus, bacteria will invade exposed acrylate surfaces within just a few hours, whereas yeasts are found only after a few days (15).
From April 2009 until February 2010, a temporary 2-component methacrylate cement (Premier Implant Cement, Premier® Dental Products Company, Plymouth Meeting, PA, USA) was used by the Karlsruhe Dental Academy for Continuous Professional Development for retaining fixed restorations on implants. Some patients presented again a few weeks or months later and complained about bleeding and suppuration around the implant-supported restorations. To investigate the cause of these problems, the cement-retained restorations were revised including the removal and reattachment of the abutments. In all cases excess cement was found in the peri-implant tissue between the abutment and implant shoulder (Fig. 1).
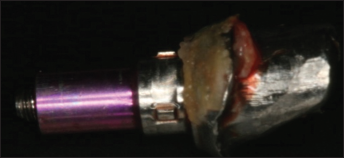
Abutment unscrewed: circumferential excess cement which could neither be removed by instrumentation nor without abutment revision.
When it was removed, the complaints disappeared within a few weeks. After that, the Academy stopped using the methacrylate cement. In order to exclude any additional complications resulting from cement-induced peri-implantitis, all patients who had been treated with the methacrylate cement were re-examined. Within the scope of re-evaluation, the cementation of the fixed restorations was revised in all cases. The abutment was removed, cleaned, and reattached. Cement was found between the abutment and peri-implant tissue in around 59.5% of the implants. When excess cement was present, bleeding on probing was diagnosed in 80% and suppuration in 21.3% of the cases. After removal of the excess cement, bleeding on probing had dropped by 76.9% three to four weeks later (16). In ten cases, cement samples were collected for molecular biological analysis. They were stored frozen until they were analyzed for microbial colonization based on 16S rDNA sequencing (17). In addition to a first analysis already published, the in situ data were re-assessed in connection with an in vitro comparison of Premier Implant Cement (PI) with two other commercial dental cements – Hoffmann's Cement Harvard (HCH) and Temp Bond (TB) – regarding the tendency towards microbial colonization.
Materials and Methods
Investigation of ten revision cement samples
Samples
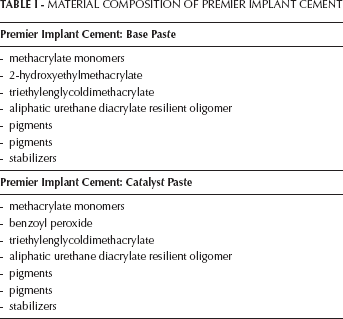
From April 2009 until February 2010, the Karlsruhe Dental Academy for Continuing Professional Development used a methacrylate cement for cementing dental restorations on implants. The methacrylate cement used was a two-component material consisting of a catalyst and a base (Tab. I). After a few weeks or months complications developed in some cases, i.e. bleeding on probing and suppuration. The causes were analyzed, and in all cases excess cement was found in the peri-implant tissue between the abutment and implant shoulder after revision of the restoration including the abutment. The clinical survival time of the restorations before revision was 4 to 14 months.
MATERIAL COMPOSITION OF PREMIER IMPLANT CEMENT
Population analysis
After some clinical complications had developed after cementation with a methacrylate-based dental cement, ten cement samples were taken from the peri-implant sulcus with the patients' consent for a retrospective clinical observational study. The cement samples were stored frozen until molecular biological analysis. The first data already published (17) were re-assessed.
Investigation of three cements under laboratory conditions
Samples
Hoffmann's Cement (HCH), quick setting; zinc phosphate cement
(Hoffmann's Cement, Hoffmann Dental Manufaktur GmbH, Berlin, Germany)
Temp Bond (TB); zinc oxide eugenol cement (Temp Bond, Kerr Sybron Dental Specialities, Glendora, USA)
Premier Implant Cement (PI); methacrylate cement (Premier Implant Cement, Premier® Dental Products Company, Plymouth Meeting, USA)
Environmental Scanning Electron Microscopy
For Environmental Scanning Electron Microscopy (ESEM), the HCH and TB cements were placed as thin layers on microscopic slides. After curing, level pieces of each were transferred to small carbon plates that were bilaterally adhesive and had high bilateral electric conductivity (Plano GmbH, Wetzlar, Germany). Due to the poor drying of PI, this cement was directly applied to the carbon plate. The plates were then glued to an aluminum sample holder (Plano GmbH, Wetzlar, Germany) and analyzed under an ESEM XL 30 FEG (Phillips, Netherlands), voltage 15 kVolt, with a GSE detector.
Test specimen and inoculum
The cements were prepared according to the manufacturers' instruction manuals and then 200 mg ± 5 mg cement material was used to form drops of similar size and surface using a sterile drugs blister package as mold. Four drops of each of the cements were confected. After curing, the drops were transferred to sterile 5 mL tubes.
Synthetic saliva was composed according to Assinder et al (18) and contained (mM) CaCl22H2O (1.0); MgCl2 (0.2); NH4Cl (4.5); KH2PO4 (4.0); HEPES (acid 20); KCl (16). The pH was adjusted to pH 7 with KOH and the solution was autoclaved. 1% Brain Heart Infusion Broth (BHI, Merck, Darmstadt, Germany) as culture medium was added.
Artificial saliva contained two parts of synthetic saliva with 1% BHI and one part of natural saliva collected and pooled from 5 healthy women.
Bacterial growth and preparation
Three of the four cement drops were covered with 3 mL artificial saliva substrate; one drop was covered with synthetic saliva substrate with 1% BHI as a negative control. This was done with all cement test specimens. The tubes were incubated under agitation (150 rpm) at 37°C for 4 h, 24 h, and 48 h. Equivalent volumes of artificial saliva without cement material were incubated as a positive control. Sampling times were 0 h, 4 h, 24 h, and 48 h. According to the sampling times, 1 mL of the suspension was pelleted by centrifugation at 13 000 rpm for 10 min. The supernatant was removed and the pellets were frozen at −20°C until DNA extraction. After removing the rest of the supernatant, the drops were washed two times with 3 mL sterile, PCR-clean water to remove planktonic cells and frozen at minus 20°C. To test the sterility of the drops, 3 mL of sterile synthetic saliva with 1% BHI medium were added to the drops. After 48 h of incubation at 37°C, aliquots of 500 μL were plated on LB-agar (Merck Darmstadt, Germany) and blood agar plates (BioMerieux, Nürtingen, Germany). The plates were incubated at 37°C for 48 h.
DNA extraction
DNA was extracted using commercial extraction protocols for genomic DNA (QIAamp Mini Kit, Qiagen, Hilden, Germany). For the cement drops, the needed volumes were adapted so that the material was completely covered. The drops were treated with 450 μL lysozyme solution (20 mg/ml, Sigma-Aldrich, Taufkirchen, Germany; 20 mM Tris-HCl, pH 8.0, 2 mM EDTA, 1.2% Triton) under rotation at 37°C for 2.75 h, afterwards 50 μL proteinase K and 500 μL AL buffer were added and digestion was carried out for 2.5 h under rotation at 56°C. The collected pellets of the supernatant were treated with 180 μL lysozyme solution (20 mg/ml, Sigma-Aldrich, Taufkirchen, Germany; 20 mM Tris-HCl, pH 8.0, 2 mM EDTA, 1.2% Triton) under shaking at 37°C for 2 h, followed by proteinase K digestion (20 μL proteinase K and 200 μL AL buffer) for 2.5 h under shaking at 56°C. DNA was extracted using commercial extraction protocols for genomic DNA (QIAamp Mini Kit, Qiagen, Hilden, Germany). Finally, the DNA was eluted with 100 μL PCR-clean water and the concentration was photometrically quantified using NanoDrop equipment (PEQLAB, Erlangen, Germany).
PCR amplification and denaturing gradient gel electrophoresis (DGGE)
PCR primers targeting the eubacterial regions of 16S rDNA of bacteria were used. Up to 50 ng DNA served as a template for amplification of an internal fragment of the 16S rDNA coding gene using the primers GC27F (5′-AGA GTT TGA TCC TGG CTC AG-3′) and 517R (5′- ATT ACC GCG GCT GCT GG-3′). The primer GC27F had a GC clamp at its 5′ end (5′ CGC CCG CCG CGC CCC GCG CCC GTC CCG CCG CCG CCC CCG CCC C-3′) (17). The final 25 μL PCR reaction mixture contained 0.625 U of Hot Taq DNA Polymerase (PEQLAB, Erlangen, Germany), 0.5 μL of 40 μM of each primer, 1 × PCR buffer “Y”, 200 μM of each dNTP and template DNA (GeneAmp PCR System 9700; Applied Biosystems, Darmstadt, Germany). Cycling parameters were: initial activation of the polymerase for 1 min at 95°C, 35 cycles 0.5 min at 95°C, 0.5 min at 58°C, 1 min at 72°C, and a final elongation step at 72°C for 7 min. Afterwards, 5 μL of the PCR products were separated on a 1% agarose gel containing ethidium bromide to check the size and amount.
DGGE analysis was performed in a D-Code system (BioRad Laboratories GmbH, Munich, Germany) using polyacrylamide gels containing a gradient of 40% to 70% urea as described by Emtiazi et al (19). About 8 μL to 15 μL of the PCR- products were loaded on the gel. DGGE gels were run in 1X TAE buffer (40 mM Tris, 20 mM acetate, 1 mM EDTA, pH 8.5) at 56°C and 70 V for 16 h. After electrophoresis, the gels were stained with SYBRGold (0.01%v/v; Invitrogen, Karlsruhe, Germany) for 15 min and digitally documented using the LumiImager Workstation and the respective software (Roche Diagnostics, Mannheim, Germany).
Sørensen Similarity Index (Dice coefficient (20))
DGGE fingerprints were scored manually by the presence or absence of bands, independently of intensity. The number of bands corresponds roughly to the number of the bacterial species in the extracted total DNA. Community similarities were calculated in a pair-wise manner using the Dice coefficient:
Cs= 2j (a+b)−1, where j is the number of bands common to samples A and B, and a and b are the total numbers of bands in samples A and B, respectively. This index ranges from 0 (no common bands) to 1 (100% similarity of band patterns).
Sequencing
Dominant bands were excised and equilibrated in 50 μL PCR-clean water at 4°C for 24 h. For re-amplification, 1 μL was used in a total volume of 25 μL. To strengthen the specificity, the re-amplification PCR protocol for dental samples was modified by increasing the annealing temperature to 60°C and for the implants up to 62°C with simultaneous reduction of the number of cycles to 25. The PCR products were controlled by using a 1% agarose gel. The amount of PCR product was estimated and adjusted for sequencing. Single-stranded primers were digested by ExoSAP- IT (GE Healthcare, Freiburg, Germany). For this purpose, 5 μL PCR product was mixed with 2 μL ExoSAP-IT and incubated for 15 min at 37°C and 15 min at 80°C to inactivate the enzyme. The sequencing reaction was performed using the BigDye Terminator v1.1 Cycle Sequencing Kit (Applied Biosystems, Darmstadt, Germany). The sequencing reaction mixture contained 2 μL BigDye pre-mix, 1 μL digested PCR product (adjusted to a DNA concentration of 2.5-8 ng/μL) and 5 μM reverse primer 517R in a final volume of 10 μL. The following temperature protocol was applied: 96°C for 5 min and 25 cycles at 96°C for 10 sec, 55°C for 5 sec and 60°C for 1 min. Surplus ddNTPs were removed by precipitation and then 10 μL sequencing product was mixed with 10 μL PCR-clean water, 2 μL 3 M NaOAc pH 4.6 and 50 μL ethanol abs., stored at room temperature for 1 h and centrifuged for 10 min at 13 000 rpm. The precipitate was washed with 70% ethanol and resuspended in 10 μL PCR-clean water. Finally, 3 μL of the purified sequencing product was mixed with 12 μL HiDi™ Formamide (Applied Biosystems, Darmstadt, Germany) for denaturation of double-stranded DNA. Sequencing was performed in the ABI prism 310 Genetic Analyzer using a 47 cm × 50 μm capillary and the ABI PRISM® 310 performance-optimized POP™-6 polymer (both Applied Biosystems). Sequences were emended with the BioEditSequence Alignment Editor v 7.0.0 (http://www.mbio.ncsu.edu/BioEdit/bioedit.html) and compared to those available in the Gene-Bank database (ncbi) using the BLASTN tool (21). DNA results from 95% to 100% were identified as reliable following the standards of confident classification (22).
RESULTS OF THE MICROBIOLOGICAL ANALYSES
Comparative population analysis based on cement material (PI) collected from the patient cohort
The cement samples (PI) collected after 4 to 14 months of exposure time were frozen at −20°C and after an average storage period of 12 days processed by the laboratory of the Department of Interface Microbiology, Institute of Functional Interfaces, Karlsruhe Institute of Technology (KIT), as described above in the Material and Methods. The results obtained in the population analysis with DGGE and sequencing clearly show patient-related differences in the number of identifiable species (17) (Fig. 2).
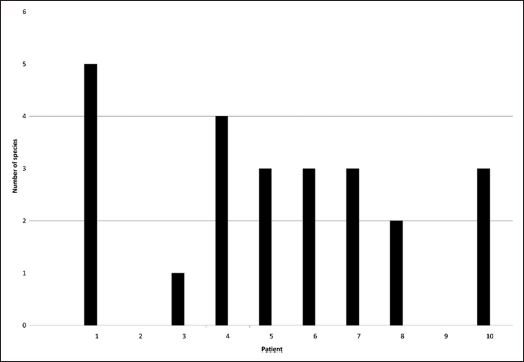
Number of species identified on the cements (PI) of the patient cohort analyzed.
There was a range of 0 to 5 different species identified on the basis of Socransky's scheme (23) with 2 to 3 species on half of the cement samples (Fig. 3).
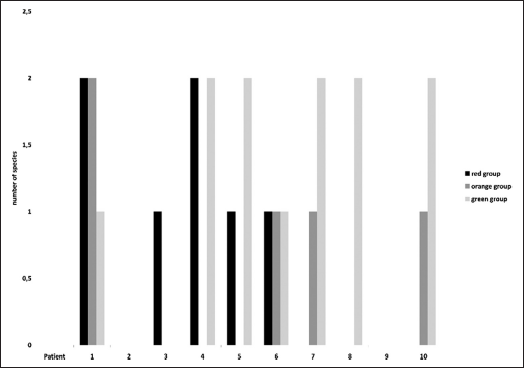
Cluster of species identified following Socransky's scheme (23).
As already mentioned in Obst et al (17), the diversity was even greater when the identified species were clustered according to Socransky's grouping scheme (23).
Pathogenic species were detected on half of the cements collected; opportunistic species were found on four cements (17). Two of the cements tested demonstrated the full range of pathogens, opportunistic species and commensals; on one cement, only commensals; and on two cements, no species at all could be identified (17). The result shows that most of the cements collected from seven patients of the cohort had pathogenic or opportunistic species. The result also shows that – in contrast to pure model tests in the laboratory – the bacterial diversity of the patient cohort plays a significant part (17, 24, 25). Paster et al, Shibli et al, and Kumar et al (26-28) already reported on the individual patient-dependent influence which was confirmed in a comparison of the results mentioned above with those derived from the data of orthopedic implants (17).
Related to the tested cement PI, the above data may be summarized by stating that despite individual diversity, the colonization of pathogenic microorganisms following Socransky (23) dominated on the cement samples tested (17).
Microbiological analyses of three cements under laboratory conditions
In laboratory tests, the PI cement collected in the above-mentioned revision was compared with two other cements often used in dental practice, HCH and TB.
First, the three cements were prepared manually according to the companies' instruction manuals and subjected to an initial optical examination by Environmental Scanning Electron Microscopy (ESEM) (Fig. 4). As shown in Figure 4, the surface of PI cement differs clearly from the more crystalline surfaces of the HCH and TB cements. This also corresponds to the clinical picture of PI which proved in practice to be a low-viscosity material.
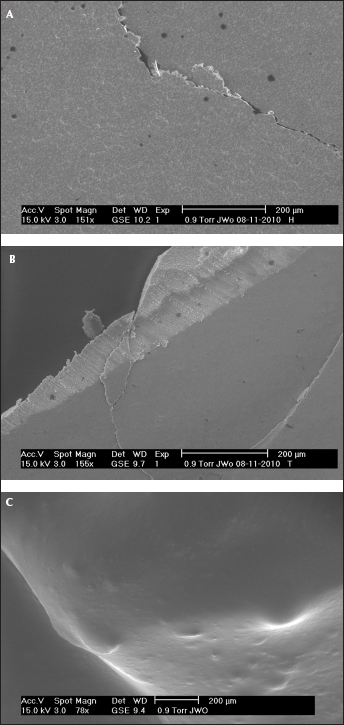
ESEM images of the 3 cements under test. (A) Hoffmann's Cement, (B) Temp Bond, (C) Premier Implant Cement.
After the initial ESEM examination, the three cements were cast in blister packages disinfected with 70% EtOH to obtain test specimens and subjected to microbiological and molecular biological analysis under laboratory conditions; four batches of each cement were prepared. The exposure medium was synthetic saliva; the inoculum was pooled saliva of the lab staff in order to imitate real-life conditions as closely as possible; the culture medium was 1% BHI broth. The exposure periods of the cements HCH, TB, and PI in 3 mL of artificial saliva (synth. saliva + pooled natural saliva + 1% BHI) were 4 h, 24 h, and 48 h at 37°C versus a positive control in 3 mL of artificial saliva without cement drop and a negative control consisting of cement drop and 3 mL of synthetic saliva with 1% BHI broth without pooled saliva. Samples were taken after 0 h, 4 h, 24 h and 48 h to determine the eubacterial DNA concentration according to the microbial colonization.
Figure 4 shows the DNA concentration already standardized against the initial value (0 h) (=microbial colonization) in the supernatant of the batches. The positive control without cement demonstrates a steady increase in microbial colonization resulting in a DNA-concentration up to about 100 mg/ml. The supernatant of the HCH cement approximately follows this scheme. The supernatant of the TB cement shows an entirely different picture: after 4 h already the DNA concentration had declined significantly to about 23% of the concentration of the positive control, after 48 h to 7% of the concentration of the positive control. Possibly this cement contains an agent inhibiting microbial reproduction (eugenol). The DNA concentration in the supernatant of the PI cement remained more or less constant during the whole of the incubation period, and thus also clearly differed from the positive control without cement.
Another impression is given in Figure 5 where the bacterial colonization on the cement surfaces is shown. For the whole of the incubation period, the DNA concentration on the HCH cement remained at a level of about 4% of the concentration of the control and the concentration of the cement supernatant (Fig. 4). This result can be interpreted to show that most of the developing microflora remained in the supernatant (i.e., in the saliva) and did not colonize the cement as a biofilm.
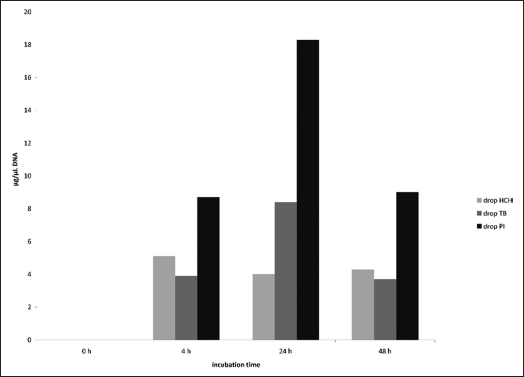
DNA concentration on the cement test specimens incubated in artificial saliva (synthetic saliva + pooled natural saliva + 1% BHI at 37°C during 48 h of incubation.
The TB cement demonstrated a similar colonization of about 4% of the control concentration, but had a peak of 8% of the control concentration after 24 h which returned to the 4-h level after 48 h. Compared with the HCH cement and contrary to the supernatant (Fig. 4), no direct inhibition of the microflora development was recognized on the surface of the TB cement. Possibly the inhibiting agent was more likely to be found in the soluble phase.
The course of the DNA concentration on the PI cement considerably differed from that of the other cements. The PI cement reached values between about 8% and 18% of the positive control concentration showing that a much larger part of the microflora colonized the PI cement as biofilm than was the case for the other two cements. This agreed with the experiences in vivo. Like the TB cement, the PI cement also reached a clear colonization peak after 24 h and returned to the 4-h level after 48 h, an observation which cannot be explained at present.
A population analysis of the DNA concentrations on the cement drop surfaces shown in Figure 5 was then made by DGGE the results of which are presented in Table II. The DNA band pattern created on the gels by DGGE was compared for similarities with the positive control artificial saliva (synthetic saliva + pooled natural saliva + 1% BHI broth) using the DICE index (20). Maximum similarity equals Dice index 1.0, while zero similarity equals Dice index 0.0.
DICE INDICES OF POSITIVE CONTROL ARTIFICIAL SALIVA, SUPERNATANTS, AND CEMENT TEST SPECIMENS AFTER DIFFERENT INCUBATION TIMES
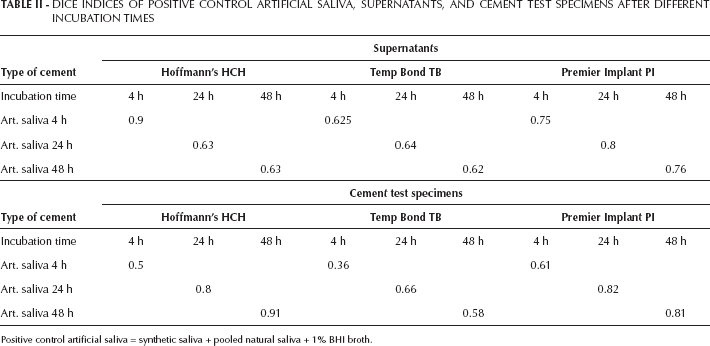
Positive control artificial saliva = synthetic saliva + pooled natural saliva + 1% BHI broth.
There were relatively strong similarities between the microflora in the supernatants of the three cements tested and the microflora of the positive control. For HCH, there was still an almost complete agreement after 4 h, which leveled out at a Dice coefficient of around 0.6 after 24 h. This means that part of the inoculated species only colonized the cement test specimens after 4 h to 24 h. The TB cement only showed a medium similarity of about 0.6 Dice coefficient to the original inoculum after 4 h. This may be explained by the inhibitory effect of cement ingredients in the supernatant already mentioned (Fig. 6). The PI cement demonstrated a relatively strong similarity to the inoculum already after 4 h (Dice coefficient 0.75-0.8), showing that a large part of the inoculated species could survive or even multiply in the supernatant.
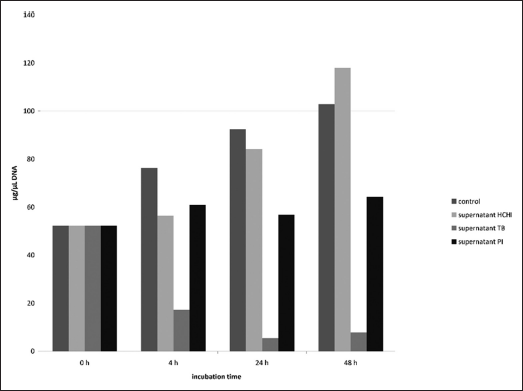
DNA concentration in supernatants of cement test specimens incubated in artificial saliva (synthetic saliva + pooled natural saliva + 1% BHI broth) at 37°C during 48h incubation time.
On the HCH cement, the similarities of the microflora colonizing the test specimens (Tab. II) increased in the course of the incubation period and indicated the growing colonization of the cement surface. These results agree with the results from the HCH supernatant, which demonstrated a declining similarity with time, i.e., an increasing adherence to the solid body. The TB cement surface showed a moderately rising but still lower level of similarity to the original inoculum after 4 h to 24 h. These data confirm the generally inhibiting effect of cement ingredients on the microflora as observed in the TB cement. The surface of the PI cement showed the greatest similarity to the original inoculum from the start of incubation, which also balanced out at a relatively high level (Dice coefficient of about 0.8). This confirms the early and permanent colonization by many or most species from the original inoculum.
The microflora from supernatants and on the cement surfaces already analyzed for taxonomic similarities was then sequenced. For this purpose, the extracted DNA was again separated and significant bands were sequenced using the method specified in Materials and Methods, and classed taxonomically by data base. The results are presented in Table III.
TAXONOMIC IDENTIFICATION OF THE MICROFLORE FROM SUPERNATANT AND CEMENT TEST SPECIMENS
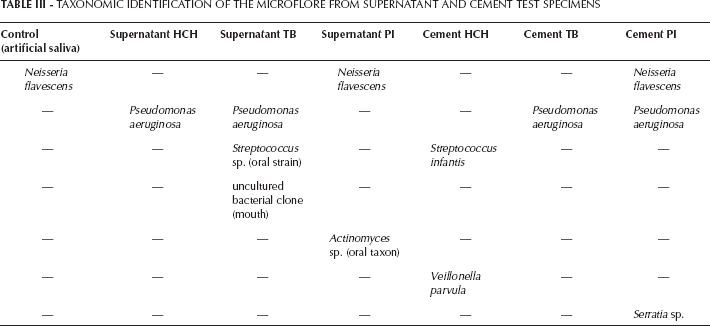
They differed somewhat from the band pattern comparison (see above). However, it must be noted here that, first, only the DNA after 48 h of incubation was analyzed and that, secondly, the DNA separation had to be repeated several times before sequencing because of the great analytical difficulties, so that the two results (Dice index and taxonomy) are not fully comparable. The great diversities that were already observed in the revision examinations in situ (17) were also confirmed in vitro. Thus, in the control (artificial saliva) only Neisseria flavescens was identified, though in four distinct bands. Pseudomonas aeruginosa was found relatively often in both supernatants and on cement surfaces, but not in the same cement specimens. Besides Staphylococcus species (29, 30), Pseudomonas aeruginosa is one of the best known biofilm producers (31), so that its presence on cement was not surprising. As shown in Table II, the HCH and TB cements had relatively little similarity to the inoculum, which may be due to inhibitions and/or selections of individual species. Concerning its similarity to the inoculum, the PI cement again played a special role in the sense that it was the only cement that showed the same taxon as the control both in the supernatant and on the cement surface. This corroborated the results already obtained in similarity analysis.
Discussion
The clinical findings in the revision of the prosthetic restorations retained by methacrylate cement (PI) were characterized by clear signs of inflammation. When excess cement was present in the peri-implant tissue, bleeding on probing was observed in 80% and suppuration in 21.3% of the cases (16). In a study, Wilson arrived at approximately the same results (4). The analysis of the collected cement samples in the laboratory confirmed the rapid and permanent colonization of the PI cement by microbial species from the environment, e.g. the saliva. The cement samples collected in the revision therapy also showed that primarily pathogenic and opportunistic species (Socransky scheme (23)) were detected on the cement samples. This is corroborated by the comparative analyses of the PI cement and two other commercial cements (HCH and TB) under laboratory conditions, showing that the PI cement was preferably colonized by microorganisms from the artificial saliva added. Neisseria flavescens, the bacterium identified in the laboratory tests, belongs to the so-called early colonizers (32) and underlines the preferential colonization of the PI cement. Methacrylate-based dental materials promote the formation of biofilms (12) due to the high adherence of bacteria and Candida to acrylic surfaces (13, 14). The physical properties of the PI cement seem to be additional risk factors (33, 34). The low viscosity presumably promotes the spreading of the cement in the peri-implant sulcus, which makes it more difficult to remove the cement film and might be the cause of the unusually high prevalence of excess cement. In all, excess cement was found around 59.5% of the implants in the revision (16). The electron-microscopic images confirm these assumptions. In comparison to the HCH and TB cements, PI has a very homogeneous and smooth surface (Fig. 4). HCH and TB appear to be far more crystalline.
The chemical (methacrylate base) and physical (viscosity) properties of the PI cement apparently intensified biofilm formation in the peri-implant sulcus. It appears that the colonization and reproduction of pathogens and opportunistic species present in the saliva was intensified. As a consequence, inflammation in the form of bleeding on probing and suppuration developed around the implants (16) to a high degree. These findings clearly contrast with the results of the TB cement in the laboratory test, where a distinct inhibition and/or selection of the inoculated microflora was observed (Fig. 5, Tab. III). This type of cement was used for recementation of the suprastructures on the implants after revision. In the follow-up examination three to four weeks after revision, the bleeding index had dropped by 76.9% (16). The clinical findings of the revision therapy and the follow-up examination support the assumptions derived from the comparative tests of the PI and TB cements under laboratory conditions.
Conclusions
The results presented in this study prove once more that the chemical and physical properties of dental materials have a significant influence on bacterial colonization. Therefore, dental cements with low bacterial adhesion and optimum flow characteristics should be developed in future to minimize the risk of excess cement left in the tissue. Moreover, excess cement in the peri-implant sulcus should generally be avoided or completely removed.
Footnotes
Acknowledgements
We thank Jonas Wohlgemuth/KIT for support during ESEM analytics of the cement samples.
Financial support: We thank the Helmholtz Association for supporting our study as part of the BioInterfaces program.
Conflict of interest: The authors declare that there are no conflicts of interest.