
Abstract
Background
This study was to investigate the differential mitochondrial protein expressions in human lung adenocarcinoma and provide preliminary data for further exploration of the carcinogenic mechanism.
Methods
Total proteins of A549 and 16HBE mitochondria were extracted through 2D polyacrylamide gel electrophoresis (2-DE). The differential mitochondria proteins were identified by liquid chromatography–tandem mass spectrometry (LC-MS/MS) and were further confirmed by Western blot, immunoelectron microscopy and immunohistochemistry (IHC) in A549 cells as well as lung adenocarcinoma tissues.
Results
A total of 41 differentially expressed protein spots were found in A549 mitochondria. Of them, 15 proteins were highly expressed and 26 proteins were lowly expressed in the mitochondria of A549 (by more than 1.5 times). Among the 15 more highly expressed proteins, AAA-TOB3 (by more than 3 times) was highly expressed in the mitochondria of A549 compared with the 16HBE, by LC-MS/MS identification. High electron density and clear circular colloidal gold-marked AAA-TOB3 particles were observed in the A549 cells via immunoelectron microscopy. Besides, AAA-TOB3 was confirmed to be elevated in lung adenocarcinoma by Western blot and IHC. Moreover, increased AAA-TOB3 correlated with lymph node metastasis and advanced stage of lung adenocarcinoma (p<0.05).
Conclusions
AAA-TOB3 was highly expressed in lung adenocarcinoma, and the up-regulation of AAA-TOB3 correlated with lymph node metastasis and advanced stage of lung adenocarcinoma, which suggested that it could serve as a potential molecular marker for lung adenocarcinoma.
Introduction
Lung cancer is the most frequent cause of cancer-related deaths worldwide. Every year, 1.8 million people are diagnosed with lung cancer, and 1.6 million people die because of this disease. Five-year survival rates vary from 4% to 17% depending on stage and regional differences (1). The 2 major forms of lung cancer are non-small cell lung cancer (NSCLC) and small cell lung cancer (2). Lung adenocarcinoma (LAC) of NSCLC is the most common type of lung cancer and accounts for 30% to 35% of primary lung tumors (2). The high mortality of LAC is partly due to the late diagnosis of the majority of lung cancers after regional or distant spread of the cancer cells (2). However, researchers agree that patients who are diagnosed at an early stage have a high overall 5-year survival. Therefore, early diagnosis of LAC is critical for decreasing lung cancer mortality.
Research shows that the application of proteomics technology has contributed to the early diagnosis and treatment of lung cancer (3). Mitochondria are cellular powerhouses that synthesize most of the adenosine triphosphate in eukaryotic cells (4). Mitochondria also serve crucial functions in the metabolism of amino acids and lipids, biosynthesis of heme and iron-sulfur clusters, cell signaling and apoptosis (4, 5). The use of quantitative techniques and differential analysis to observe the different expression levels of mitochondrial proteins under physiological and pathological conditions has become the focus of mitochondrial proteomics research (6). However, research into the differential mitochondrial proteomics in human LAC and their significance is considerably limited. The aim of this study was to investigate the differential mitochondrial protein expressions in human LAC and disclose their clinical significance.
Methods
Cell lines and cell culture
A549 human LAC cells were purchased from the Central Laboratory of Xi'an Jiaotong University, and the 16HBE normal human bronchial epithelial cell lines were purchased from Beijing Jin Zijing Biotechnology Pharmaceutical Co. Ltd. The cells were cultured at 37°C in 5% CO2 in RPMI 1640 medium (Sigma) with 10% fetal bovine serum (Zhejiang Tianhang Bio-Technology Co. Ltd.). After collecting the cells that had grown to the logarithmic phase, the experiments were performed.
Patients
This study was approved by the Research Ethics Committee of the Second Affiliated Hospital, Xi'an Jiaotong University (Xi'an, China) and the First Affiliated Hospital of Xi'an Medical University (Xi'an, China). Written and informed consent was attained from every patient. From January 2014 to December 2015, a total 60 primary lung cancer patients were enrolled in the study (at the Second Affiliated Hospital, Xi'an Jiaotong University, Xi'an, China, and the First Affiliated Hospital, Xi'an Medical University, Xi'an, China). We collected the fresh cancer tissues and the matched adjacent normal tissues from these patients (mean age 63 ± 2.7 years), and the latter served as the normal controls in the study. After removing tumor mass by surgery, we carefully separated the cancer-adjacent normal tissues from the cancer tissues. It had to be ensured that the distance between the edge of the cancer-adjacent normal tissues and the tumor tissues was greater than 3 cm to avoid contamination of cancer cells. The tissue samples of patients were gathered before chemotherapy and surgery. All patients were divided into different groups according to different clinical features (shown in detail in Tab. I).
Clinicopathological features of patients included (N = 60)
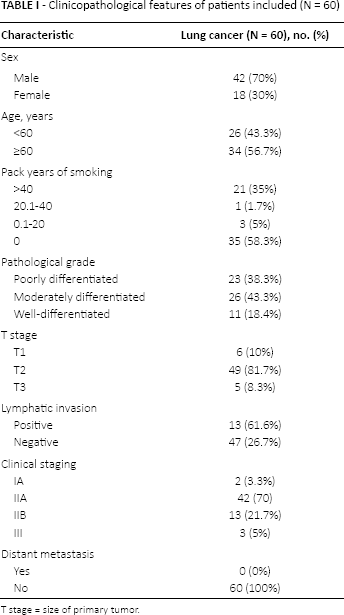
T stage = size of primary tumor.
Pathological studies and tissue microarray construction
We marked morphologically representative tumor areas to construct the tissue microarray (TMA) of lung cancer samples, and to avoid necrotic areas and areas in which cancer cells and stromal cells intermingled. The TMAs were constructed using a tissue array instrument (Manual Tissue Arrayer; Beecher Instruments, USA) according to a method previously described (7). The array block was sectioned and leveled, and was treated with routine hematoxylin and eosin (H&E) staining and immunohistochemistry (IHC).
Mitochondrial fractionation and protein extract
Mitochondria were isolated with a mitochondrial isolation kit (Thermo Scientific) according to the manufacturer's instructions. Briefly, the cells added with 800 μL of mitochondria isolation reagent A were homogenized on ice, and were centrifuged at 800 g for 10 minutes at 4°C. The supernatant was collected and was further centrifuged at 12,000 g for 5 minutes at 4°C. Removing the the supernatant, we collected the pellets containing the isolated mitochondria and mixed them with mitochondrial isolation reagent B. After that, we added 100 μL of mitochondrial isolation reagent C per 10 μL of mitochondria. The mixture was vortexed and vibrated for 30 minutes at 4°C, and then centrifuged at 10,000 g for 15 minutes at 4°C. The supernatant containing the total extracted proteins was transferred, and the Bradford method was used to quantify the proteins.
2D polyacrylamide gel electrophoresis (2-DE)
Protein samples (50 μg) were applied to immobilized pH gradient (IPG) strip (7 cm). Dithiothreitol (DTT) was added at a final concentration of 50 mM to 0.8% IPG buffer. A hydration fluid was used to fill the volume to 125 μL, and isoelectric-focusing programs were set. The strip was immediately balanced on the end of the focusing program. The second sodium dodecyl sulfate–polyacrylamide gel electrophoresis (SDS-PAGE) was performed to remove the bromophenol blue indicator from the strip, and silver staining was further performed. The TIF diagram was scanned and saved for analysis. ImageMaster 2D platinum 5.0 software was used for electrophoretic diagram analysis.
In-gel digestion
The gel-spot samples were washed, and ultrasound de-staining was performed. The enzyme stock solution was diluted (0.1 μL/μL) 10 times with 25 mM NH4HCO3 and added to each Eppendorf tube at 2 μL. The solution was centrifuged slightly to allow full contact between the enzyme solution and the gel spots. The solution was placed on ice for 30 minutes until the solution was completely absorbed by the gel spots. Subsequently, 25 mM of NH4HCO3 was added to reach a total volume of 10 μL, and the sample was digested overnight at 37°C. To terminate the reaction, 1% trifluoroacetic acid (TFA) was added. The final TFA concentration was 0.1%, and the sample was vortexed and centrifuged. The supernatant was then subjected to LC-MS/MS.
LC-MS/MS analysis and protein identification
Samples (10 μL) were injected into the LC-MS/MS detection machine. The specific instrument model and parameters were as follows: mass spectrometry: MicroTOF-QII (Bruker Daltonics); data collection software: MicroTOF control (Bruker Daltonics); MS/MS scan range: 50 m/z to 2,200 m/z; and data search: the Mascot search engine version 2.3.01. After the mass spectrometric data was extracted, the peaks were marked by data analysis software and searched using MASCOT. All proteins identified must have ≥95% confidence with at least more than 1 peptide above the 95% confidence level. A p value <0.05 was considered to be significant in statistics.
Immunoelectron microscopy
Post embedding, immunocolloidal gold technology was applied. The sections were placed on nickel mesh (G300-Ni) and were incubated with polyclonal rabbit anti-human ATPase family AAA domain–containing protein 3B (AAA-TOB3; dilution 1:100; LSBio) at room temperature for 3 hours and stored overnight at 4°C. The primary antibody of the control group was replaced with the dilution. The sections were rinsed with Tris-buffered saline (TBS) at pH 7.4 and again with TBS at pH 8.2, and were incubated with 10 nm of colloidal gold-labeled goat anti-rabbit IgG (dilution 1:20; Boster, China) at room temperature for 3 hours. The sections were stained using uranyl acetate and lead citrate, and were observed and photographed under H-7650 transmission electron microscope. The accelerating voltage was 80 kV. The distribution of colloidal gold particles in the mitochondria was observed under electron microscopy.
Western blot
The purified proteins (60 μg) were separated by 10% SDS-PAGE and were transferred to a polyvinylidene difluoride membrane. The blots were incubated for 2 hours at room temperature in TBST buffer (20 mM Tris-CI, 140 mM NaCl, pH 7.5, 0.05% Tween-20) containing 5% skim milk, and were incubated with polyclonal rabbit anti-AAA-TOB3 antibody (dilution 1:300; ThermoFisher) overnight at 4°C. After washing with TBST 4 times, the membranes were incubated with the secondary antibody for 2 hours at 37°C. The blots were developed using enhanced chemiluminescence detection reagent and quantitated through the gray scale method using Image J. β-Actin was simultaneously detected as the loading control.
Immunohistochemistry
The expression of AAA-TOB3 was determined using an S-P combination of IHC techniques (Ultrasensitive S-P Rabbit; Zhongshan Jinqiao Biotech Company, Beijing, China). The IHC was performed rigidly according to the instructions of the manufacturers and also as learned from a method previously described (3). The first antibody was rabbit anti-human polyclonal antibody of AAA-TOB3 (dilution 1:100; LSBio). The positive slices stained by manufacturers served as the positive control sample, and phosphate-buffered saline (PBS) instead of the first antibody was used as the negative control. Two experienced pathologists independently assessed the immunostaining of AAA-TOB3 according to a scoring method previously described (3). Briefly, each sample was observed and calculated according to the intensity and area of staining, which was divided into 4 degrees: 0, 1+, 2+ and 3+. A combined staining score (intensity + area) of ≤2, or 3 to 4, or 5 to 6 was considered as low expression, moderate expression and high expression, respectively.
Statistical analysis
SPSS 19.0 statistical software was used for the statistical analysis. The Western blot (WB) difference between groups was calculated by the t-test. The IHC differences between groups were analyzed by chi-square test. Differences were considered statistically significant when p was <0.05.
Results
Identification of differential mitochondrial proteins between A549 and 16HBE cells
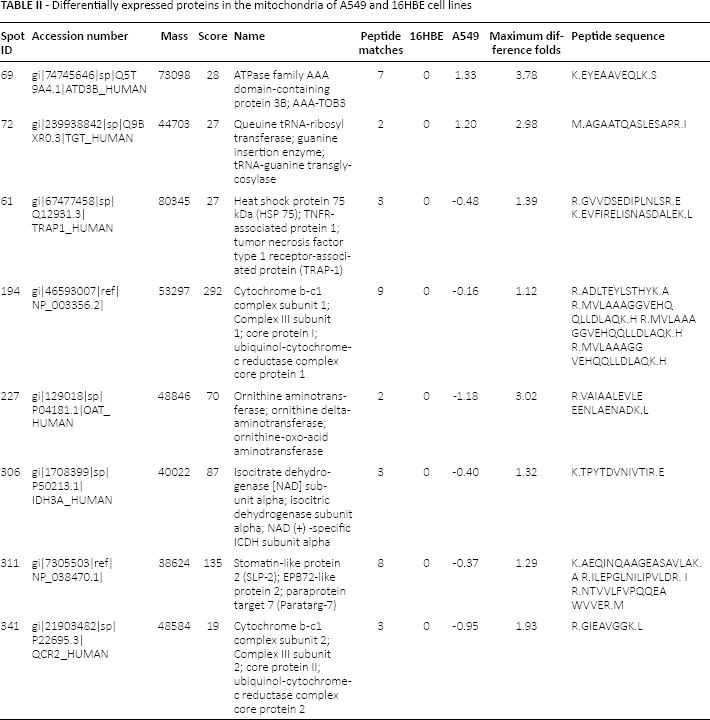
Comparative analysis of the 2-DE mitochondrial protein patterns of A549 and 16HBE cells revealed different protein expression profiles between the 2 cells (Fig. 1A, B). A total of 41 proteins were found to be differentially expressed. Of them, 15 proteins were highly expressed (by more than 1.5 times) and the other 26 proteins were lowly expressed in the mitochondria of A549. Compared with the mitochondria of 16HBE cells, LC-MS/MS revealed that in the mitochondria of A549, 2 proteins were highly expressed and 6 proteins were lowly expressed. Among them, AAA-TOB3 (by more than 3 times) and tRNA-guanine transglycosylase (by more than 2.5 times) were highly expressed in the mitochondria of A549 compared with the 16HBE. Six proteins that were lowly expressed were also identified, as follows: HSP75, Complex III subunit 1, Complex III subunit 2, OAT, ICDHα and SLP-2 (shown in detail in Tab. II).
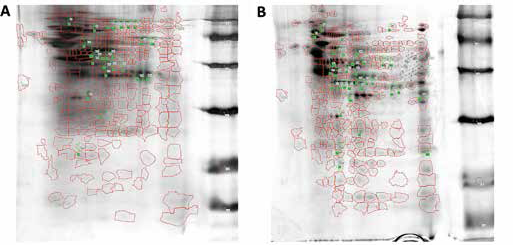
Mitochondrial protein profiles: A549 vs. 16HBE. (A) Comparative analysis with 2-dimensional polyacrylamide gel electrophoresis (2-DE) of mitochondrial protein patterns of A549 cells. (B) Comparative analysis of the 2-DE mitochondrial protein patterns of 16HBE cells revealed a different protein expression profile between the 2 cells. A total of 41 differentially expressed protein spots were revealed. Fifteen proteins were highly expressed and the other 26 proteins were lowly expressed in the mitochondria of A549.
Differentially expressed proteins in the mitochondria of A549 and 16HBE cell lines
Expression of AAA-TOB3 was significantly elevated in A549 cells
We used immunoelectron microscopy to evaluate the cellular distribution and expression of AAA-TOB3 in A549 and 16HBE mitochondria. Compared with the immunolabeling in 16HBE cells, high electron density and clear circular colloidal gold-marked AAA-TOB3 particles were observed in the A549 cells as small clumps or dots, which were distributed in the mitochondria, rough endoplasmic reticulum, Golgi apparatus, cytoplasm and nucleus of the A549 cells (Fig. 2A-F). Moreover, Western blot analysis showed that the expression level of AAA-TOB3 was significantly up-regulated in A549 (Fig. 2G), compared with in 16HBE cells. Quantitatively, the AAA-TOB3 expression in the A549 cell mitochondria was significantly higher than that in 16HBE (4.64 ± 1.92 vs. 3.26 ± 1.81; p = 0.005) (Fig. 3G).
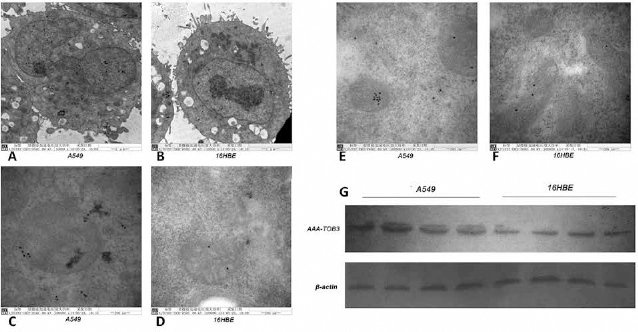
Identification of AAA-TOB3 in mitochondria of A549 and 16HBE cells via immunoelectron microscopy and Western blot. (A-F) Compared with the immunolabeling in 16HBE cells, high electron density and clear circular colloidal gold-marked AAA-TOB3 particles were observed in the A549 cells as small clumps or dots, which were distributed in the mitochondria, rough endoplasmic reticulum, Golgi apparatus, cytoplasm and nuclei of the A549 cells. (G) Western blot analysis showed that AAA-TOB3 was up-regulated in A549 cells compared with 16HBE cells (p<0.05).
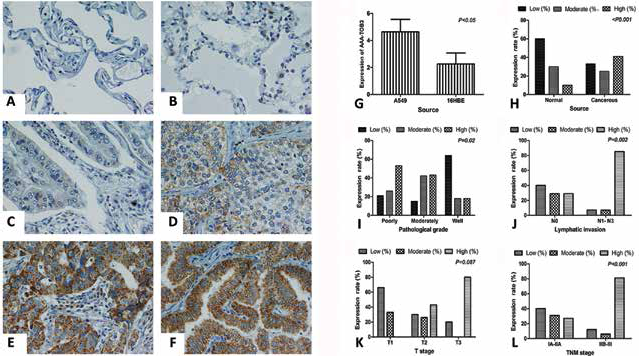
Immunohistochemical staining of AAA-TOB3 in lung adenocarcinoma tissues and the relationship between the expression of AAA-TOB3 and clinical features of lung adenocarcinoma patients. (A) Low staining of AAA-TOB3 in normal lung tissues (×400); (B) high staining of AAA-TOB3 in normal lung tissues (×400); (C) low staining of AAA-TOB3 in well-differentiated lung adenocarcinoma (LAC) (×400); (D) moderate staining of AAA-TOB3 in moderately differentiated LAC (×400); (E) high staining of AAA-TOB3 in pooly differentiated LAC (×400); (F) high staining of AAA-TOB3 in well-differentiated LAC (×400). (G) Increased protein levels of AAA-TOB3 in LAC A549 cells compared with 16HBE cells (p<0.05); (H) increased level of AAA-TOB3 in LAC tissues vs. in normal lung tissues (p<0.05); (I) Well-differentiated LAC tissues showed a low AAA-TOB3 expression compared with the moderate and poorly differentiated tissues (p<0.05); (J) patients with lymphatic invasion revealed increased level of AAA-TOB3 vs. those with no lymphatic invasion (p<0.05); N = node stage (TNM classification). (K) Expression of AAA-TOB3 did not correlate with the T stage of LAC (p = 0.087); T = size of tumor (TNM classification). (L) Patients with stages IIB-III displayed higher AAA-TOB3 expression, vs. those with stages IA-IIA (p<0.05).
Expression of AAA-TOB3 significantly elevated in lung adenocarcinoma tissues
To confirm the expression trend of AAA-TOB3, we performed IHC in a series of 60 human lung adenocarcinoma tissues. The IHC staining of AAA-TOB3 is shown in Figure 3A-F. We found cytoplasm of lung adenocarcinoma cells displayed a brown and yellow staining for the AAA-TOB3 signal. As shown in Figure 3H, the high expression of AAA-TOB3 in lung adenocarcinoma tissues was 41.7% (25/60), but was 10% (6/60) in normal lung tissue (p<0.05) (Tab. III), which indicated that the expression of AAA-TOB3 in lung adenocarcinoma was significantly higher than that in normal tissues (p<0.05).
Correlation between clinicopathological features and expression of AAA-TOB3 in lung adenocarcinoma (N = 60)
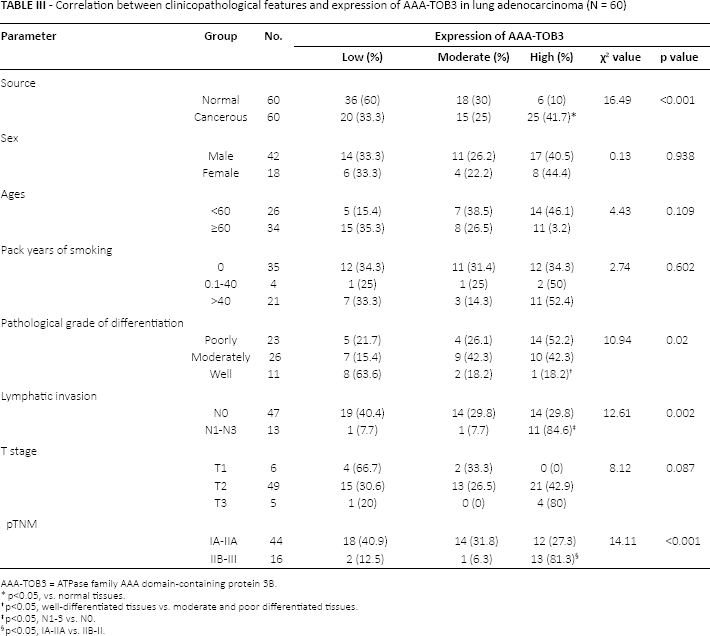
AAA-TOB3 = ATPase family AAA domain-containing protein 3B.
p<0.05, vs. normal tissues.
p<0.05, well-differentiated tissues vs. moderate and poor differentiated tissues.
p<0.05, N1-3 vs. N0.
p<0.05, IA-IIA vs. IIB-II.
Relationship between expression of AAA-TOB3 and clinical features of lung adenocarcinoma patients
As shown in Table III, the expression of AAA-TOB3 was irrelevant for sex, age and smoking history of NSCLC patients (p>0.05). However, well-differentiated lung adenocarcinoma tissues (18.2%) showed a low expression level compared with the moderate and poorly differentiated tissues (42.3% and 52.2%, respectively; p = 0.02) (Fig. 3l). In addition, overexpression of AAA-TOB3 was observed in cancer tissues with lymph node metastasis (84.6%), but not in those without lymph node metastasis (29.8%; p = 0.002) (Fig. 3J). Moreover, the expression of AAA-TOB3 did not correlate with the T stage of lung adenocarcinoma (p = 0.087) (Fig. 3K). Nevertheless, patients with stages IIB-III (81.3%) displayed a higher AAA-TOB3 expression, as compared with those with stages IA-IIA (27.3%; p<0.001) (Fig. 3L).
Discussion
As one of the most common malignancies worldwide, lung adenocarcinoma shows an increasing incident rate and remains a major health problem (1, 8). Thus, there is an urgent need to identify novel molecular targets for diagnosis, prognosis and treatment of lung adenocarcinoma. Proteomics is helpful for promoting the prevention and cure of cancer because it provides unique tools for high-throughput screening of biomarkers and therapeutic targets (9). However, many different kinds of proteins exist in a cell. The separation and detection of the total cellular proteins are difficult with conventional proteomics methods. Subcellular proteomics is growing as an effective solution for this deficiency (9).
In the present study, the cell mitochondria of A549 and 16HBE were isolated using a mitochondrial fractionation kit. The total proteins of the mitochondria were extracted and subjected to 2-DE. LC-MS/MS was utilized to identify the differential proteins. We found 8 differentially expressed proteins in A549 and 16HBE (2 high expression proteins and 6 low expression proteins). Of them, 6 proteins that were lowly expressed were identified – as follows: HSP75, Complex III subunit 1, Complex III subunit 2, OAT, ICDHα and SLP-2. Excitedly, AAA-TOB3 was remarkably up-regulated in the mitochondria of lung adenocarcinoma cells. ATPase family AAA-Domain containing protein 3 (ATAD3) is a mitochondrial inner membrane ATPase with unknown but vital functions. Now, some smaller isoforms of ATAD3 were also detected in a tissue-specific manner. In humans and primates, ATAD3 paralogues are encoded by 3 genes (ATAD3A, 3B and 3C), each presenting several putative variants (10). AAA-TOB3 is encoded by the ATAD3B gene and belongs to the AAA ATPase family. In our investigation, AAA-TOB3 displayed a high expression level in mitochondria of lung adenocarcinoma cells. To confirm this result, we further performed a detailed analysis of AAA-TOB3 by immunoelectron microscopy, Western blot and IHC.
In our study, the analysis of immunoelectron microscopy showed that high electron density and clear circular colloidal gold-marked AAA-TOB3 particles were observed in the A549 cells (as small clumps or dots), which were distributed in the mitochondria, rough endoplasmic reticulum, Golgi apparatus, cytoplasm and nucleus of the A549 cells. This result indicates that AAA-TOB3 plays an important role in mitochondria of lung adenocarcinoma cells. Moreover, Western blot analysis and protein quantification also testified that AAA-TOB3 had a higher expression in the mitochondria of lung cancer A549 cells than in 16HBE. Thus, this give us a clue that increased AAA-TOB3 expression is possibly involved in carcinogenesis and progression of lung adenocarcinoma. Research shows that AAA-TOB3 interacts with the components of mitochondrial ribosomes, including MRPL11 and MRPS18B; it also interacts with other proteins involved in mitochondrial RNA metabolism possibly via interaction with ATAD3A, and also interacts with GADD45GIP1 (11, 12).
To disclose the relationship between the expression of AAA-TOB3 and clinical features of lung adenocarcinoma, we performed IHC for the expressions of AAA-TOB3 in a series of 60 human lung adenocarcinoma tissues. We found that lung adenocarcinoma tissues displayed a higher expression of AAA-TOB3 than normal lung tissues, which indicated that the high expression of AAA-TOB3 in lung adenocarcinoma was associated with the occurrence of lung adenocarcinoma (p<0.05). Further, we noticed that higher expression of AAA-TOB3 was observed in poorly differentiated tissues, cancer tissues with lymph node metastasis and advanced lung adenocarcinoma. This result suggested that increased expression of AAA-TOB3 contributes to the progression and metastasis of lung adenocarcinoma and is more likely to imply a possibility that the level of AAA-TOB3 could serve as a predictive factor for emergence of lung adenocarcinoma and promise a new tool for diagnosis of lung adenocarcinoma. AAA-TOB3 may serve a function in a mitochondrial network organization that is typical of stem cells. AAA-TOB3 is characterized by reducing mitochondrial metabolism, low mtDNA copies and fragmented mitochondrial network. This protein may act by suppressing ATAD3A function, thereby interfering with ATAD3A interaction with matrix nucleoid complexes (11). ATAD3 knockdown in different nontransformed cell lines is associated with drastic changes in the mitochondrial network, inhibition of proliferation and modification of the functional interactions between mitochondria and endoplasmic reticulum. ATAD3 may be implicated in an essential and growth-linked mitochondrial function and involved in tumorigenesis (13).
From our study, we deduce that AAA-TOB3 has a potential to become a useful marker for lung adenocarcinoma and may contribute to early diagnosis of lung adenocarcinoma and metastasis and recurrence monitoring. However, there is still much work to be done before AAA-TOB3 can be used for the diagnosis and treatment of lung cancer in clinical practice.
There are several limitations to this study. First, it was carried out in 2 research institutes in China, which may not represent the features of the wider population. Second, the study did not sufficiently assess the difference in AAA-TOB3 levels between early and advanced lung cancer (I-II stage). Therefore, investigations designing larger samples of patients with lung cancer are still needed to get more solid conclusions.
Conclusions
In the present study, AAA-TOB3 was confirmed to be elevated in lung adenocarcinoma, and increased AAA-TOB3 correlated with lymph node metastasis and advanced stage of lung adenocarcinoma, which suggested that it could serve as a potential molecular marker for the diagnosis and prognostic prediction of lung adenocarcinoma. However, further research is needed to elucidate the biological functions and underlying mechanisms of AAA-TOB3 in human lung adenocarcinoma.
Footnotes
Acknowledgements
We are grateful for the technical assistance with TMA construction provided by pathologists Jun L and Ming Z (ChaoYing Biotech Company, Xi'an, Shanxi, China).
Financial support: This study was supported by the National Natural Science Foundation of China (no. 81172234), the Scientific Research Fund of the Department of Education of Shaanxi Province, China (No. 11JK0721) and the Natural Science Foundation of Shannxi Province, China (No. 2015JM8480).
Conflict of interest: The authors declare that they have no conflicts of interest.