
Abstract
Background:
In this study we investigated the function of the non-catalytic region of tyrosine kinase adaptor protein 2 (NCK2) and its correlation with ITGB1 and ITGB4 integrins in driving ovarian cancer (OvCa) aggressiveness. We also evaluated whether NCK2 may influence prognosis in OvCa patients.
Methods:
Nanofluidic technology was used to analyze expression of NCK2 in 332 OvCa patients. To evaluate mRNA expression of NCK2, integrins and VEGFA in OvCa cell lines, qRT-PCR was performed. Stable NCK2 overexpression was obtained in OVCAR3. qRT-PCR and Western blot were performed to evaluate expression changes of VEGFA, vimentin, ITGB1, ITGB4, MMP2 and MMP9 under normoxia and hypoxia conditions. Coimmunoprecipitation (Co-IP) was performed in the A2780 cell line to study the interaction between NCK2 and proteins of interest. To investigate whether NCK2 can influence anchorage-independent growth, a soft agar assay was completed. Transwell invasion assay was performed on stable-transfected OVCAR-3 cell lines.
Results:
Nanofluidic data showed NCK2 can play an important role as a factor promoting tumor aggressiveness and survival in OvCa. This role was also linked to the behaviors of ITGB1 and ITGB4. Moreover, in cells overexpressing NCK2, the expression of vimentin, MMP2, MMP9, VEGFA and ITGB1, but not of ITGB4 was induced by hypoxia. Co-IP showed that NCK2 can directly bind ITGB1, but not VEGFA. NCK2 may be involved in mediating cell-extracellular matrix interactions in OvCa cells by influencing tumor aggressiveness.
Conclusions:
This study provides evidence of a possible role of NCK2 as biomarker of OvCa progression.
Keywords
Introduction
Ovarian cancer (OvCa) is the leading cause of death from gynecological malignancy in Europe and United States, with over 14,000 deaths each year (1). In the effort to better define the biology of this neoplasia, relevant advances have been achieved in the last decade (2). In fact, dysregulation of the cytoskeletal dynamic seems to be involved in the metastatic potential of OvCa (2), and in the resistance to cytotoxic agents such as taxanes (3). On the other hand, tumor angiogenesis was demonstrated as a relevant hallmark of OvCa biology, driving the development of an aggressive phenotype (3-12).
In this context, the family of non-catalytic regions of tyrosine kinase (NCK adaptor proteins; hereafter NCK, consisting of NCK1 and NCK2) modulates cytoskeletal dynamics through downstream effectors (13). In particular, the NCK family can mediate cytoskeletal remodeling, induced by proangiogenic factors, resulting in endothelial cells directional migration (14). Taken together, these findings strongly suggest that NCK proteins may play a role in the complex process of epithelial-to-mesenchymal transition (EMT), with a consequent negative impact on patients’ prognosis.
However, despite these promising preliminary results reported in the literature, no data are available regarding the role of the NCK family in OvCa biology. To cover this topic, we evaluated in vitro the role of NCK2 in preclinical models. In particular, we show herein the existence of a correlation between expression levels of NCK2, proangiogenic factors (VEGF) and cytoskeletal components (integrins and vimentin) in several OvCa cell lines. Furthermore, NCK2 overexpression seems to induce cell migration in both anchorage-independent growth and transwell assays. Taken together, our results suggest, for the first time, a possible role of NCK2 in promoting EMT.
Materials and method
Nanofluidic technology
Formalin-fixed paraffin-embedded (FFPE) samples were obtained from 332 patients with OvCa. These had been previously stored and preserved at Campobasso Research Hospital Foundation (period from 2000 to 2008). The protocol was approved by the Danbury Hospital IRB (prot. no. DH12/17). Patients gave explicit informed consent to be enrolled in this study: These individuals underwent standard treatment including platinum and taxane combination therapy. Samples were collected at the first surgical treatment, before any drug treatment, as already described (15-17). Briefly, FFPE samples were cut to 10-μm thickness, and 2 tissue slices were transferred to a 1.5-mL tube. One milliliter of xylene was added for deparaffinization and mixed twice on a high-speed vortex (3 minutes at room temperature). Subsequently, total RNA was automatically extracted with the Qiacube using the Qiagen miRNeasy FFPE kit following the manufacturer’s protocols. RNA from the cell line A2780 was also automatically extracted with the QIAcube using the Qiagen miRNeasy kit following the manufacturer’s protocols. RNA quantity and the quality were assessed with a Agilent 2100 Bioanalyzer (Agilent Technologies, Santa Clara, CA, USA). RNA analysis was carried out using both the 48.48 dynamic array (Fluidigm, South San Francisco, CA, USA) and the Biomark platform, following the manufacturer’s protocol. Data were normalized using the geometric average of 3 housekeeping genes (GAPDH, TUBB and ACTB1) and the delta/delta Ct method (18). As validation set, the level 3 data of normalized RNA-seq obtained on 344 patients, were downloaded from the TCGA data portal. RNA-seq results, rather than microarray data, were used, due to the lack of a validated probe for NCK2, ITGB1 and ITGB4 (19) within the U133A chips used for the TCGA analysis. Clinical information were also downloaded, and the 2 files were merged using the unique 12-number identifier of each patient.
Cell cultures and growth experiments
Since COV318 and PEO1 are the most popular cell lines used in vitro models as quoted in literature (20), they were purchased by the European Collection of Authenticated Cell Cultures (ECACC). The A2780, OVCAR3 and OV2774 cell lines were kindly donated by Susan Horwitz (Albert Einstein Medical College). Culture media were selected according to the ECACC’s recommendations, while growth experiments were performed as previously described (17). Regarding experiments performed under hypoxia conditions, cells were incubated in a Modular Incubator Chamber (Billups-Rothenberg Inc.) filled with 95% nitrogen and 5% CO2, following the manufacturer’s instructions. At time 0 and after 24, 48 and 72 hours, cells were harvested for further assays.
NCK2 overexpression
Human NCK2 (NM_003581.4) was amplified from a human testis library by polymerase chain reaction (PCR) with forward 5’-GGCTATGTACCGTCCAACTACG-3’ and reverse 5’-GCTGGTCTTCCTGCGC-3’ primers. This amplicon was subsequently cloned in the pUSE(+) expression vector (Upstate Biotechnology, Lake Placid, NY, USA). The empty vector served as negative control. Stable transfection in OVCAR-3 cells was performed using Transfectin™ Lipid Reagent (Biorad) according to instructions on the data sheet. At 24 hours, cells were split 1:25 and 1:50 and selected in the presence of G418 (1 mg/mL). When colonies appeared to be large, healthy and well separated, clones were harvested and expanded in growth medium containing drug. Sixteen clones were screened for the gene (by real-time PCR) and protein expression levels (by Western blot), respectively. Only the 2 clones showing the highest NCK2 expression were selected for further analysis.
Real-time quantitative PCR and Western blots
Total RNA was obtained from cultured cells using RNeasy Plus Mini Kit (Qiagen, Valencia, CA, USA) according to the manufacturer’s instructions. cDNA was prepared using an iScript cDNA Synthesis Kit (Bio-Rad, Hercules, CA, USA). Real-time quantitative PCR was done using the LightCycler® 480 (Roche) and the LightCycler® 480 SYBR Green I Master kit (Roche) in a final volume of 20 µL, starting with a 5-minute template denaturation step at 95°C, followed by 45 cycles of 10 seconds at 95°C and 10 seconds at 60°C.
Amplifications were carried out using the following primers: NCK2 forward 5’-TTGTGATAGCCAAGTGGGACTAC-3’ and reverse 5’-AGTGTGTCCTTCAGGTTCTTCAC-3’; ITGB1 forward 5’-CCGCGCGGAAAAGATGAATTT-3’ and reverse 5’-AGCAAACACACAGCAAACTGAT-3’; ITGB4 forward 5’-CCCTCTCCTCCCACGACTC-3’ and reverse 5’-TTCAGCAGCTGGTACTCCAC-3’; VIMENTIN forward 5’-GACAATGCGTCTCTGGCACGTCTT-3’ and reverse 5’-TCTTCTGCCTCCTGCAGGTTCTT-3’; VEGFA forward 5’-CGCTCGGTGCTGGAATTTG-3’ and reverse 5’-GTGGGGAATGGCAAGCAAAA-3’. The housekeeping genes used to normalize the specific target genes were the following: glyceraldehyde-3-phosphate dehydrogenase (GAPDH; to normalize the possible variation in sample concentration), using forward 5’-CTGACCTGCCGTCTAGAAA-3’ and reverse 5’-CCACCATGGAGAAGGGTGG-3’; β-Actin (ACTB) replaced GAPDH for analyses under hypoxia conditions, using the forward 5’-GCCGACAGGATGCAGAAGGAG-3’ and reverse 5’-CAGGATGGAGCCGCCGATC-3’. All experiments were repeated 3 times in triplicate. The results were analyzed using LightCycler® software, release 1.5.0SP4, version 1.5.0.39.
The procedure for Western blot analysis of whole cell lysates was performed as already described (15, 21-23). The following antibodies were utilized: anti-NCK2 mouse monoclonal antibody (1:5,000; Abcam, Cambridge, UK); anti-β-actin (1:5,000; Sigma-Aldrich), anti-integrin beta 1 monoclonal antibody (1:350; Abcam, Cambridge, UK); mouse monoclonal anti-integrin beta 4 (1:500; Abcam, Cambridge, UK); anti-vascular endothelial growth factor A rabbit polyclonal antibody (1:500; Santa Cruz, Santa Cruz, CA, USA); anti-Vimentin mouse monoclonal antibody (1:500 Santa Cruz, Santa Cruz, CA, USA). After incubation with secondary horseradish peroxidase-conjugated antibodies (Pierce), visualization was performed using the LiteAblot® TURBO (Euroclone, Italy) using a BioSpectrum® AC Imaging System (UVP).
Coimmunoprecipitation
To coimmunoprecipitate the endogenous NCK2, ITGB1 and VEGFA, A2780 cells (80-90% confluent monolayer cell culture) were lysed in RIP buffer (20 mM Tris-HCl pH 7.4, 1 mM EDTA, 137 mM NaCl, 1% Igepal CA 630, 5 mM MgCl2), including 0.1% protease inhibitor cocktail, 1 mM PMSF, 50 mM NaF and 2 mM sodium orthovanadate. After homogenization, the cell lysate was incubated on ice for 30 minutes and centrifuged at 13,200 rpm for 10 minutes to separate supernatant from cell debris. Protein concentration of the cell lysate was determined using a Bradford assay. Supernatant of each sample (500 µg) was precleared with 20 µL Protein A/G PLUS-Agarose (Santa Cruz Biotechnology) in RIP buffer for 30 minutes at 4°C. The beads were pelleted by centrifugation at 3,000 rpm for 5 minutes at 4°C, and supernatant was collected for the immunoprecipitation with 2.0 µg of anti-NCK2 (Abcam), anti-ITGB1 (Abcam) and anti-VEGFA (Santa Cruz Biotechnology) antibodies or goat anti-mouse IgG horseradish peroxidase-conjugated (Bio-Rad) and anti-rabbit IgG horseradish peroxidase-conjugated (Bio-Rad) as controls (2 hours at 4°C on a rotator). Protein A/G PLUS-Agarose was added followed by incubation overnight at 4°C. The supernatant protein fraction was recovered by centrifugation at 3,000 rpm for 5 minutes at 4°C, and the collected beads were washed 4 times with RIP buffer. The immunoprecipitates were resuspended in sodium dodecyl sulfate (SDS) loading buffer, boiled and run on 10% SDS-denaturing gel for Western blot analysis.
Soft agar assay
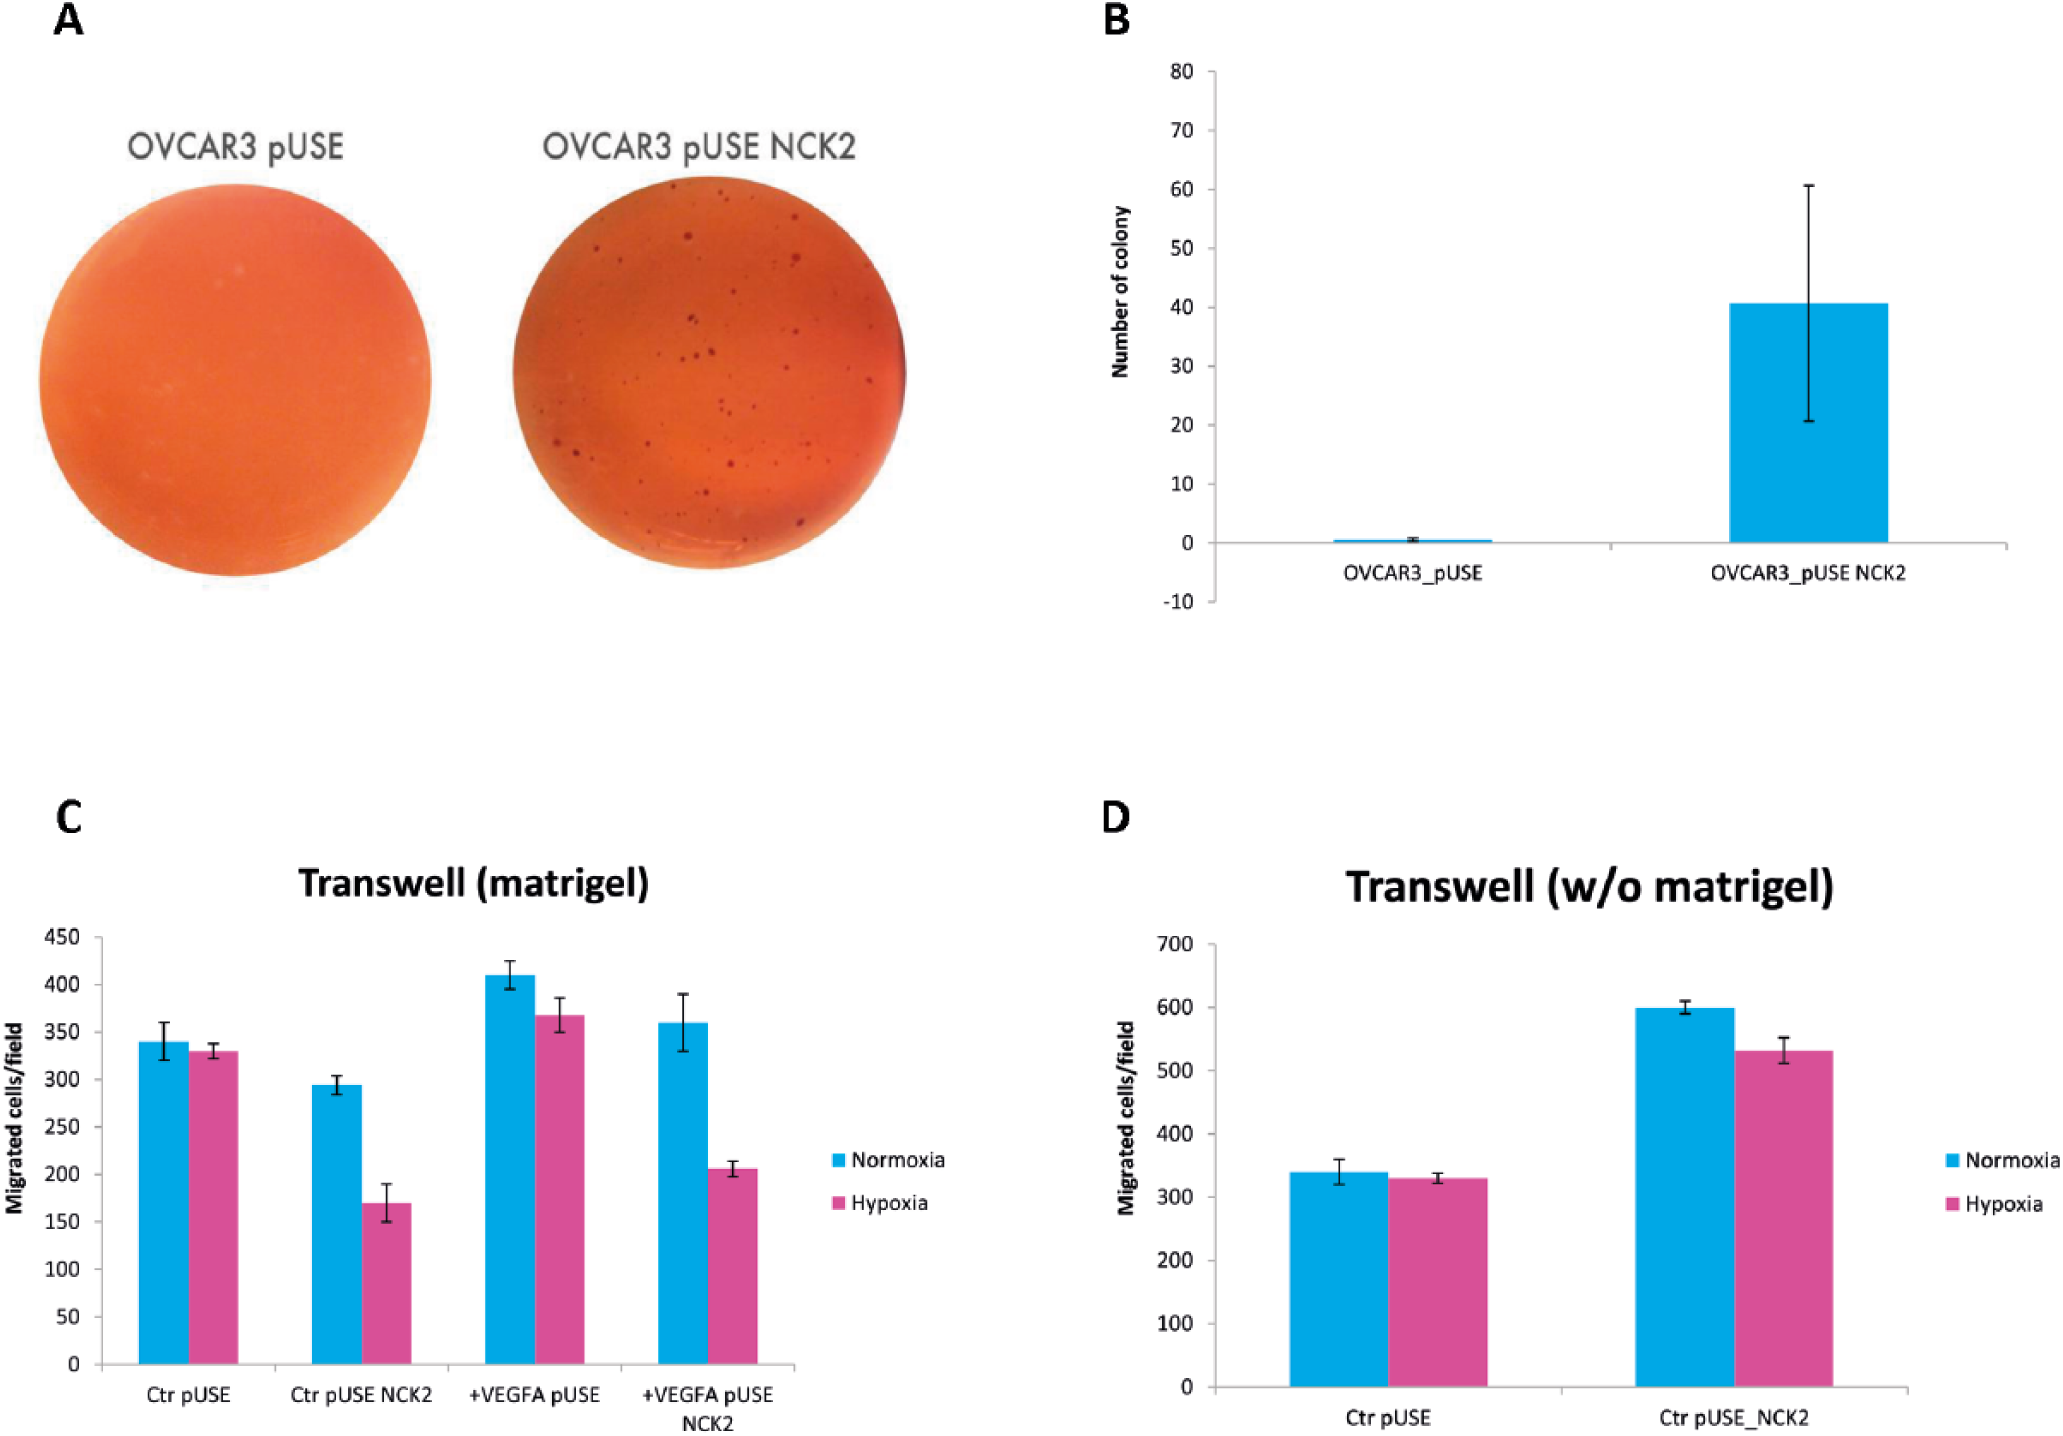
A soft agar assay was performed on stable-transfected OVCAR-3 cell lines under normoxia conditions (Fig. 1A, B). Base agar (final solution of 0.5% agar in ×1 RPMI 1640, 10% fetal bovine serum [FBS]) was added to 6-well culture plates (1 mL/well), and 10,000 cells were layered on each well in 1 mL of top agar (final solution of 0.3% agar in ×1 RPMI 1640, 10% FBS). Cells were incubated for 3 weeks at 37°C in 5% CO2 and fed twice a week with 0.5 mL of growth medium. Plates were stained using 2 mL/well of Neutral Red Solution (prediluted from 1% stock solution) for 30 minutes, and colonies were blindly counted by 2 independent readers. Details regarding measurement by the Transwell® assay of cell invasion and migration are reported in Figure 1C, D.

Soft agar assay. (
Statistical analysis
Student’s t-test (2 groups) or ANOVA (more than 2 groups) was used to compare quantitative data. Post hoc analysis, using Bonferroni algorithms, was used to compare mRNA expression levels. All statistical analysis were performed using SPSS version 20.0 (IBM, Chicago, IL, USA). Cox and Kaplan-Meier analysis was performed as described previously (16). Kaplan-Meier analysis and the hazard ratio with 95% confidence intervals and log-rank p value were determined and plotted in R using the Survplot function of the survival. Patients were categorized as positive or negative according to the cutoff optimized using the R script S1, as previously published (24). A cumulative score for the expression of each of the 3 investigated factors was created by assigning the value of 1 or 0 when the factor was positive or negative, respectively. The values for significance were fixed at a p value equal to 0.005 or less than 0.05.
Results
Clinical and molecular relationships regarding NCK2 expression in 332 OvCa patients
Supplementary Table I (available online at www.biological-markers.com – Clinical features of the analyzed setting of ovarian cancer patients) reports retrospective data obtained on our clinical cohort including 332 OvCa patients, where those with higher NCK2 levels showed significantly shorter median progression-free survival (PFS; 43 months), compared with patients with reduced NCK2 (median PFS = 24 months and median OS = 53 months) (Fig. 2A, B).
Analysis of expression of NCK2, by nanofluidic assay, in a first clinical setting of 332 ovarian cancer patients. Kaplan-Meier survival curves for NCK2 show overall survival (p = 0.033) (
NCK2 modulates the expression of genes involved in tumor aggressiveness and modulates the expression of VEGFA
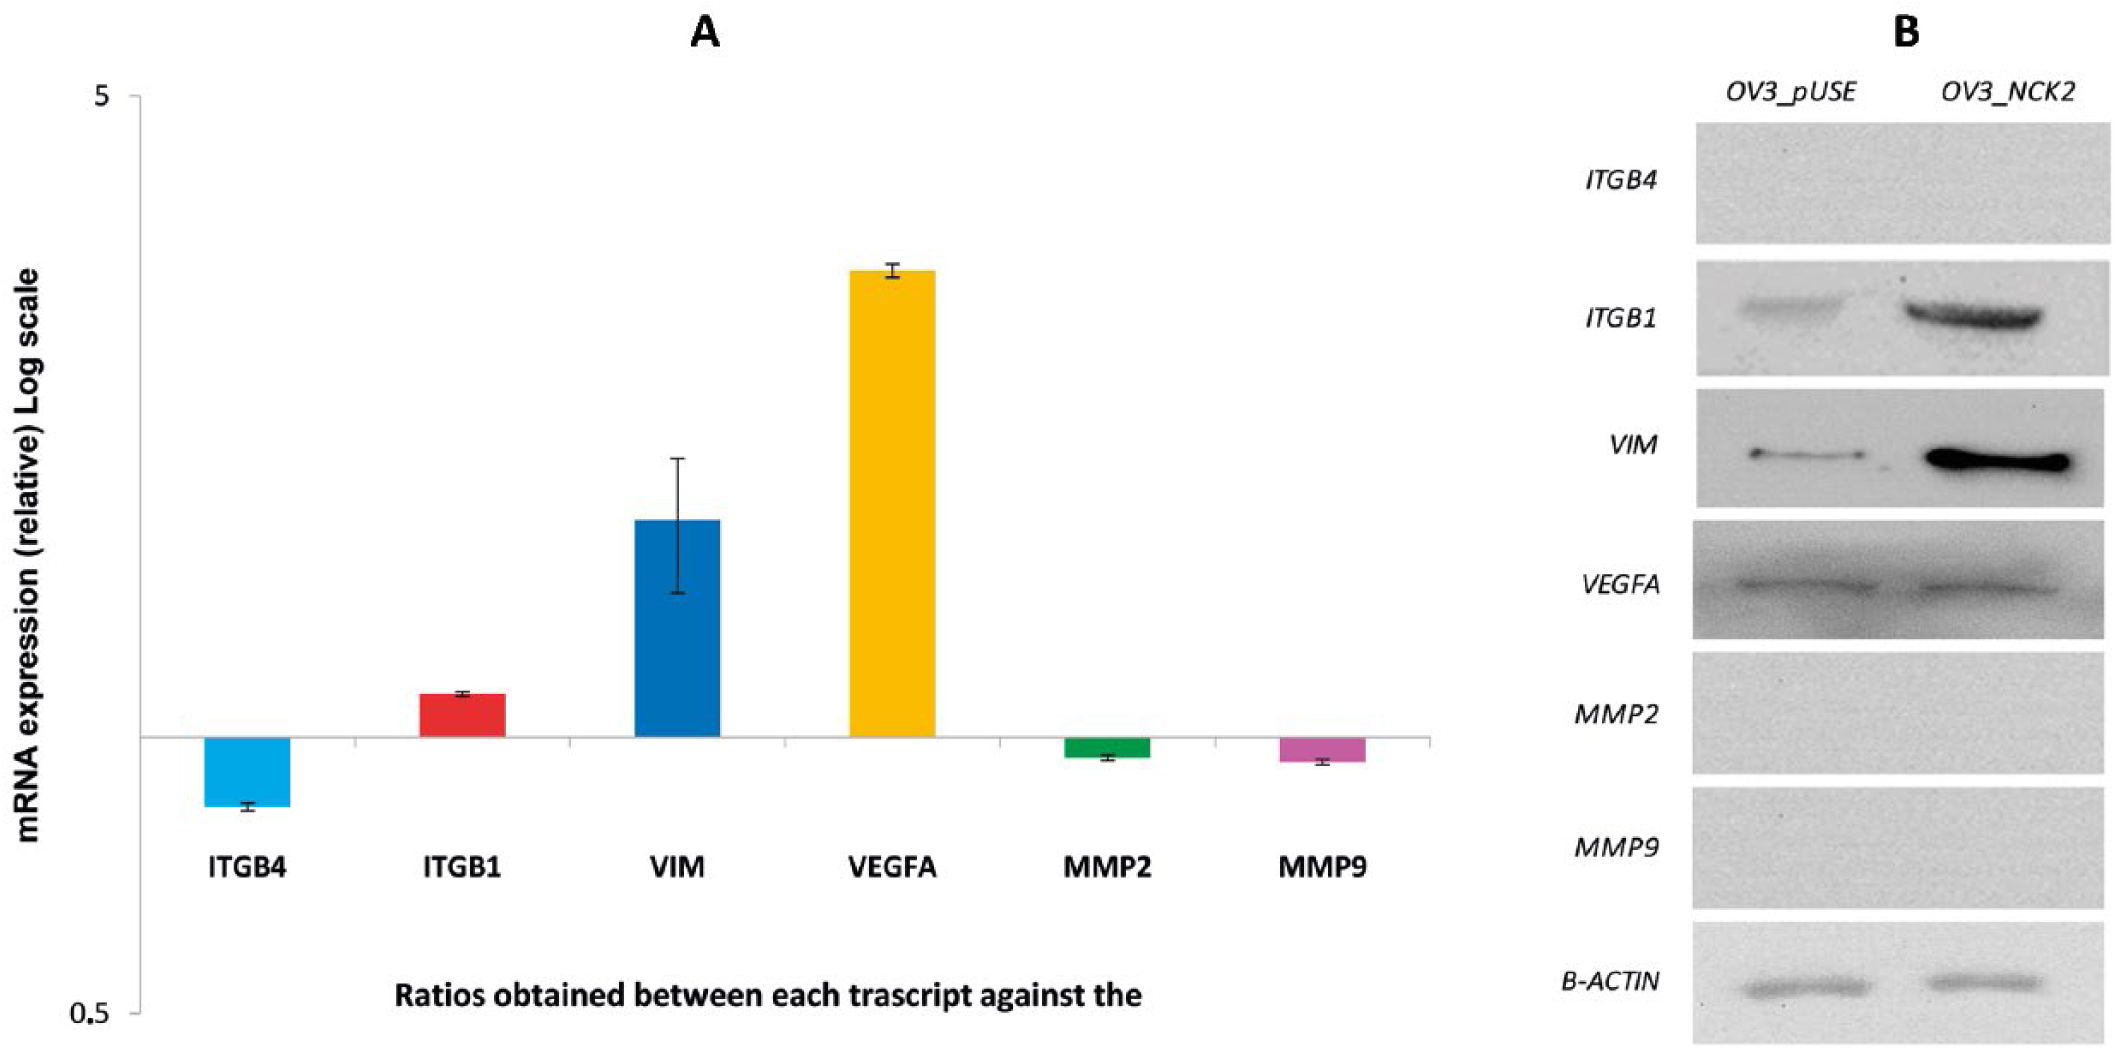
The expression of the NCK2 gene was assessed first in a panel of ovarian adenocarcinoma cell (OVC) lines (A2780, Hey, PEO1, COV318, OV2774, OVCAR3). Integrin β1 (ITGB1) belongs to a large family of cell surface adhesion proteins involved in the cell–matrix interactions. ITGB1 regulates wider functional activities, such as cell proliferation, adhesion and invasiveness, and previous studies have suggested that it can be involved in the invasive capacity and resistance to chemotherapy in different tumor models (25-27). A preliminary investigation of genes altered in NCK2-overexpressing cells indicated ITGB1 as an EMT gene that was increased (see Supplementary Figure 1, available online at www.biological-markers.com – EMT mRNA gene expression in OVCAR3 pUSE NCK2 and OVCAR3 pUSE). By Western blots, performed using a mouse monoclonal antibody, we observed superimposable levels of NCK2 protein in overall OvCa cells (see Supplementary Figure 2B, available online at www.biological-markers.com – NCK2, ITGB4, ITGB1 and VEGFA mRNA and proteins expression in ovarian cancer cell lines: A2780, HEY, COV318, OV2774, PEO1 and OVCAR3). To study the relationship between NCK2 and ITGB4, ITGB1 and VEGFA in OVC expression, the dynamics of these genes were assessed in the above-mentioned cells. We observed similar expression of NCK2, ITGB1 and VEGFA proteins, while ITGB4 was expressed only in OV2774, COV318 and PEO1 cells, as also confirmed at the mRNA level (see Supplementary Figure 2, B, available online at www.biological-markers.com – NCK2, ITGB4, ITGB1 and VEGFA mRNA and proteins expression in ovarian cancer cell lines: A2780, HEY, COV318, OV2774, PEO1 and OVCAR3). NCK2 overexpression in OVCAR3 correlated with higher levels of VEGFA and vimentin mRNA; a slight increase for ITGB1 mRNA was observed. Figure 3A shows that ITGB4, matrix metalloproteinase-2 (MMP2) and MMP9 mRNAs were not expressed in this cell line, consistent with the Western blots. By Western blot analysis, we compared vimentin, VEGFA and ITGB1 protein behaviors in cells overexpressing NCK2: all of the above-mentioned proteins were up-regulated (Fig. 3B). Therefore NCK2 could also promote angiogenesis through VEGFA overexpression.
ITGB1, ITGB4, VEGFA, VIM, MMP2 and MMP9 mRNA and protein expression in OVCAR3 overexpressing NCK2. (
NCK2 interaction partners at Co-IP analysis
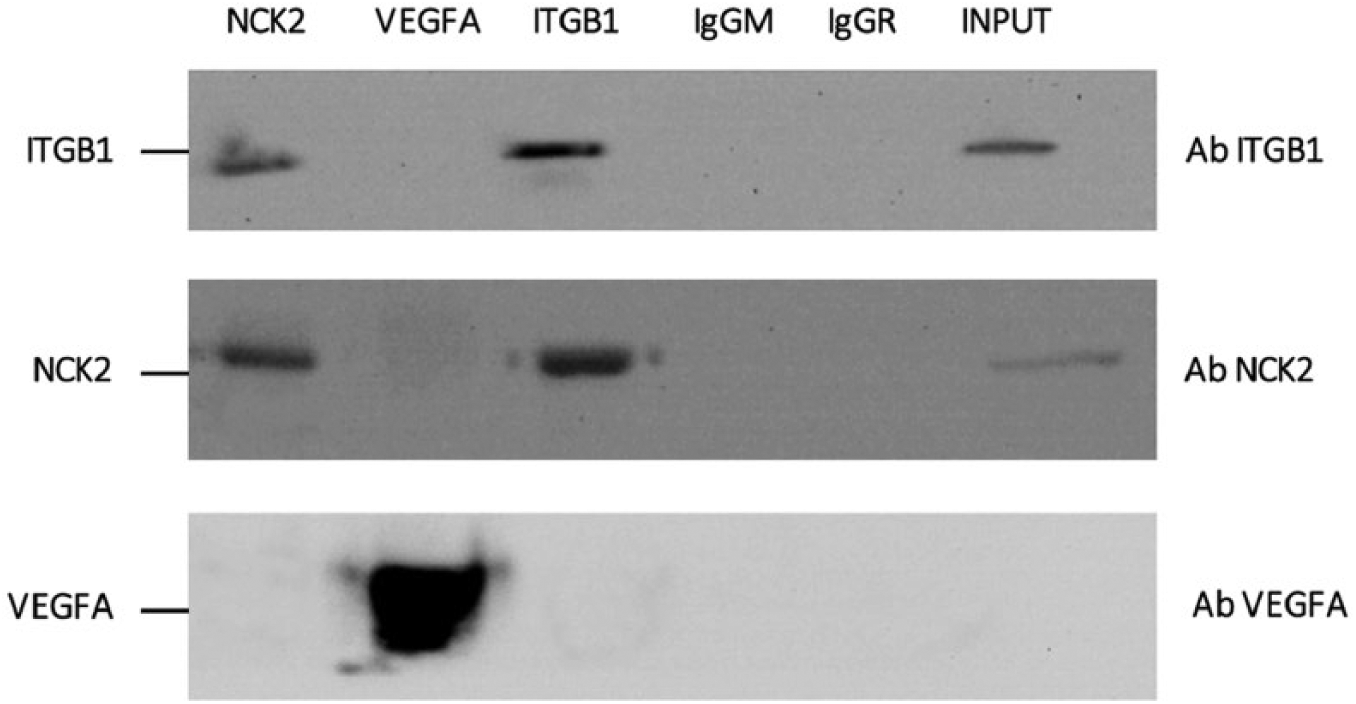
Gene and protein expression data regarding our OVC showed that NCK2, ITGB1 and VEGFA almost follow the same pattern, suggesting a possible functional link between these genes. Therefore, to verify the NCK2 direct or indirect interaction with VEGFA and ITGB1, we performed the coimmunoprecipitation (Co-IP) analysis on A2780. Co-IP (Fig. 4) showed that NCK2 can directly bind ITGB1, but not the VEGFA. Therefore, the increases in VEGFA mRNA levels could be related to other epigenetic or genetic factors not investigated in the present study.
Western blot showing coimmunoprecipitation of endogenous ITGB1, NCK2 and VEGFA proteins. Whole cell extracts from A2780 cells were immunoprecipitated for all proteins using respective antibodies and 2 nonspecific IgG were used as a negative control. Samples were then probed for ITGB1, NCK2 and VEGFA by Western blotting. Whole cell protein lysate (40 µg) was used as input.
NCK2 overexpression and EMT genes
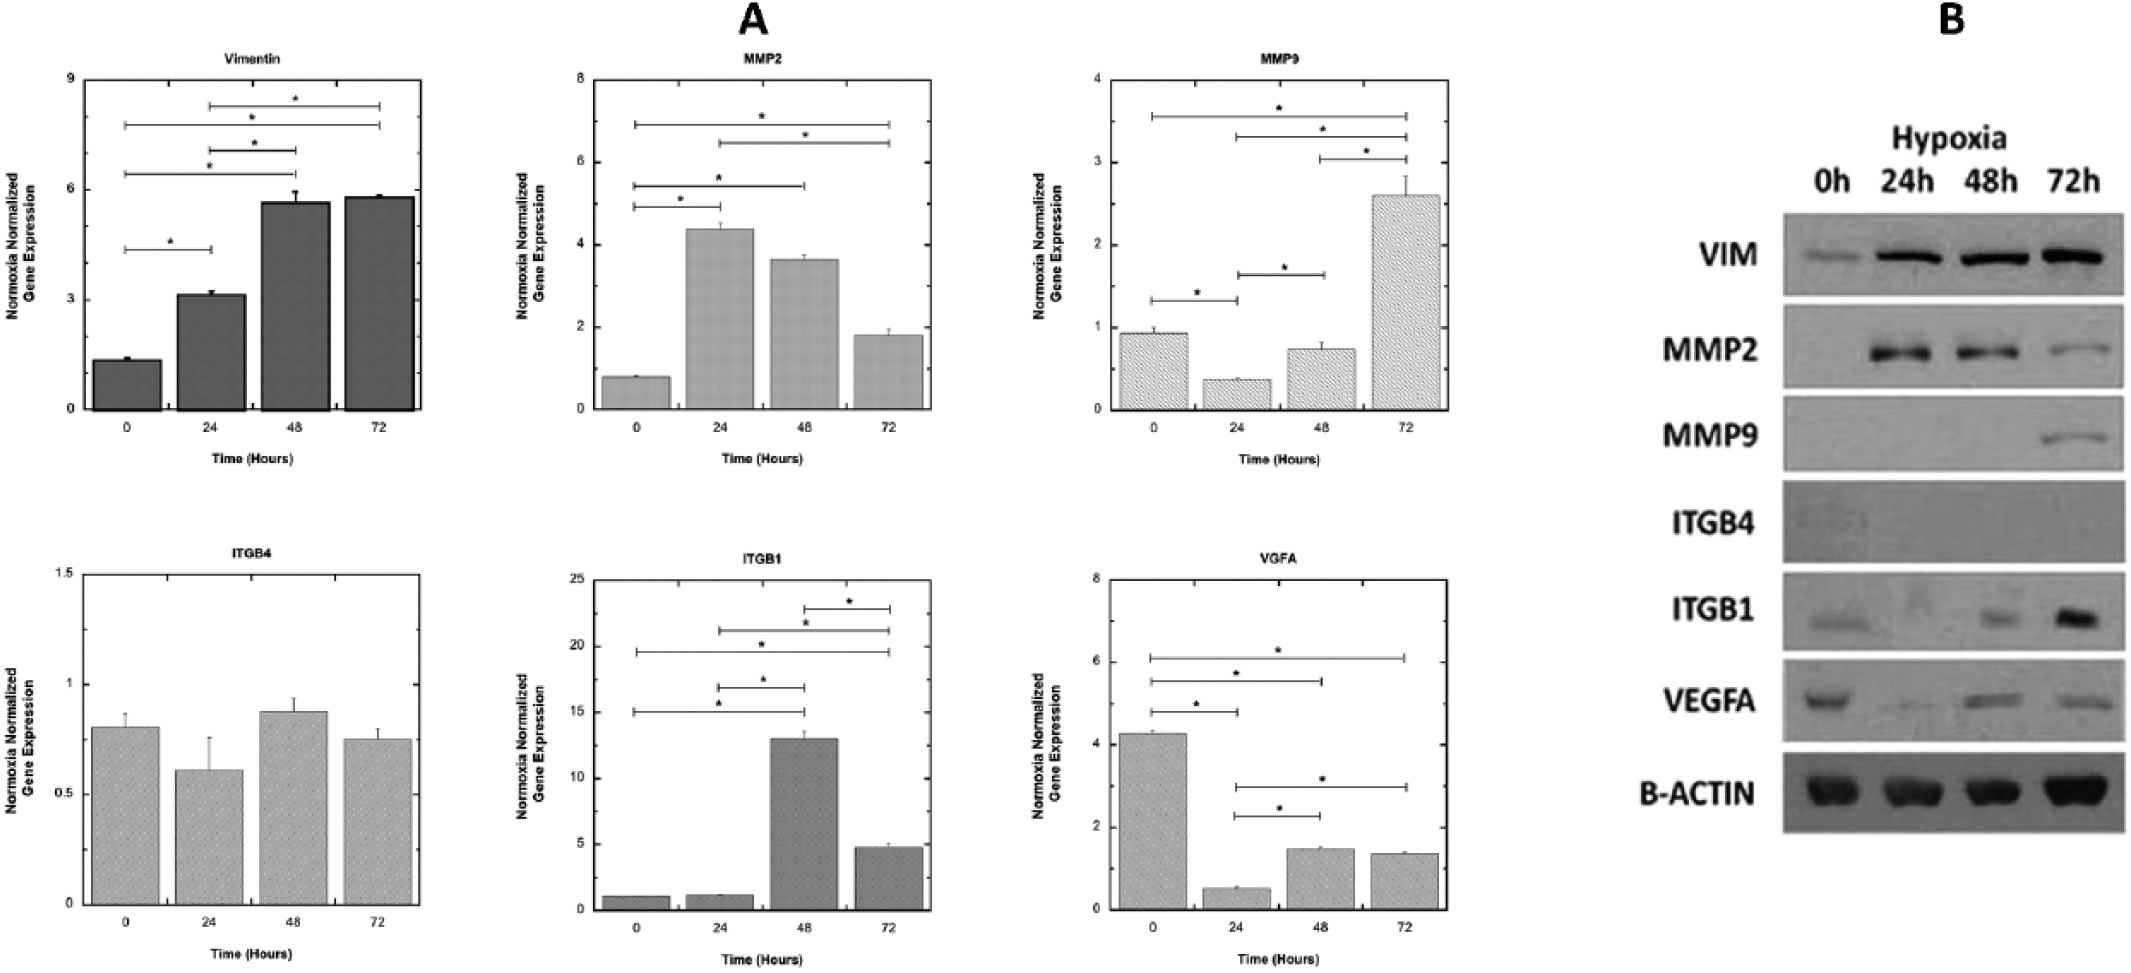
NCK2 may also be involved in mediating cell–matrix interactions in OvCa cells, thus influencing tumor aggressiveness. To investigate the role of NCK2 in OvCa, with particular attention to hypoxia, we first analyzed the mRNA and protein expression of ITGB1, ITGB4 and VEGFA in OVCAR3 overexpressing NCK2. To identify the factors possibly involved in the NCK2 stromal pathway, the behaviors of vimentin, MMP2 and MMP9 mRNAs were analyzed under hypoxia conditions. Here, we found an increased time-dependent expression of vimentin, while MMP2 showed an opposite trend. MMP9 was up-regulated only after 72 hours, with VEGFA up-regulated after 48 hours. ITGB1 remained indeed stable at 24 hours, and was strongly up-regulated only after 48 hours (Fig. 5A). All of the Western blot tests confirmed these findings (Fig. 5B).
VIM, MMP2, MMP9, ITGB4, ITGB1 and VEGFA mRNA and protein expression in OVCAR3 overexpressing NCK2, in hypoxic condition. (
Tumor cell NCK2 overexpression
To investigate whether NCK2 can influence anchorage-independent growth (which is a feature of cancer aggressiveness) in OvCa, we developed a functional soft agar assay. We prepared a construct carrying human NCK2 coding sequence. As expected, the clone overexpressing NCK2 exhibited a significantly increased number of colonies in soft agar (mean 0.33 ± 0.57 for control cells vs. 48 ± 21.93 for NCK2-transfected cells; p = 0.032; Fig. 1A, B). Samples were analyzed for colony formation 3 weeks later. As pictured in Figure 1C, D and in keeping with the title of our paper, the only migration was observed in the transwell medium without matrigel. The increase in migration but lack of invasive capacity in NCK2-overexpressing cells would explain the usual pattern of OvCa cells which primarily disseminate within the peritoneal cavity and are only superficially invasive.
Discussion
The present study reports, for the first time in OvCa, data regarding an essential role of NCK2 in the coordination of key cellular behaviors associated with proliferation and tumor cell spread. The NCK family of the SH2/SH3 domain, containing adaptor proteins, couples phosphotyrosine signals with actin dynamics as modulators of motility-related structures such as podosomes, lamellipodia and invadopodia: therefore it is well positioned to orchestrate cellular processes required in vascular formation and cell migration (3, 13). Furthermore, the degree of cancer cell cohesion in primary tumor also depends on the strength of cell–extracellular matrix (ECM) contacts mediated by integrins (28). Alteration in integrin expression is also implicated in cancer progression, invasion and metastasis (29-31). Our in vitro analyses on 6 OvCa cell lines revealed an overall increase of NCK2, ITGB1 and VEGFA. NCK2 overexpression correlated with higher levels of VEGFA and vimentin mRNA, indicating that NCK2 modulates the expression of genes regulating EMT and tumor angiogenesis. Our findings appear to be in line with those previously reported by Otsuki et al (32), suggesting that NCK2 is able to up-regulate vimentin thus influencing tumor aggressiveness. To identify and confirm the role of NCK2, particularly under conditions similar to those of the tumor microenvironment, we also repeated the experimental models under a hypoxic setting, to evaluate the modulation of NCK2 expression. Our data showed an increase of vimentin mRNA expression over time, and an increase of MMP2 at 24 hours and decreasing in the subsequent times of observation; finally, MMP9 showed an opposite trend. Moreover, VEGFA protein was not yet activated at time 0, with a sharp decline at 24, followed by a rise after 48 hours under hypoxia conditions. Finally, ITGB1 was significantly up-regulated only after 48 hours, while ITGB4 was not.
We underline the fact that cells generally have a specific sensor able to monitor the state of oxygenation: when the amount of oxygen is inadequate, the sensor activates a program of cell survival, while when exposed to microenvironmental stressors, cells react by activating pathways involving genes linked to EMT and angiogenesis (33, 34). In solid tumors, the microenvironment is generally hypoxic due to the high oxygen consumption and the insufficient blood supply. Consequently, tumor cells that fail to grow in such environmental conditions are able to trigger the survival program where NCK2 is involved, thus leading to the growth of tumor cells. This behavior results in the more aggressive phenotype and further survival advantage (35-40). NCK2 also exhibited the ability to increase anchorage-independent growth. In fact, cells that overexpressed NCK2 (pUSE-NCK2) formed higher numbers of colonies compared with those that did not.
A possible limitation of the present study could be the lack of data about the survival rate of these cells, although this was not the main topic of the present study. Nevertheless, our data provide evidence for a correlation between the activity of NCK2 and tumorigenicity, although the mechanisms by which NCK2 regulates invasive potential remain unclear. We in fact underline the fact that additional experiments are required to demonstrate that this correlation is direct. Labelle-Côté et al (14) showed the importance of NCK2 factor in promoting the proliferation, migration and invasion of human melanoma cells; in a similar way, our results show that NCK2 can favor the spread.
Conclusion
The present report provides evidence of a possible role of NCK2 in OvCa biology. The overall data support NCK2 as a protein sustaining mechanisms promoting OvCa progression, in combination with other partners related to EMT and tumor angiogenesis. This study showed that patients with high levels NCK2 were more likely to show an aggressive form of disease and poor prognosis. These data could stimulate clinical translational research aimed toward finding therapeutic alternatives for these patients by development of inhibitors of NCK2 molecules. Future studies could clarify whether NCK2 may represent a potential molecular biomarker of cancer progression and aggressiveness for anticancer targeted therapy.
Footnotes
Disclosures
Financial support: This work was partially supported by the Non-profit organization “OPPO and his rooms” ONLUS.
Conflict of interest: Authors declare they have no conflicts of interest.