
Abstract
Purpose
Veno-venous ECMO is indicated in reversible life-threatening respiratory failure without life-threatening circulatory failure. Recirculation of oxygenated blood in the ECMO circuit decreases efficiency of patient oxygen delivery but is difficult to measure. We seek to identify and quantify some of the factors responsible for recirculation in a simulation model and compare with clinical data.
Methods
A closed-loop real-time simulation model of the cardiovascular system has been developed. ECMO is simulated with a fixed flow pump 0 to 5 l/min with various cannulation sites – 1) right atrium to inferior vena cava, 2) inferior vena cava to right atrium, and 3) superior+inferior vena cava to right atrium. Simulations are compared to data from a retrospective cohort of 11 consecutive adult veno-venous ECMO patients in our department.
Results
Recirculation increases with increasing ECMO-flow, decreases with increasing cardiac output, and is highly dependent on choice of cannulation sites. A more peripheral drainage site decreases recirculation substantially.
Conclusions
Simulations suggest that recirculation is a significant clinical problem in veno-venous ECMO in agreement with clinical data. Due to the difficulties in measuring recirculation and interpretation of the venous oxygen saturation in the ECMO drainage blood, flow settings and cannula positioning should rather be optimized with help of arterial oxygenation parameters. Simulation may be useful in quantification and understanding of recirculation in VV-ECMO.
Introduction
Extra-corporeal membrane oxygenation (ECMO) has been an established treatment for hypercarbic and hypoxic respiratory failure for 20 years (1, 2) and a randomized controlled study suggests improved outcome in adult ECMO patients when compared to conventional treatment (3). Veno-arterial ECMO (VA-ECMO) should only be used in severe circulatory failure, while first choice in respiratory failure is veno-venous ECMO (VV-ECMO) (4-6). The optimization of ventilator settings is controversial during ECMO (4). Ventilator pressures are usually reduced to avoid further mechanical lung injury, which may result in partial or total collapse of the lungs and therefore total dependency on the ECMO circuit. The optimal degree of lung rest may therefore depend not only on pulmonary pathophysiology, but also the center-specific risk of technical complications during ECMO treatment. Left ventricular and arterial oxygen saturation during VV-ECMO with collapsed lungs may approach the saturation in the pulmonary artery. This saturation is determined by the efficiency of VV-ECMO therapy, lung function, cardiac output, and oxygen consumption. The blood leaving the oxygenator in the ECMO circuit is normally fully saturated, but blood reaching the right ventricle is mixing with venous blood to varying degrees depending on many factors including cannula positions, cardiac output, and ECMO flow (7).
Recirculation of oxygenated blood in the ECMO circuit decreases efficiency of oxygen delivery to the patient, but is difficult to measure clinically (8). Reported values vary between 2% and 57% (8-11). Neither measurement of saturation in true mixed venous blood (SvO2) nor conventional thermodilution cardiac output measurements is possible due to venous admixture of oxygenated blood. It is important to realize that blood sampling in the pulmonary artery will result in higher saturation values than SvO2 and therefore has a questionable clinical value. Since high venous saturation (SpreoxO2) in the ECMO circuit due to recirculation may falsely be interpreted as a sign of adequate oxygen delivery, it is important to understand and minimize the factors causing recirculation.
Due to the critical condition of the patients receiving ECMO treatment, experimental studies employing this patient group can be difficult to perform. Simulation models can therefore be a helpful tool when studying these patients. The aim of this study is to explore the importance of different cannula positions, ECMO flow rate and cardiac output for oxygen uptake and recirculation in a computer simulation model. Furthermore arterial and venous oxygen saturations in a retrospective clinical cohort of 11 patients are compared with simulation data in order to validate the model.
Methods
In order to assess the importance of recirculation in clinical VV-ECMO we have studied recirculation in a simulation model, with three different cannulation modes and variable ECMO flow. We have also studied the relation between recirculation and cardiac output, by simulating right heart failure due to pulmonary hypertension in the model. To validate the model we have compared simulation data with a clinical cohort of 11 consecutive VV-ECMO patients in our own unit.
Cardiovascular simulation model
A closed-loop, real-time simulation model was developed consisting of 27 vascular segments, 6 in the pulmonary circulation, and 21 in the systemic circulation, the 4 cardiac chambers with corresponding valves, the pericardium and intrathoracic pressure (Fig. 1). The cardiovascular simulation model has been published elsewhere (12), although minor modifications have been implemented since publication. One pulmonary arterial compartment was added to better represent the elastic properties of the pulmonary arteries, and the functions determining vascular pressures during low volumes and vascular collapse were changed to better represent the pressure-volume relation during hypovolemia and/or large swings in intrathoracic pressure. In short, the cardiac chambers are represented as time-varying elastances and the closed-loop vascular system segments are characterized by non-linear resistances, compliances, inertias, and viscoelastances. Valves open and close depending on pressure gradients.
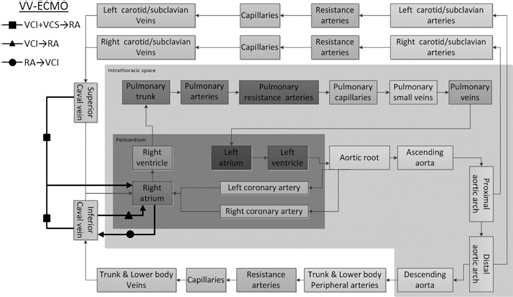
Sketch showing the cardiac and vascular components of the simulation model. The dark gray area is the pericardium containing the cardiac chambers and coronary vessels. The light gray area is the intra-thoracic space containing the pericardium, the pulmonary circulation and the thoracic aorta. The extra-thoracic space contains the carotid/subclavian circulation in the upper part and the rest of the systemic circulation in the lower left part. The three different VV-ECMO cannulation modes simulated in the study are shown with thick black lines.
The simulations in this article were performed with a normal cardiac function, but an increase in pulmonary vascular resistance (3.4 Wood units) and a pulmonary shunt fraction of 50% mimicking a typical clinical VV-ECMO patient in our unit with moderate pulmonary hypertension (Tab. I) and arterial oxygen saturation below 80% without ECMO support, despite ventilator therapy with 100% oxygen. Intrathoracic pressure was set to zero to avoid variability due to circulatory changes during the respiratory cycle. Pressures, flows, volumes and saturations in every compartment are updated with 4000 Hz.
ECMO simulation
ECMO flow was fixed at the set continuous flow rate of 0 to 5 l/min, with a selection of clinically relevant cannulation sites: 1) right atrium to inferior vena cava (RA→VCI), 2) inferior vena cava to right atrium (VCI→RA), and 3) superior+inferior vena cava to right atrium (VCI+VCS→RA) (Figs. 2a-c). The first two cannulation modes are the most common according to the ELSO database (13). The third mode (VCI+VCS→RA) resembles the commercially available Wang-Zwische/Avalon cannula (AvalonElite; Avalon Laboratories Rancho Dominguez, CA USA) (9). When two draining cannulas were used (VCI+VCS→RA) flow was equally divided between the two. Since ECMO flow was constant, neither elastic nor inertial properties of the tubings were included in the simulation. Resistance of the tubings were set to values creating realistic pressure drops as seen in our institution. Although these pressures are important for the function of the pump, they do not affect the physiology of the patient, since flow is constant (mimicking a roller pump) so the values are therefore not presented.
Patient characteristics in 11 consecutive cases treated with VV-ECMO in our institution
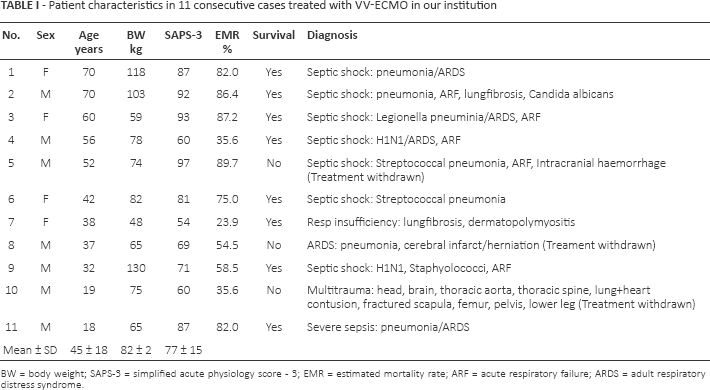
BW = body weight; SAPS-3 = simplified acute physiology score - 3; EMR = estimated mortality rate; ARF = acute respiratory failure; ARDS = adult respiratory distress syndrome.
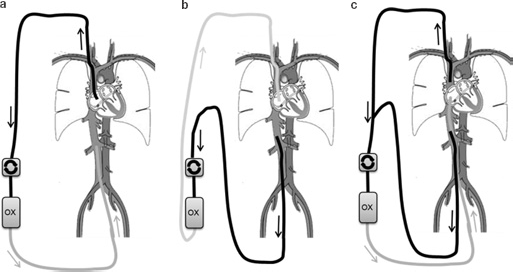
Sketch of the three veno-venous ECMO cannulation modes explored in the simulation study. a) shows drainage from the right atrium and reinfusion into the inferior caval vein, b) shows drainage from the inferior caval vein and reinfusion into the right atrium, and c) shows drainage from both the superior and inferior caval vein and reinfusion into the right atrium.
Oxygen transport
The oxygen-carrying capacity of blood C (ml O2/liter blood) in the circulation of the patient was calculated according to equation 1 (14), where Hb is the hemoglobin level (g/l) and Sat is the oxygen saturation (%) of the vascular compartment (mL)

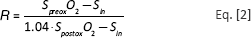
Physically dissolved oxygen was only taken into account in post-oxygenator blood, where oxygen partial pressure, pO2, is extremely high (typical 30–40 kPa), corresponding to 5% of total oxygen content (See supplementary material available online at www.artificial-organs.com). In the vascular compartments of the simulated patient, saturations were below 94%, corresponding to a pO2of <9 kPa (<1.5% dissolved oxygen), which in this study was considered negligible. The oxygen saturation was considered homogenous in each compartment and exchange of oxygen between compartments proportional to flow. A uniform hemoglobin level of 114 g/l was used in all simulations, since clinical mean hemoglobin level is 114 g/l (Tab. III). Total oxygen consumption excluding the heart was set to 250 ml/min. Cardiac oxygen consumption was calculated according to Suga et al (15) depending on the mechanical workload of the heart (in the study between 18 and 19 ml/min). Recirculation, R, in the model was calculated according to equation 2 modified from Walker et al (16) as explained in the supplementary material, where SpreoxO2is the oxygen saturation in the drainage cannula of the ECMO-system, SpostoxO2is the oxygen saturation in the returning cannula of the ECMO system, and Sin is the oxygen saturation in the veins drained by the cannulated vessel segment.
Simulation of circulatory failure in VV-ECMO due to increase in pulmonary vascular resistance
Pulmonary vascular resistance was increased from 3.4 Wood units to 12.2 Wood units in 20 steps, by decreasing the radius of the pulmonary resistance arteries by 2.0% per step, mimicking a clinical scenario where a patient with VV-ECMO deteriorates and becomes a candidate for veno-arterial support (17) or septostomy (18). VV-ECMO flow (VCI+VCS→RA) was kept constant at 4 l/min. This is often in real life accompanied by (or maybe more correctly caused by) worsening of pulmonary function (“white out”), but to simplify interpretation of data the pulmonary shunt was kept constant at 50% in the simulation. Heart rate was kept constant at 100 bpm. No autonomic reflexes or adaptive mechanisms were included in the simulation.
Clinical patients
Eleven consecutive adult VV-ECMO cases were selected retrospectively from our clinical database in the year of 2012 (Tab. I). Mean age was 45 ± 18 and 7/11 were males. Eight of the eleven patients survived. Mean SAPS-3 score at admission was 77 ± 15 (Tab. I), suggesting an expected hospital mortality rate of about 70% (19, 20). Venous drainage was accomplished by a 23 F 25 cm cannula placed with its tip in the right atrium via the jugular vein in all patients. Oxygenated blood was returned into one femoral vein through a 17 F to 21 F 18 cm cannula. Patients converted to VA-ECMO within the first 48 hours were excluded. Arterial oxygen saturations and oxygen saturations in the draining cannula of the ECMO system (SpreoxO2) were collected together with ECMO flow rates and base-line patient characteristics between 23 and 27 hours from admission.
Calculations and statistics
The program version used was Aplysia CardioVascular Lab 5.5.0.11 (Aplysia Medical AB, Stockholm, Sweden). Mean values in the model were calculated as running arithmetic means. All data were collected at end-diastole after at least 5 min simulation to allow for steady-state conditions regarding hemodynamics and oxygen transport. No intrathoracic pressure changes were included in the simulation. The oxygenation of the patients' non-shunting pulmonary capillary blood was set to 99.4%.
Results
Simulation hemodynamics
Heart rate was kept at 100 bpm during all simulations. Mean systemic arterial blood pressure was 77 mmHg and mean pulmonary artery pressure was 22 mmHg in all simulations. The minimal differences seen in cardiac output can be explained by the slight changes in filling pressures created by the venous ECMO circulation. These differences are realistic, but not big enough to permit clinical detection and do not affect the conclusions in this study. See Table II.
Hemodynamic data in simulations
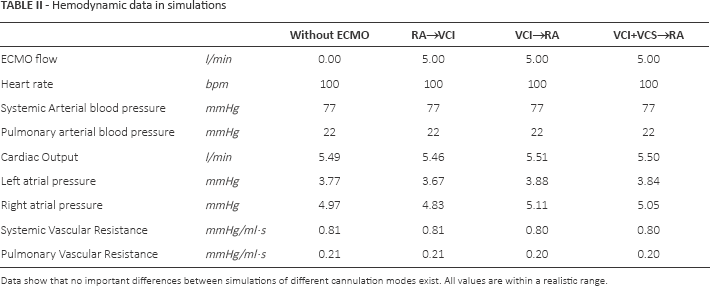
Data show that no important differences between simulations of different cannulation modes exist. All values are within a realistic range.
1) VV-ECMO Simulation. Right atrial outflow and inferior vena cava return
Recirculation increased seemingly linearly up to 48% at ECMO blood flow 5 l/min. About 70% of the patients' oxygen uptake was supplied by the ECMO circuit at this flow. Mixed venous oxygen saturation (SvO2) was about 21% lower than the saturation in the venous tubings of the ECMO circuit (SpreoxO2). Arterial saturation was 89% (Figs. 3a-e).
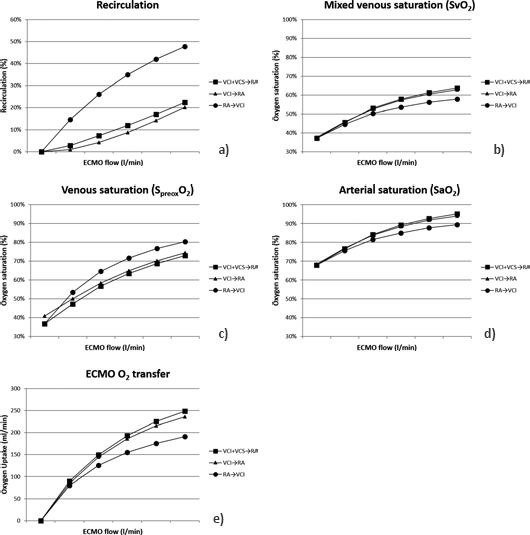
Simulation results with different ECMO flows and cannulation modes.
2) VV-ECMO Simulation. Inferior vena cava outflow and right atrial return
Recirculation increased up to 20% at ECMO blood flow 5 l/min, which is considerably less than in the previous cannulation mode; 87% of the patients' oxygen uptake was supplied by the ECMO circuit at this flow. Mixed venous oxygen saturation (SvO2) was 12% lower than the saturation in the venous tubings (SpreoxO2) of the ECMO circuit at this flow. Arterial saturation was 94% (Figs. 3a-e).
3) VV-ECMO Simulation. Inferior+superior vena cava outflow and right atrial return
Recirculation increased seemingly linearly up to 22% at ECMO blood flow 5 l/min, which is similar to the previous cannulation mode; 92% of the patients' oxygen uptake was supplied by the ECMO circuit at this flow. Mixed venous oxygen saturation (S v O2) was 9% lower than the saturation in the venous tubings (S preox O2) of the ECMO circuit at this flow. Arterial saturation was 95% (Figs. 3a-e).
4) VV-ECMO Simulation. Vena cava inferior+superior outflow and right atrial return. Circulatory failure due to progressive increase in pulmonary vascular resistance
Cardiac output decreases from 5.5 l/min to 3.4 l/min when pulmonary vascular resistance increases from 3.4 Wood units to 12.2 Wood units (Fig. 4b). Mean systemic arterial blood pressure declines from 77 mmHg to 54 mmHg and mean pulmonary arterial blood pressure increases from 22 mmHg to 42 mmHg (Figs. 4b and 5). Recirculation increases from 17% to 31%, while S v O2decreases from 61% to 43% (Fig. 4a). Pre-oxygenator saturation (S preox O2) decreases 5% from 68% to 63% (Fig. 4a). The difference between S v O2and pre-oxygenator saturation (S preox O2) increases from 7% to 20% (Fig. 4a).
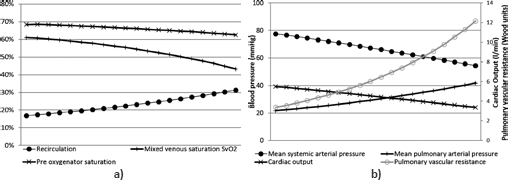
Simulation results in circulatory deterioration due to pulmonary hypertension.
Clinical patient data
Oxygen data in the patients closely corresponded to simulated data derived from interpolations in Figures 3a-e (the simulated values are shown in parentheses in the following text). Mean arterial saturation was 86 ± 8% (88%) and venous saturation (SpreoxO2) was 75 ± 3% (78%). Detailed hemodynamic data were not available, but by assuming oxygen extraction of 30%, we calculated an estimated SvO2(also assuming similar saturations in superior and inferior caval veins, see supplementary material available online at www.artificial-organs.com), and were thereby able to calculate an estimated mean recirculation rate of 42 ± 6% (43%). A substantial difference between the estimated SvO2of 56 ± 8% (56%) and venous saturation (S preox O2) of 75 ± 3% (78%) was seen in all patients (Tab. III). Mean oxygen transfer in patients was 163 ± 35 ml/min (178 ml/min).
Oxygenation data including hemoglobin levels in the clinical cases
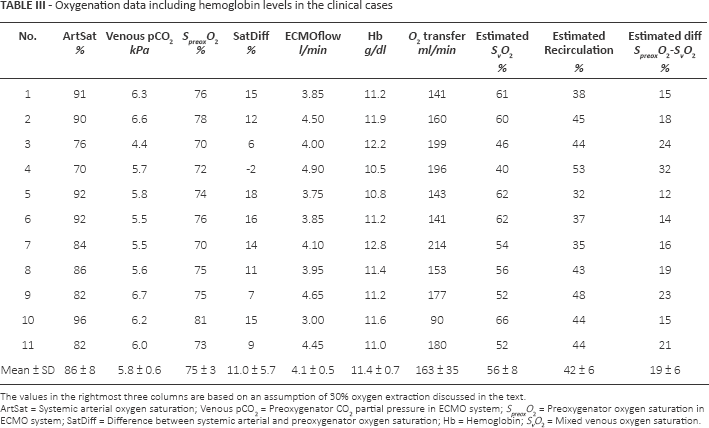
The values in the rightmost three columns are based on an assumption of 30% oxygen extraction discussed in the text.
ArtSat = Systemic arterial oxygen saturation; Venous pCO2= Preoxygenator CO2partial pressure in ECMO system; SpreoxO2= Preoxygenator oxygen saturation in ECMO system; SatDiff = Difference between systemic arterial and preoxygenator oxygen saturation; Hb = Hemoglobin; SvO2= Mixed venous oxygen saturation.
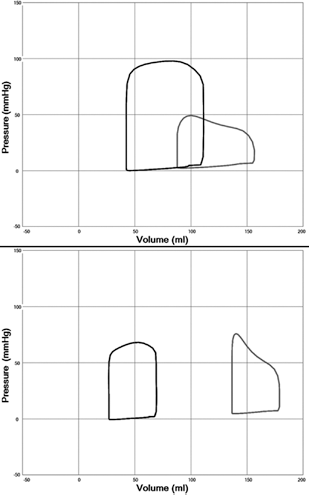
Left (black) and right (grey) ventricular pressure-volume loops with pulmonary vascular resistance 3.4 Woods unit (upper panel) and 12.2 Woods unit (lower panel). Dilatation of the right ventricle is seen in the lower panel with a reduction of the left ventricular volume due to lower right heart stroke volume, the constraining effect of the pericardium and ventricular septal interaction.
Discussion
Recirculation is always present and relevant during veno-venous ECMO in the presented clinical data, albeit difficult to measure. Recirculation increases with increasing ECMO flow and decreasing cardiac output and is highly dependent on choice of cannulation sites in simulation data. Recirculation is usually above 15% to 20% with clinical flow settings and pre-oxygenator saturation in the ECMO circuit is therefore considerably higher than the mixed venous saturation (SvO2). A more peripheral drainage site decreases recirculation substantially in the simulation model in agreement with published data (7).
Pre-oxygenator saturation is an unpredictable measure of oxygenation
Simulation data shows that venous pre-oxygenator saturation (S preox O2) is an unreliable measure of treatment efficiency in veno-venous ECMO. Oxygen saturation in venous drainage blood (S preox O2) may both increase and decrease in patients with circulatory deterioration. The slight decrease in venous pre-oxygenator saturation seen in our simulation of low cardiac output due to right heart failure (Figs. 4a and b and 5) illustrates the low sensitivity of this parameter to life-threatening changes in hemodynamics. This is explained by a combination of increasing recirculation and lowered S v O2. In the most extreme form of circulatory deterioration, cardiac arrest, pre-oxygenator saturation in VV-ECMO will be 100% without any benefit to the patient. Together with available clinical experience and sparse scientific data, this suggests that arterial oxygenation parameters rather than venous saturations should be used for optimizing therapy (ECMO flow rate and cannula position).
Cannulation modes
In our clinical cohort, all patients were treated with drainage from the right atrium and reinfusion into the inferior cavalvein. The reason for this clinical tradition is anecdotal experience from the 1990s suggesting better drainage and flow stability. However, both simulation data and a clinical study (7) indicate that lower flow may be needed to oxygenate the patient with flow from the femoral vein to the atrium or with a Wang-Zwische/Avalon cannula (9). Furthermore, maximal flow was higher in the clinical study when draining from the femoral/caval vein and reinfusing into the atrium (7).
Oxygen extraction
The figure used in our calculations of 30% oxygen extraction is based on normal physiology, where arterial saturation is 95% to 100% and SvO2is 65% to 70% with normal metabolism and cardiac output. Critical ill patients may vary considerably in both cardiac output and metabolism, but an oxygen extraction of 30% is still a reasonable estimate (7), since the most severe cases of septic distributive shock and cardiac failure are excluded in a cohort of patients with VV-ECMO.
Limitations
Many clinical features of veno-venous ECMO are captured by the simulation. However, there are some limitations. Our simulation model does not include changes in pCO2, bicarbonate, pH, and base excess, since focus is on recirculation and oxygen transport. The shift of the oxygen dissociation curve due to these factors is, however, usually less important for oxygenation than recirculation in these patients.
It has been shown clinically that dissolved oxygen is of importance for oxygen delivery when high levels of oxygen are provided to the patient either in the ventilator or in the ECMO circuit (8, 16). We have considered dissolved oxygen in post-oxygenator blood where pO2may be extremely high, but not included this in oxygen transport calculations in the simulated patient, since it is of minor importance below a pO2of 9 kPa to 10 kPa as is seen in VV-ECMO patients.
Recirculation in simulation of VV-ECMO with drainage from inferior+superior caval vein and return of oxygenated blood in the right atrium is higher than values reported from clinical measurements in patients with the Wang-Zwische/ Avalon cannula (9). This may be explained by limitations of the model, where return of blood mixes instantly with atrial blood without a directed flow jet towards the tricuspid annulus. It must be understood, however, that despite an optimal cannula position some recirculation will occur because of a continued return flow during systole as well, when the tricuspid valve is closed.
Conclusion
The simulation results suggest that recirculation is a significant clinical problem in veno-venous ECMO, in agreement with the clinical experience of the authors. Due to the difficulties in measuring recirculation and interpreting the pre-oxygenator venous oxygen saturation, flow settings and cannula positioning should be optimized by arterial saturation and pO2, while the pre-oxygenator saturation can be used in calculations of ECMO oxygen transfer. The good agreement between simulated and clinical data supports the relevance of the simulation model in quantifying and understanding recirculation.
Footnotes
Financial Support: Michael Broomé's research during the years 2013–2015 is being funded by The Swedish Research Council Grant 2012–2800.
Conflict of interest: Michael Broomé is the founder and owner of the company Aplysia Medical AB, which is developing the simulation software Aplysia CardioVascular Lab. There are no other conflicts of interest.
Meeting presentation: A preliminary version of this study was presented as a poster at the EuroELSO meeting in Stockholm in May 2013.