
Abstract
Despite its enormous complexity, human plasma is still one of the most frequently used body fluids for identification and quantification of health and disease biomarkers. We have developed a new workflow for qualitative and quantitative analysis of human plasma proteins. The first step was to remove the seven most abundant plasma proteins (MARS). Moreover, in order to reduce the complexity of the sample and to increase protein and proteome coverage, Off-Gel fractionation was performed at peptide level. Our own stable isotope-based quantitative proteomics approach termed AniBAL was chosen for relative quantification of proteins between conditions. The method was developed with commercial human plasma and resulted in the identification of 85 proteins, of which 68 revealed quantitative information (Mascot database search combined with Peptide-/ProteinProphet validation). The combined methods consisting of MARS, AniBAL, Off-Gel and nano-LC-MS/MS on a Bruker HCT ion trap represent a new and efficient platform to quantify human plasma proteome differences between conditions. The method was also found technically compatible to a pair of human plasma pilot samples from the European FP6 project “DiOGenes”. Many of the identifiable/quantifiable proteins are relevant to obesity, diabetes and inflammation, which form the context of investigation within “DiOGenes”.
Introduction
Despite its huge complexity and dynamic range, human blood plasma is still a preferred diagnostic body fluid to detect quantitative proteome changes and identify biomarkers related to health and disease. 1 Besides its ease of collection with little invasive means, blood perfuses all organs and thus should bear health/disease-related signatures.
Health and disease biomarkers are often present at low concentrations and their detection and quantification are therefore challenging. Plasma contains indeed several high-abundant proteins that seriously interfere with the detection of lower abundant ones. A major contributing factor to the analytical challenge of characterizing the plasma proteome is that a single protein, albumin, comprises ~50% of the protein content (www.plasmaproteome.org). Anderson et al. plotted the range abundance for 70 protein analytes in plasma. 1 At the high abundance end, there is plasma albumin (35 – 50 x 109 pg/mL) and at the low abundance end, interleukin 6 (normal range 0–5 pg/mL). These two clinically useful proteins differ in plasma abundance by a factor of 1010. Due to their low abundance, cytokines and protein hormones were almost completely absent from the proteomics data. High abundant proteins comprise about 99% of plasma content. 2 Exactly which proteins make up the top 99% of the plasma proteome is somewhat ambiguous and may vary between subjects due to the wide concentration ranges of many plasma proteins in the normal population. The selective removal of highly concentrated proteins by affinity chromatography is one of the methods to enrich low-abundant proteins.3–5
Besides this specific depletion, further sample pre-fractionation is necessary to decrease the complexity of the protein/peptide mixture before mass spectrometric analysis. 6 Pre-fractionation methods as well as alternatives to two-dimensional gel electrophoresis (2-DE) are deployed to divide proteomes into smaller subsets, to identify as many proteins, or patterns of these, as possible and detect low-abundance biomarkers for different human conditions. 7 Off-Gel electrophoresis (OGE) is a powerful and versatile approach for proteomics that enables protein or peptide fractionation by isoelectric focusing (IEF) in solution.8–10 Heller et al. provided evidence that two-stage OGE, i.e. protein- followed by peptide fractionation, can further enhance proteome coverage. 11
The determination of changes in protein expression is a key element in proteome research and widely applied for the functional analysis of biological systems and the detection of diagnostic, prognostic and clinical biomarkers. Traditionally, most of the quantitative proteomic experiments have been conducted with 2DE as the main separation and visualization technique and include 2D gel image comparison to obtain relative quantitative information. 12 More recently, stable isotope-based approaches have been employed in combination with shotgun strategies to obtain quantitative proteome-wide results.13,14 Our group developed and validated a new stable isotope-rooted, gel-free quantitative proteomics approach, termed Aniline and Benzoic Acid Labeling (AniBAL), using a symmetric twin chemistry targeting two amino acid functionalities, namely carboxylic and amino groups. 15 These two amino acid side chains are frequent and often complementarily dispersed throughout protein sequences and provide therefore excellent protein sequence and proteome coverage as demonstrated in silico and in vitro. 15 Furthermore, the approach is simple, rapid, robust and cheap in terms of its biochemical performance.
The choice of separation and analysis methods and their integration into a workflow for identification and quantification of biomarkers in plasma is as critical as it is challenging. Each step comes at a benefit vs. investment ratio and the combination of multiple technologies must match objectives and constraints of a biomarker project, with the latter including timelines and resources. Three recent reviews summarize current established techniques for biomarker identification and quantification in human body fluids.16–18
The aim of the present work was to develop, validate and implement a quantitative proteomics workflow encompassing (i) depletion of the seven most abundant plasma proteins (IgG, IgA, HSA, Transferrin, Haptoglobulin, α1-Antitrypsin, Fibrinogen); (ii) AniBAL, i.e. stable-isotope labeling of protein amino and carboxylic groups; (iii) tryptic digestion; (iv) Off-Gel isoelectric focusing and fractionation at peptide level; and (v) nanoLC-MS/MS-based peptide identification and quantification. Results were generated by applying stringent search and filter criteria to validate each protein identification and quantification: Mascot algorithm in combination with Peptide- and ProteinProphet from the Trans Proteomics Pipeline as previously described; 15 a probability cut off of >0.9 and a false-positive rate of <5%.
Finally, the developed workflow was tested in terms of technical compatibility with real-life samples derived from the five-year European DiOGenes project (www.diogenes-eu.org). Within this project, human obese subjects subjected to a run-in weight loss and a subsequent weight maintenance phase, the latter with different diets, have been analyzed for revelation of potential plasma protein biomarkers for weight loss/maintenance and dietary intervention. The application of our workflow to DiOGenes pilot samples confirmed that all procedures are technically compatible.
Materials and Methods
All chemicals were purchased from Sigma-Aldrich (Buchs, Switzerland) at the highest purity level available, unless stated otherwise.
Plasma Sample Preparation
Human plasma was purchased from Sigma. The lyophilized plasma was dissolved in 5 mL water, aliquoted into 100 µL portions, then frozen and stored at -20 °C until use. Pilot samples from the European DiOGenes project (www.diogenes-eu.org) (one male and one female donor) were used for method application and validation.
Plasma Depletion
The depletion of the seven most abundant proteins (albumin, transferin, IgG, IgA, haptoglobin, antitrypsin and fibrinogen) in human plasma was achieved with the HPLC column-based Multiple Affinity Removal System (MARS, Agilent Technologies, Basel, CH) and the corresponding preparation kit. Each plasma aliquot was diluted four times with the manufacturer's equilibration buffer, filtered through a 0.22 µm spin filter by spinning at 16,000 x g at RT for 1 min. 100 µL of the sample were injected onto the MARS affinity column (4.6 mm x 100 mm). The flow-through fractions containing unbound proteins from sequential injections were collected. For the depletion performance experiments, 100 column regeneration cycles with total plasma were conducted; the pooled flow-through fractions thereof were desalted and concentrated with a 5 K MWCO spin concentrator (45 min at 5,000 x g). After protein quantification using the Bio-Rad Protein Assay based on the Bradford method, 100 µg aliquots were prepared and stored at -20 °C until further use.
Nota bene: during mass spectrometric analysis of the depleted and labeled human plasma samples, no peptides for IgG, IgA, albumin, transferrin, haptoglobulin, fibrinogen and alpha1-antitrypsin were detected.
AniBAL Stable-Isotope Labeling
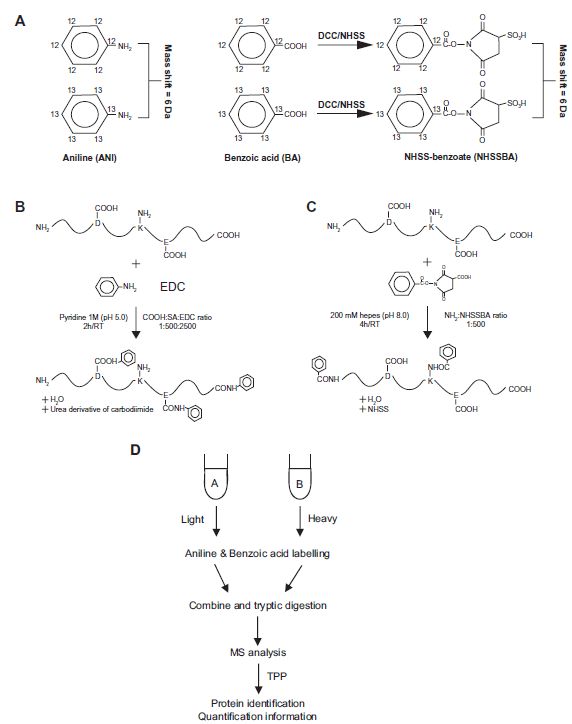
The AniBAL approach is an in-house developed stable-isotope labeling technique that enables relative quantitative analysis of complex proteome samples. 15 The workflow uses a twin chemistry tagging both, carboxylic and amino groups, at protein level. Both reactions are based on carbodiimide chemistry to activate carboxylic groups for further reaction with primary amino groups. Labeling is performed for each reactant with light ( 12 C-) and heavy (six-fold 13 C-) forms, with a mass shift of the light vs. heavy tags of 6 Da. As basic and acidic side chains are frequent and complementarily dispersed in protein sequences, this twin labeling provides high protein sequence coverage and, as a consequence, good quantitative proteome coverage (as shown in silico in) 15 and enables the pair-wise comparison of samples in two complementary data sets. 15
The AniBAL chemistry and workflow are shown in Figure 1 with Figure 1A summarizing the chemical synthesis. Aniline (either 12 C or 13 C) is used as reagent for carboxylic groups. Benzoic acid (either 12 C or 13 C) on the other hand is used to label amino groups. To be reactive, it is first transformed into the stable reactive intermediate NHSS benzoate. Figures 1A and B present the reaction scheme for aniline and NHSS benzoate, respectively. The global workflow is schematically presented Figure 1D. One aliquot each of the sample, A and B, are derivatized using aniline and benzoic acid-based chemistry, respectively, nota bene at protein level. After derivatization, the light and heavy labeled samples of aniline- and benzoic acid reaction, respectively, are mixed, proteins are precipitated and digested with trypsin before mass spectrometric analysis. Data are then extracted and submitted to database search before validation and quantification at the peptide level. Both labeling data sets (light vs. heavy aniline and light vs. heavy benzoic acid) are combined at peptide level into a single protein level result file that combines the quantitative information for both labeling approaches.
AniBAL chemistry and workflow.
15
AniBAL labeling was applied to the MARS-depleted plasma as previously described. 15 Briefly, two aliquots consisting of 100 µg depleted plasma each were derivatized in 20 µL 1 M pyridine pH 5.0 containing 0.625 M of either light or heavy (6-fold 13 C labeled) aniline and sonicated for 10 min. Ten µL of a 2.5 M EDC solution were added to start the reaction. Both aliquots were incubated for 2 h at RT and the reaction was stopped by addition of 5 µL acetic acid. The light and heavy labeled samples were then mixed in a ratio of 1:1 and proteins precipitated using the ProteoExtract kit (Calbiochem, VWR, Dietikon, CH). In parallel, two aliquots of 100 µg were derivatized in 40 µL 0.2 M HEPES, pH 8.0 with 12.5 µmol of either light or heavy (6-fold 13 C labeled) NHSS-benzoate. After 4 hours of derivatization at room temperature the two samples (light and heavy) were mixed (1:1) and proteins were precipitated.
For both derivatizations, the pellets were re-suspended in 80 µL 0.1 M ammonium bicarbonate/8 M Urea, reduced for 30 min at 60 °C by adding 10 µL of 0.045 M DTT, alkylated 30 min at room temperature in the dark by adding 10 µL 0.1 M iodoacetamide and then digested overnight with trypsin (Promega) (1:50 w/w trypsin/protein) in 2 M urea in 0.1 M ammonium bicarbonate at 37 °C. The reaction was quenched with 10% TFA to reach a final concentration of 0.1% TFA. The digest was dried and stored at -20 °C until OGE fractionation.
To test the compatibility of AniBAL quantification with the DiOGenes real-life samples, one 100 µL aliquot each of two different human plasma samples (one male and one female donor) were prepared in duplicates. The aliquots of the male sample were then labeled with light aniline and light benzoic acid, whereas the female sample aliquots were tagged with the heavy analogues of the two reagents. The aniline-labeled and the benzoic acid labeled aliquot pairs were mixed in a 1:1 ratio.
Peptide Off-Gel Electrophoresis
For pI-based peptide separations, the 3100 Off-Gel Fractionator (Agilent Technologies) was used according to the protocol of the supplier. Depending on the AniBAL derivatization performed, either pH 3–10 (Agilent Technologies) for benzoic acid or pH 7–11 NL immobiline dry strips (GE Healthcare) for aniline with a 12- and 24-well setup were used. Fifteen minutes prior to sample loading, 13 and 24 cm long IPG gel strips were rehydrated with 20 µL of focusing buffer per well. Two-hundred µg of the plasma samples were resolubilized in 375 µL and 750 µL for 12 and 24 wells, respectively. One hundred fifty µL, equaling 200 µg depleted and labeled plasma, were loaded into each well. IEF was performed with a maximum current of 50 µA and, typically voltages ranging from 500 to 4,000 V were applied until 20 and 50 kVh were reached for 12-and 24-well separations, respectively. The recovered fractions (volumes between 50 and 150 µL) were dried and stored at -20 °C for future use.
NanoLC-ESI-MS/MS
The nanoLC-MS/MS data were acquired on an HCT ultra ion-trap mass spectrometer (Bruker Daltonics, Bremen, Germany) coupled on-line to an Ultimate 3000 HPLC system (Dionex) equipped with an analytical Magic C18 reversed-phase column (100 x 0.075 mm, 5 µm) (Spectronex, Basel, CH). The scan range was set to m/z 400–1'600. The nanoflow pump delivered the following solvents: A = 0.1% formic acid, 2% ACN in water; B = 0.1% formic acid, 20% water in ACN. For each injection, the peptide mixture was loaded and washed for 10 min with 10% solvent B on a C18 PepMap100 trapping column (5 x 0.3 mm, 5 µm) (LCPackings, Netherlands) at a flow rate of 20 µL/min. The elution followed a linear gradient of 10%–50% solvent B at a flow rate of 0.3 µL/min over 60 min. Peptides were analyzed using the “peptide scan” option of the HCT ultra system, consisting of a full-scan MS spectrum acquisition in “standard-enhanced” mode (8,100 m/z/sec) for charge state assignment based on the isotope envelope. This was followed by three MS/MS scans in “ultra scan” mode (26,000 m/z/sec) on the three most abundant ions with exclusion of singly charged ions and the preferred charge state set to double for MS/MS selection. Each analysis was performed in duplicate.
Peptide and Protein Identification by Mascot Search and Trans-Proteomic Pipeline
Bruker yep files were transformed to mzXML using an in-house written Perl script (yep2MzXML, employing the CompassXport application from Bruker). Mascot-compatible mgf-files were extracted from the mzXML-files using the TPP-script MzX-ML2Search, then submitted to Mascot search (Matrix Science, London, UK) and further validated by the Trans-Proteomic Pipeline v3.4 (Inst. Systems Biol., Seattle, WA, USA).
Data were searched with the Mascot search engine against the human IPI database. Static and variable modifications according to aniline and benzoic acid labeling were added in the Mascot parameter file as previously described. 15 Briefly, the Mascot search parameters were set as follows: Trypsin and ArgC cleavage for aniline and benzoic acid labeling, respectively; in both cases, up to 2 missed cleavages were allowed; 100 ppm for peptide tolerance and 0.6 Da for MS/MS tolerance were set; carbamidomethyl (C), Aniline_light (D,E) for aniline labeling and BA_light (K) for benzoic acid labeling were set as fixed modifications; oxidation (M), deamidation (N,Q), aniline_heavy (D,E) for aniline labeling and BA_heavy (K) for benzoic acid labeling were defined as variable modifications.
For protein validation and quantification, mzXML and Mascot results files were further analyzed with the Trans-Proteomic Pipeline. Peptide identification and validation was performed with PeptideProphet™, and the results filtered using a 0.05 error rate. Quantification was done with the Xpress 19 and/ or ASAP ratio 20 modules. Finally, protein identification and quantification were validated using ProteinProphet™, with a protein probability set to >0.9 and a ratio for the light form fixed to 1. For Xpress and ASAP ratio calculations, the required number of identified and quantified peptides was set to strictly minimum 3 and 1, respectively. These values have been estimated via several experiments. Indeed, this is the required minimum number of peptides in order to avoid taking in consideration results which could distort the protein quantification.
The proteins were quantified using both the Xpress 19 and the ASAP 20 ratio tools from the Trans-Proteomic Pipeline. The Xpress software automates protein expression calculations by accurately quantifying the relative abundance of labeled peptides from their chromatographic co-elution profiles. Starting with the peptide identification, Xpress isolates the light and heavy peptide elution profiles, determines the area of each peptide peak, and calculates the abundance ratio based on these areas. The ASAP algorithm is a complementary automated statistical analysis of protein abundance ratios derived from stable-isotope dilution and MS/MS data. The algorithm uses numerical and statistical methods, such as Savitzky-Golay smoothing filters, statistics for weighted samples, and Dixon's test for outliers, to evaluate relative protein abundance ratios.
Results and Discussion
Before discussing method development details, we here-under pre-empt the optimized workflow that offered the best compromise between analytical resource investment, sample throughput and result quality:
Depletion of the 7 most abundant proteins by MARS (multiple affinity removal system);
Both benzoic acid and aniline tagging as 2 complementary derivatizations performed at protein level, upstream in the workflow;
Reduction, alkylation and digestion followed by 24 fractions OGEpept with pI range of 3–10 for benzoic acid and 7–11 for aniline labeling, respectively;
Identification and quantification of proteins by nano-LC-ESI-MS/MS; and
Data processing and validation with the Trans-Proteomic Pipeline (TPP) tool including Xpress and ASAP ratio calculations using stringent acceptance criteria.19,20
MARS Depletion
Specific removal of abundant proteins prior to protein separation and–-eventually–-identification is necessary to more extensively explore the human blood plasma proteome. Several publications have reported that immunoaffinity depletion is the most efficient and specific method to deplete the most abundant proteins and prepare human plasma samples that provide access to lower abundant proteins.3–6,21–23 In particular, the Multiple Affinity Removal System (MARS) from Agilent Technologies, which depletes plasma from the 7 most abundant proteins (albumin, transferrin, haptoglobin, α-1-antitrypsin, IgG, IgA and fibrinogen) is increasingly being used and recommended. We chose the 4.6 x 100 mm MARS column to fulfill this task. Typical chromatograms were obtained appearing to be coherent with the profiles obtained by the supplier: Figure 2A shows that three different replicates (injections 1, 10 and 20) of the plasma depletion are chromatographically identical. An SDS-PAGE analysis shows highly similar protein compositions of the three depleted plasma replicates (flow-through) at the level of protein band patterns (Fig. 2B). These results confirm that the column can be operated and regenerated long-term reproducibly over multiple cycles of application. This result has already been reported by different authors.4,5,23–25 The total run time including loading and elution was 28 min. The flow-through fractions containing the low-abundant proteins from sequential injections were collected in the time interval from 1.5 min to 4.5 min and then pooled.
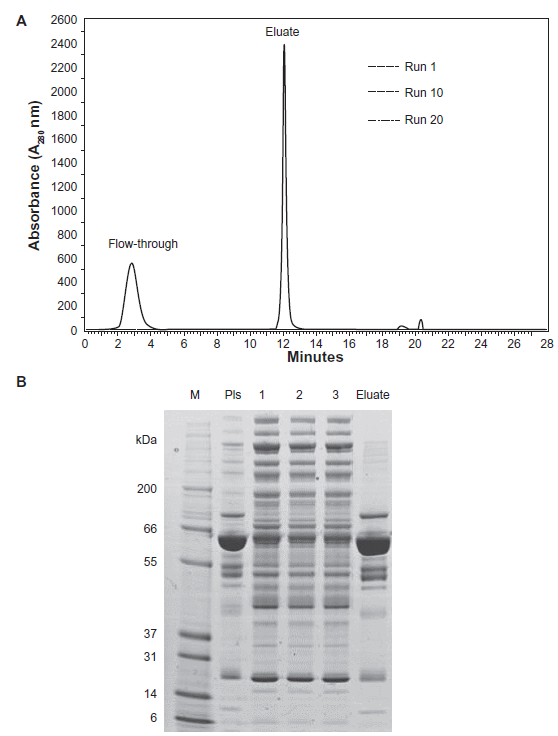
Reproducibility of chromatographic runs with the MARS column.
AniBAL labeling
The quantification of protein expression differences between two or more (patho-) physiological states of a biological conditions is an elementary and challenging objective in proteomics.26–28 The most common quantitative mass spectrometry workflows are: in vivo metabolic labeling at cell or tissue level;29–31 in vitro chemical labeling at protein level; absolute quantification with spiked, labeled peptides; and direct label-free comparison of LC-MS/MS runs.32–34 Until recently, all current chemical approaches at protein level have targeted single amino acid functionality. Most of the applied reagent kits, e.g. ICAT or iTRAQ, are costly. AniBAL, a recent stable-isotope-coded method developed in our group, roots in a twin chemistry approach tagging both, carboxylic and amino groups and applies two simple and inexpensive reagents, aniline and benzoic acid, 15 resulting in the same amide-bonded benzoyl modification in the protein.
The MARS-depleted plasma was labeled according to the AniBAL method. Briefly, both reactions are based on carbodiimide chemistry to activate carboxylic groups for further reaction with primary amino groups. Labeling is performed for each reactant with light ( 12 C-) and heavy (six-fold 13 C-) forms, with the light and heavy tags exhibiting a convenient mass offset of 6 Da. Thanks to the high frequency and complementary distribution within the protein sequence of lysine and glutamic/aspartic acids side chains, AniBAL offers good protein sequence and proteome coverage in terms of both, identification and quantification, as demonstrated in silico and in vitro. 15
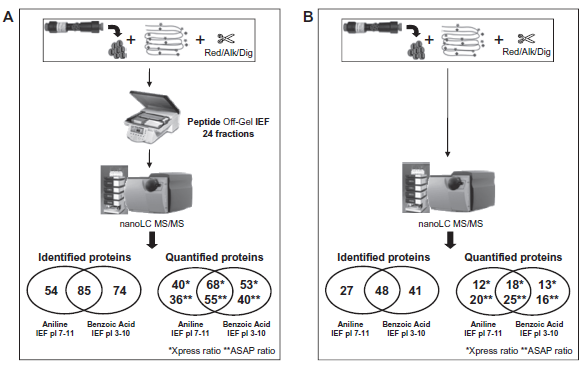
The complementarity of aniline and benzoic acid tagging for protein identification and quantification is demonstrated in Figure 3A: 54 proteins were identified with aniline and 74 with benzoic acid. The combined protein output resulted in the identification of 85 proteins. We found the same performance regarding protein quantification: the combination of the 2 labeling strategies delivered quantification of 68 (Xpress module of TPP) and 55 (ASAP module of TPP) proteins, whereas with aniline or benzoic acid alone, only 40 (Xpress)/36 (ASAP) and 53 (Xpress)/40 (ASAP) proteins were quantified, respectively. Thus, aniline and benzoic acid labeling showed good complementarity with a total of 85 identified proteins, of which a total of 68 revealed quantitative information, nota bene after removal of the seven most abundant proteins that typically show up in plasma proteomics with many redundant and masking peptide identifications.
Numbers of protein identifications and quantifications of the commercial depleted-labeled plasma, obtained by nanoLC-MS/MS.
Off-Gel IEF Fractionation
Assessment of the OGE pre-fractionation vs. direct LC-MS/MS after MARS depletion
We evaluated the advantages of the OGE fractionation in terms of protein/peptide resolution taking into consideration DiOGenes project milestones as well as the number of samples to be analyzed. Figure 3B shows the results obtained by nanoLC-MS/MS analysis of depleted-labeled-reduced-alkylated-digested human plasma without prior OGE separation. The comparison with the workflow including OGE (Fig. 3A vs. Fig. 3B) led to the conclusion that OGE raised the protein identifications from 48 without OGE to 85 with OGE separation. The same conclusion was drawn in terms of quantification output: indeed, OGE fractionation improved the number of quantified proteins from 18 to 68 for Xpress ratio and from 25 to 55 for ASAP ratio.
Determination of Adequate IEF Parameters (without AniBAL)
Off-Gel™ isoelectric focusing is a versatile tool to reproducibly fractionate intact proteins (OGEprot) or peptides (OGEpept) into distinct liquid fractions, based on their isoelectric points. The goal of this optimization was to assess in particular fractionation at peptide vs. protein level and more or less extensive separation into 24 or 12 wells. Table 1 summarizes the obtained results.
Summary of the analysis of depleted commercial human plasma: Comparison of LC-ESI-MS/MS analysis after peptide- (OGEpept.) or protein- (OGEprot.) level Off-Gel IEF and with 12 or 24 Off-Gel IEF fractions, respectively.
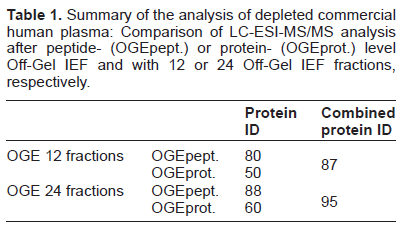
After IEF protein fractionation of the depleted plasma followed by reduction, alkylation and tryptic digestion of the 12 and 24 fractions, LC-MS/MS analysis yielded 50 and 60 identified proteins, respectively. After IEF at the peptide level, 80 and 88 proteins were identified by LC-MS/MS analysis of 12 and 24 OGE fractions, respectively. The combined output resulted in the identification of 87 proteins for 12, and 95 for 24 OGE fractions, respectively. Thus, the best compromise between efficiency and effort was peptide-level OGE of the depleted, reduced and alkylated and digested plasma in 24 OGE fractions.
IEF Range Adaptation to AniBAL Labeling
In order to determine the adequate pI range for OGE fractionation of labeled peptides, depleted and AniBAL labeled plasma was reduced, alkylated and digested with trypsin followed by OGE separation. First, the peptide separation was performed on 24 OGE fractions with the full pI range from 3 to 10. NanoLC-ESI-MS/MS analysis of all fractions showed an efficient proteome fractionation over the full pH range for the peptides labeled with benzoic acid. Indeed, each distinct fraction was composed of 10 to 31 identified proteins. We obtained the identification of a total of 74 proteins, of which 53 (Xpress ratio) and 40 (ASAP ratio) revealed quantitative information (Fig. 3A).
However, this was not the case for the aniline-labeled peptides. Due to the blocking of all amino acid carboxylic groups, the labeled peptides shifted towards a more basic pI. Thus, no proteins were identified from fraction 1 to fraction 15. The peptides were only fractionated from fraction 16 to fraction 24. Nano-LC-MS/MS analysis resulted in the identification of 29 proteins, 26 of which revealed quantitative information. Therefore, a pI range from 7 to 11 was tested instead. Nano-LC-MS/MS analysis yielded 54 identified proteins, 40 of which revealed quantitative information. The combined protein output of aniline and benzoic acid labeling led to the identification of 85 proteins and the quantification of 68 (Xpress ratio) and 55 (ASAP ratio) proteins (Fig. 3A).
Reproducibility and Efficiency of OGE Fractionation following AniBAL Labeling
The reproducibility of Off-Gel isoelectric focusing of peptides and proteins has already been demonstrated by several authors.11,35–38 Stalder et al. evaluated the reproducibility of protein identification results after Off-Gel electrophoresis separation of depleted human serum proteins. 38 In our study, peptide Off-Gel electrophoresis was performed on depleted-labeled human plasma. Figure 4 shows the number of all identified peptides or proteins in each fraction (12 OGE fractions) obtained with both labeling methods (Aniline, pI 7–11 and Benzoic acid, pI 3–10). For total identified peptides distributed across the wells (Fig. 4A), the coefficient of variation (CV) was found to be below 25%. Moreover, taking all fractions together, an average CV below than 17% was found. For total identified proteins (Fig. 4B), the CV was calculated from 3 to 25% with an average below 17%. Comparing Aniline vs. Benzoic Acid labeling, we obtained relatively homogenous CV for both of them across the pI range.
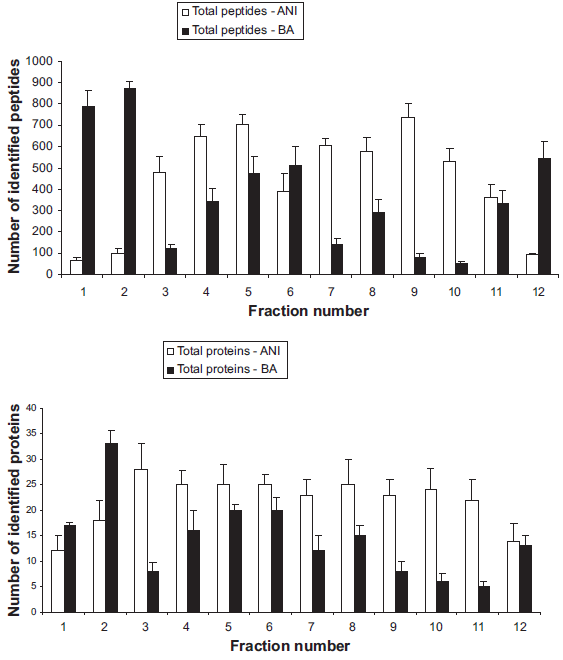
Total number of identified peptides
Without any peptide labeling, i.e. in the case of IEF of native tryptic peptides, acidic peptides focus significantly better than neutral and basic peptides. 37 With our BA-labeled samples, we observed the same tendency. Indeed, acidic peptides and proteins (2 first wells) focused better compared to the rest of the pI range. With peptides and proteins labeled with aniline, the analysis was done from pI 7 to 11. In this case, except for extreme pI, we observed that the trend was rather homogenous across the pI range with relatively same peptide and protein identification.
All these results corroborate previously published studies using the same or similar IEF approaches based on IPG strips. Therefore, we conclude that peptide Off-Gel electrophoresis provides good reproducibility and efficiency for labeled peptides. Moreover, these results also prove the good reproducibility and efficiency of our AniBAL approach.
Reproducibility of the Entire Workflow
Figure 5 demonstrates the reproducibility of the entire workflow based on the total number of identified proteins by both Aniline and BA labeling. The Venn diagram of the proteins identified from three workflow replicates shows similar numbers for each run (77, 75, and 78, respectively). Most importantly, 63 proteins thereof (~82%) were identified in all three replicates; only 5 or 4 proteins, respectively, were found in the overlap of two replicates; and only 3 to 6 proteins were unique for one replicate. These numbers indicate the high degree of reproducibility of our workflow and reflect the performance of previously published studies using similar approaches. However, only few papers combining OGE fractionation with protein quantification and statistical evaluation of method reproducibility were published. Thereof, the following three–-at least method- or scope-wise related–-papers are selected, although not necessarily the same aspect of reproducibility was assessed:
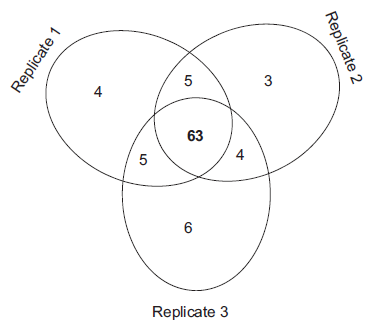
The Venn diagram of the proteins identified from three workflow replicates shows similar numbers for each run (77, 75, and 78, respectively); 63 proteins thereof (~82%) were identified in all three replicates; only 5 or 4 proteins, respectively, were found in the overlap of two replicates; and only 3 to 6 proteins were unique for one replicate.
Fraterman et al. combined peptide Off-Gel fractionation and label-free quantification. 35 They showed that approx. 70% of the peptides were reproducibly found unique to one respective OGE fraction; in other words: the peptide-level separation power turned out to be high and reproducible.
Taylor et al. showed with multi-dimensional protein identification technology (MudPIT) coupled to mass spectrometry-based identification that 87% of the proteins were detected in all three technical replicates. 39
Keshishian et al. demonstrated high reproducibility of their human plasma biomarker method that consisted however of targeted MRM-based mass spectrometric assays and stable isotope dilution. 40
Protein Quantification and Data Processing
The proteomic data analysis package Trans-Proteomic Pipeline (TPP, Institute for Systems Biology, Seattle Proteome Center, http://tools.proteomecenter.org/software.php) enables identification and quantification of proteins as well as in silico validation of the results. Two calculation methods for quantification are available: Xpress and ASAP ratio. Stringent protein and peptide identification and quantification criteria were applied: protein probability of >0.9 and false-positive rate of <5%, and for Xpress and ASAP ratio, a minimum number of quantified peptides of strictly greater than 3 and 1, respectively, were defined.
The AniBAL technique was tested and validated with a 1:1 mix of two MARS-depleted aliquots of commercial human plasma. This served to confirm the applicability of AniBAL to MARS-depleted human plasma and to select the quantification parameters within Xpress and ASAP ratio calculations. The workflow was validated with 2 replicate aliquots of each 100 µL of depleted plasma (400 µg of depleted plasma protein material per aliquot) in a 1:1 ratio. Both tagging methods applied to depleted plasma and followed by OGE fractionation resulted in the identification of 85 proteins, of which 68 with Xpress and 55 with ASAP ratio calculations revealed quantitative information with a ratio L/H mean of 0.90 ± 0.10 and 0.91 ± 0.13 for Xpress and ASAP ratios, respectively (Fig. 3 and Table 2).
Proteins identified by nano-LC-ESI-MS/MS in commercial human plasma after MARS depletion, reduction/ alkylation/digestion and Off-Gel peptide IEF fractionation. Quantification results of a 1:1 plasma mix labelled with light/ heavy aniline and light/heavy benzoic acid are also given.

The ratios correspond to the average of all Xpress or ASAP ratios of MS duplicate analyses and the two labeling strategies. Protein identification and quantification were validated using ProteinProphet™, with a protein probability. 0.9 and a ratio for the light form fixed to 1. For Xpress and ASAP ratio calculations, the required number of quantified peptides was strictly set to minimum 3 and 1, respectively. Protein ratios that did not meet these criteria are marked with an asterisk. At least 2 values (MS and/or label) are necessary to validate the protein Xpress and ASAP ratios. If a protein was identified with both labeling strategies, the maximum sequence coverage and number of peptides are reported.
Method Validation
The optimized workflow was applied to pilot samples from DiOGenes to assess technical compatibility with real-life sample properties. The goal of this analysis was not to compare male and female plasma at proteome level but rather to perform an analysis of pilot samples in order to confirm that the developed workflow was technically compatible with the collected real-life human plasma samples of the DiOGenes project.
One plasma sample each from a male and a female donor were analyzed. The male plasma was labeled with the light forms of the AniBAL reagents and the female with the heavy forms. By nano-LC-MS/MS analysis, 72 proteins were identified, of which more than 50 proteins revealed quantitative information based on Xpress and ASAP ratio calculations. Six proteins were found present in significantly different amounts between the two samples: Alpha-2-macroglobin, apolipoprotein E, complement C4-A, complement component C4-B1, IGHA1 protein and serum amyloid A-4 protein (Table 3). These 6 proteins showed differential ratios of female/male from 0.53 to 2.31 (average of duplicate MS analysis + two labeling approaches + Xpress and ASAP ratios).
List of the six proteins found in different quantities when comparing a male and a female donor (pilot, real-life DiOGenes samples). These proteins were identified by nano-LC-MS/MS of the depleted-labeled-OGE fractionated plasma.
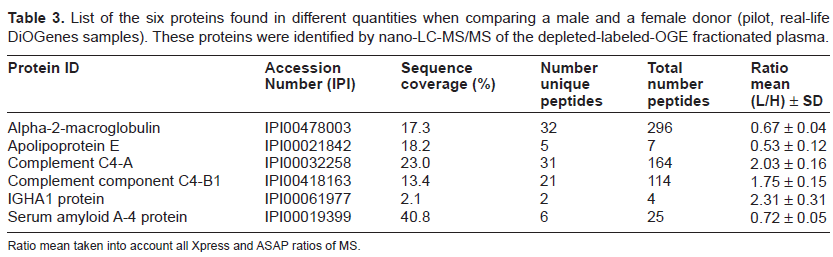
Ratio mean taken into account all Xpress and ASAP ratios of MS.
Conclusion
We report here the development of a robust method and workflow for qualitative and quantitative analysis of human plasma. Access to the lower abundant plasma proteome was facilitated through the depletion of the seven most abundant plasma proteins by immunoaffinity separation using the MARS column. We further fractionated depleted plasma proteins by OGE prior to nanoLC-MS/MS and obtained quantitative proteome information thanks to AniBAL, an efficient in-house developed quantitative proteomics approach. 15 Thus, the combined procedures of MARS, AniBAL, OGE and nano-LC-MS/MS with a Bruker HCT ion trap is new and build an efficient platform to quantify human plasma proteome differences between conditions.
The analysis of pilot samples confirmed that the current workflow revealed a high level of reproducibility and robustness and is technically compatible with the collected real-life human plasma samples and the time frame of the EU FP6 project DiOGenes.
Disclosures
This manuscript has been read and approved by all authors. This paper is unique and is not under consideration by any other publication and has not been published elsewhere. The authors and peer reviewers of this paper report no conflicts of interest. The authors confirm that they have permission to reproduce any copyrighted material.
Footnotes
Acknowledgements
The authors would like to thank Francia Arce-Vera for NMR quality control of the AniBAL light and heavy form reactants and Alexandre Panchaud for his advice on the AniBAL labeling and TPP use.