
Abstract
Traditionally, antibody-based assays, such as enzyme immunoassay (EIA), enzyme-linked immunosorbent assay (ELISA) and radioimmunoassay (RIA), are the primary tool for the targeted quantification of a specific protein. An antibody-based assay can be run at high-throughput and has extraordinary sensitivity and specificity. In the cases where antibody-based assays exist, the process of validating biomarker candidates can be relatively straightforward. However, the antibody-based approach is limited by the lack of availability of antibodies with high specificity. The development of a high quality antibody-based assays can be costly, time-consuming and a resource-intensive effort. Another disadvantage of antibody-based assays is that they often do not discriminate closely related isoforms. While the antibody development is central to the success of antibody-based platform, mass spectrometry (MS) provides alternative and complementary approach to existing antibody-based assays. The MS-based assays are becoming very popular for quantitative candidates proteins detection in a complex biological mixture.
In the present paper, an in-house developed mass spectrometry (MS)-based assay was compared to a commercially available EIA in reproducibility, measurement accuracy, and dynamic range using rat procollagen type-I N-terminal propeptide (P1NP) as a model.
Keywords
Bone remodeling can be assessed by the measurement of serum bone formation markers; such as aminoterminal propeptide of type I collagen (P1NP). P1NP is a reliable indicator of bone formation activity and has been routinely used for this purpose in clinical trials.1–3 P1NP is proteolytically cleaved from the type I procollagen molecule and released into the blood circulation. The molecular weight of intact P1NP is ~33 kD (heterotrimeric helix- two a1 and one a2 strands). Laboratory monitoring of this biomarker can provide prognostic information about the risk of fracture and may be useful for monitoring efficacy of bone formation and anti-resorptive therapies. It is important to have a specific, sensitive, accurate, and high-throughput method for direct monitoring of P1NP to make diagnostic and therapeutic decisions.
Traditionally, protein biomarkers are detected and quantified using antibody-based assays based on the principle of antibody-antigen interaction. The need to generate compatible antibodies is largely responsible for the high cost and long lead time for developing antibody-based assays. The specificities of the antibodies used in an antibody-based assay are critical for accurately measuring protein concentrations; any cross-reactivity of the antibodies with other proteins will result in overestimating the concentration of the protein. The development of these assays is most often expensive, time-consuming, difficult to multiplex, and usually faces issues with cross reactivity and matrix effects.
Several immunoassays have been developed for measuring the circulating P1NP concentration in serum.
Alternatively, mass spectrometry (MS)-based assay provides a rapid, sensitive, reproducible, and often more specific alternative to existing antibody-based assays. 4 Recently, more emphasis has been placed on developing validated selected-reaction-monitoring (SRM) methods for performing targeted protein quantitation. The key to successfully quantifying the protein expression level is to select peptides that are unique to the targeted protein yet provide enough sensitivity to detect them in a complex biological mixture. The SRM method was specifically developed for quantifying P1NP in rat serum. 5 Using this approach, a unique P1NP-derived tryptic peptide was selected as a stoichiometric representative for the protein of interest. An extended-length synthetic stable isotope-labeled (SIL) peptide ([pyroE]EDIPE VSCIHNGL*RVPNGETWK) with both 15N and 13C labeled on Leu residue (δM = 7 Da) was synthesized and a known amount spiked into each experimental and calibration sample. The SIL peptide underwent all sample preparations and analysis and thus was used to serve as a standard to correct for any variations in endogenous peptide recovery. A non-labeled standard peptide with the same sequence ([pyroE]EDIPEVSCI HNGLRVPNGETWK) was also synthesized and then serially-diluted into a serum matrix to serve as a set of external calibration standards used to generate a standard curve for quantitative measurement of the absolute levels of target protein. This study was carried out to compare MS-based technology with conventional EIA for the measurement of P1NP concentrations across a large number of rat serum samples.
Materials and Methods
Sample preparation procedure for SRM-based assay
An extended-length synthetic stable isotope-labeled (SIL) peptide ([pyroE]EDIPEVSCIHNGL*RVPNGE TWK) with both 15N and 13C labeled on Leu residue (δM = 7 Da) was diluted with ice-cold 100 mM ammonium carbonate, pH 11, to 50 nM and 50 μL of this solution was dispensed into 96-well tall-rim PCR plates in duplicate using a liquid handling system (MultiDrop, Thermo-Fisher Scientific). Then 10 μL of rat serum sample was transferred into 96-well tall-rim PCR plate containing internal standard solution and mixed. After adding 80 μL reduction/alkylation cocktail (97.5% acetonitrile, 2% 2-iodoethanol and 0.5% triethylphosphine), the plate was sealed with heat sealing aluminum foil, mixed and incubated at 37 °C for 1 hr. After incubation, the samples were filtered through Millipore Solvinert filter plates and dried by speed-vacuum (6 hr at 75 °C and overnight at room temperature). Dried samples were dissolved in 100 μL of 100 mM ammonium bicarbonate (pH 8) containing 1 μg of modified trypsin. The plate was sealed with heat sealing aluminum foil and incubated at 37 °C overnight. The samples were filtered through Solvinert filter plates before 50 μL was injected onto LC-MS/MS.
Mass spectrometric analysis
LC-MS/MS was performed using an LTQ ion trap quadrupole mass spectrometer interfaced with Surveyor HPLC system (Thermo-Fisher Scientific). Peptides were separated on C18 reversed-phase column (X-Bridge 2.5 μm particle, 2.1 mm × 50 mm from Waters). Two solvents were use used for HPLC separation: solvent A: formic acid/water (0.1:99.9, v/v) and solvent B: formic acid/acetonitrile (0.1:99.9, v/v). The detailed HPLC conditions and instrument settings used for this assay can be found in Han et al. 6 The instrument was operated in the positive ion mode with single-reaction-monitoring m/z quantifying transitions pairs of (listed here as precursor ion m/z Å fragment ion m/z): 869.6 (M + 2H+) Å 635.6 (M + 2H+), 869.6 (M + 2H+) Å 692.1 (M + 2H+) and 869.6 (M + 2H+) Å 944.5 (M + H+) for unlabeled target peptide and 873.1 (M + 2H+) Å 639.1 (M + 2H+), 873.1 (M + 2H+) Å 695.5 (M + 2H+) and 873.1 (M + 2H+) Å 951.5 (M + H+) for the corresponding stable isotope labeled (SIL) peptide.
For quantitative measurement, the area-under-the-curve (AUC) was calculated for all MS/MS transitions using XCalibur processing method.
The ratio between each SRM transition from the target peptide and the transition from the SIL peptide was calculated for normalization of peptide recovery. 6 The arithmetic average of the normalized transition AUCs was then obtained, representing the normalized AUC of the target peptide. This procedure was carried out for each experimental and calibration sample. The normalized AUC from the calibration samples were fit to a non-linear regression model to generate a standard curve. The normalized AUC from the experimental samples were fit to the standard curve and absolute concentration of P1NP in each sample was interpolated as previously described. 6
EIA procedure
Sera from control and treated rats were analyzed for P1NP concentration using a commercially available rat/mouse P1NP EIA kit (Immunodiagnostic Systems Ltd, Fountain Hills, AZ). During the assay, serum samples were diluted 10-fold in a dilution buffer and 50 μL of the diluted serum, together with 50 μL of the diluted solution containing the secondary antibody, was added to each well coated with polyclonal rabbit anti-P1NP antibody. The plate was incubated at room temperature for 1 hr. After that, solution from each well was removed, and the wells were washed twice with 200 μL of the wash buffer. After washing, 150 μL of an enzyme (horse radish peroxidase) linked to avidin was added and incubated for 30 min at room temperature. After washing, the plates were developed with TMB at room temperature for 30 min. The reaction was stopped by adding 50 μL of HCl (0.5 M) as a stop solution. The absorbance of individual wells was measured at 450 nm using a microplate reader. The standard curve was obtained by plotting the absorbance and the concentration of the protein standards. The EIA analyses were repeated four times for each sample.
Statistical analysis for comparison study
Concentration of P1NP in rat serum samples (first measurement, n = 317) was measured using two independent methods (EIA and LC-MS assay). The P1NP concentrations measured using these two methods could not be directly compared due to a difference in the measuring units (ng/mL for EIA and nM for MS). The units could not be accurately converted since the epitope used to develop the EIA was unknown. Therefore, the P1NP concentration from EIA and MS were plotted as graphical X and Y components, and the correlation between the two is expected to be R 2 = 1 if the two methods are in accordance with one another. A second measurement of a sub-set (second measurement, n = 84) of the original samples was performed using each method. The results of the first measurement were compared with the results of the second measurement in the same manner and correlation coefficient (R 2 ) was calculated between the two measurements. Therefore, the need for a ‘same-unit’ comparison was negated.
Results and Discussion
To independently evaluate the performance of a commercially available EIA for the measurement of P1NP, we compared the P1NP concentrations obtained with this assay with the results from LC-MS assay. P1NP concentrations were measured with the EIA according to the manufacturer's instructions. For comparison, the P1NP concentrations were also measured in parallel with the LC-MS assay described by Han et al. 6
Target peptides of interest and an accurate concentration of isotope labeled peptide standard were identified by tryptic digestion and LC-MS/MS. The MS/MS spectra of the marker and SIL target peptide were inspected to assure the accuracy of the measurements. Figure 1C shows a representative MS/MS spectrum of the SIL peptide spiked into the experimental rat serum samples. For quantification and quality control by SRM, each respective transition was composed of the monoisotopic precursor m/z and a selected monoisotopic production. The three transitions for each target peptide were monitored. The ions chosen for quantification, confirmation, and their transitional partners are shown in Figure 1.
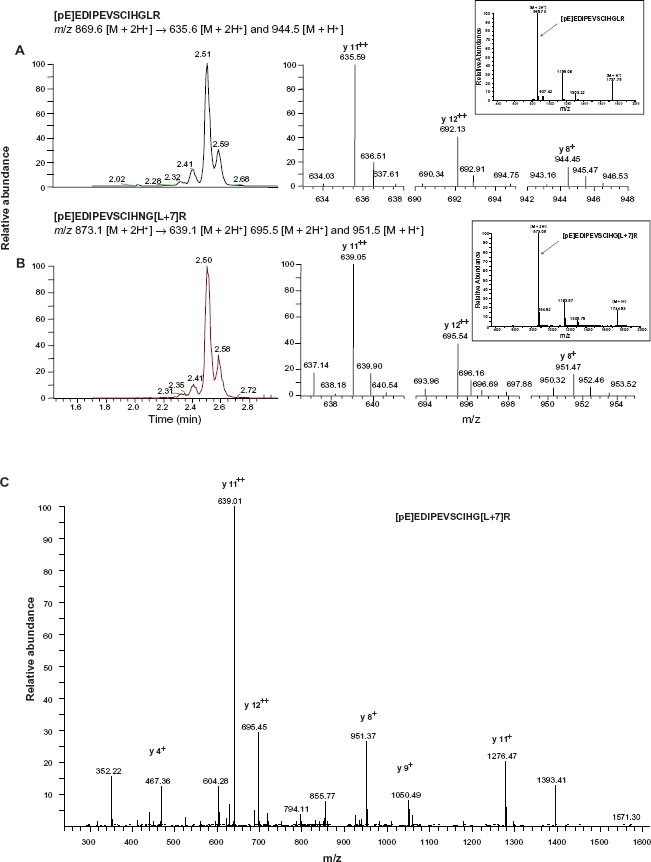
LC-SRM analysis of the marker and SIL peptides. Panels A and B, Left-hand panels of A and B show the extract ion chromatograms of three SRM transition and right-hand panels show the MS/MS fragmentation for marker
The SRM method described by Han et al 6 was specifically developed for quantifying P1NP in rat serum. Therefore, a unique P1NP-derived tryptic peptide was selected as a stoichiometric representative for the protein of interest, following the assay protocol developed by Han et al. 6 An extended-length synthetic peptide ([pyroE]EDIPEVSCIHNGLRVP NGETWK) was synthesized and a known amount spiked into each experimental and calibration sample. The calibration peptide underwent all sample preparations and analysis and thus was used to serve as a direct representation of endogenous P1NP recovery from experimental samples.
Ideally, an intact protein should be used to construct calibration standards to measure the protein of interest and correct for variations in sample preparation, including trypsin digestion efficiency. However, purified rat P1NP protein was not available, so an extended-length synthetic peptide was evaluated and shown to be a valid surrogate for P1NP measurement. 6 Multiple sample preparation schemes were evaluated 6 to enrich P1NP (without using immunobased techniques) and obtain an optimal recovery of endogenous P1NP from serum and calibration samples. The use of animal serum background matrix (horse or goat) for calibration samples was also evaluated. Detailed MS assay validation data, including inter- and intra-assay variability, sample stability at different storage conditions, and the reference range of P1NP in experimental serum samples were published previously. 6 The validation criteria for assay precision was 1batch CV ≤ 20%, assay accuracy was relative error ≤20%, and total error ≤30% (inter-batch % CV + % relative error).
The same set of samples was also analyzed using an existing EIA kit.
The results obtained from MS-based assay and EIA are compared in Figure 2. The dynamic range of the EIA used in this study was significantly narrower than that SRM-based assay. The calibration linear range for EIA is from 0.9 to 75 ng/mL P1NP, and is 1.6 to 400 nM for the SRM-based assay.
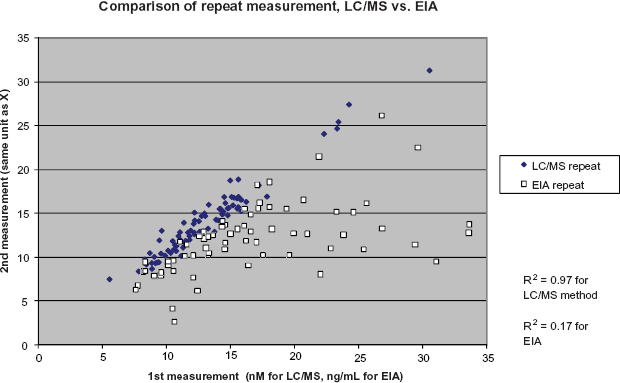
Performance comparison of EIA and LC/MS assay experiments for the quantification of P1NP in rat serum samples.
From this comparative study we conclude that SRM-based method is more reproducible than the EIA, especially at lower concentrations of P1NP. The LC-SRM-based assay contains an internal standard to maintain consistency from assay to assay. The EIA does not contain this type of internal control and therefore the reproducibility relies more heavily on the operator's day-to-day consistency. The LC-SRM-based assay is high-throughput and highly applicable for the quantification of P1NP in large numbers of plasma samples. This assay can be successfully used to establish the diagnosis and progression of osteoporosis, effectiveness of osteoporosis treatments, and can provide valuable information in other types of bone disorders. This method can be executed in any clinical laboratory and in time may replace the current immunoassays.
Disclosure
The authors report no conflicts of interest.