
Abstract
Lipopolysaccharides (LPS) are cell wall components of Gram-negative bacteria that produce inflammation and sickness in higher animals. The objective was to identify plasma proteomic changes in an avian model of inflammation. Chickens were treated with either saline or LPS, and blood was collected at 24 hours postinjection. The pooled plasma samples were depleted of high-abundant proteins and analyzed by matrix-assisted laser desorption ionization (MALDI)-time-of-flight mass spectrometry and liquid chromatography–tandem mass spectrometry (LC–MS/MS). MALDI analyses showed an increase in fibrinogen beta-derived peptide and a decrease in apolipoprotein-AII-derived peptide in LPS samples. Label-free quantitation of LC–MS/MS spectra revealed an increase in the levels of α1-acid glycoprotein, a chemokine CCLI10, and cathelicidin-2, but a decrease in an interferonstimulated gene-12-2 protein in the LPS group. These differentially expressed proteins are associated with immunomodulation, cytokine changes, and defense mechanisms, which may be useful as candidate biomarkers of infection and inflammation.
Introduction
Lipopolysaccharides (LPS) are cell wall components of Gram-negative bacteria, the endotoxins, which induce sickness and inflammation and elicit acute-phase response in higher animals. 1 The host–endotoxin interaction leads to immune activation, produces cytokines, and alters plasma protein pro-files and metabolism.2,3 An inflammatory challenge can elicit cellular and humoral responses. Primary cells and transformed cell lines provide information about the differential regulation of corpuscular immunity,4,5 but the changes in the plasma proteome of model animals, such as mice and chicken, help understand the humoral responses and serve as biomarkers.6,7 Chickens are one of the important avian biomedical models that have provided important anatomical, physiological, and molecular insights for immunology.8,9 Despite the historical usage in comparative biology and veterinary pathology, avian humoral responses are seldom explored by mass spectrometry.10–16 Therefore, the objective of this study was to analyze the changes in plasma peptide and proteins using the chicken model of inflammation induced by LPS. Owing to a few high-abundant proteins in plasma that can mask the low-abundant proteins and peptides,17,18 we chemically depleted the high-abundant proteins in plasma prior to analysis using matrix-assisted laser desorption ionization-time-of-flight mass spectrometry (MALDI-TOF-MS) and liquid chromatography–tandem mass spectrometry (LC–MS/MS). Our analyses and label-free quantitation reveal several proteins relevant to innate immunity, which may be useful as candidate biomarkers.
Methods
Chickens, Treatment, and Blood Collection
All animal procedures were approved and carried out in accordance with the University of Arkansas, Institutional Animal Care and Use Committee (IACUC) guidelines. Cobb 500 broiler chickens were raised on floor pens from the day of hatch at a density of 8 ft 2 per bird and provided diets formulated as per the National Research Council specifications 19 along with ad libitum water. At five weeks of age, 18 birds were randomly divided into two groups receiving either 1 mg/kg body weight (BW) of Salmonella typhimurium LPS (Cat #L6143; Sigma-Aldrich) dissolved in saline or an equivalent volume of saline (control) by intramuscular injection in the thigh. The behavioral changes were monitored up to six hours postinjection and prior to killing at 24 hours. The chickens were individually weighed and bled by cardiac puncture, and the blood samples were collected in K2-EDTA-containing Vacutainer tubes (BD Biosciences) and euthanized. The plasma samples from the saline- and LPS-injected chickens were classified as control and LPS, respectively.
Plasma Preparation and High-abundant Protein Depletion
Plasma was separated from the blood samples by centrifugation at 2,000 x g for 10 minutes at 4°C and stored at –-20°C until further analyses. Three pooled samples in each group were prepared by combining equal volumes of plasma from three birds each, centrifuged at 21,000 x g for 10 minutes at 4°C, to remove insoluble precipitates. Samples were then mixed with acetonitrile (ACN) containing 0.1% formic acid (FA) to a final concentration of 60% ACN, sonicated for 10 minutes in an ultrasonic water bath, and kept at –-20°C for 24 hours to deplete high-abundant proteins by precipitation. 20 , 21 The supernatant containing high-abundant protein depleted (HAPD) plasma, obtained by centrifugation, was dried in a CentriVap vaccum concentrator (Labconco), and redissolved in the starting volume with 50 mM ammonium bicarbonate (AMBIC). The protein concentrations of the solutions were then estimated by BCA protein method (Pierce) and adjusted to a concentration of 1 μg/μL with 50 mM AMBIC for subsequent analyses.
Peptide Analysis by MALDI-TOF-MS
Respective control and LPS samples (75 μL per sample, n=3) were concentrated and desalted using C18 tips (NT1C18; Glygen) as per the manufacturer's protocol, except that the binding and washing steps were repeated five times before elution. 13 The samples were eluted and spotted on a MALDI 384 target plate, dried, and overlaid with an equal volume of sinapinic acid (10 mg/mL in 0.1% FA in 30% of ACN). The spots were analyzed using an Ultraflex II MALDI-TOF/TOF instrument (Bruker Daltonics) in a positive ion linear mode. The instrument was calibrated using a 5–17.5 kDa protein standard (Bruker Daltonics), and the MS data for peptides in the range of 1–10 kDa were collected in an automated mode using the Bruker Flex control software with a constant laser power and 800 laser shots per spot.
Clinprotools Analysis
The MS spectra of both control and LPS samples were compared using the ClinProTools (CPT) Software™ (version 2.2; Bruker Daltonics). 22 A quick classifier algorithm was used to detect automatic peak, integration of peaks exhibiting a signal-to-noise ratio ≥10, and a threshold intensity of at least 5% relative to the largest peak. 23 Anderson–Darling's test was used to establish the data distribution, and the statistical differences were calculated using both t-test and Wilcoxon test. Values with P ≤ 0.05 were considered statistically significant.
Reverse-phase LC-ESI Mass Spectrometer
To purify peptides shown as differentially expressed by CPT, equal volumes of HAPD samples were dried and reconstituted in 0.1% FA for reverse-phase high-performance liquid chromatography (RP-HPLC) using a Supelco C18 column (15 cm x 4.6 mm, 5 μm particle size, and 300 Å pore size; Sigma-Aldrich) attached to a Hewlett 110 HPLC system. The HPLC was coupled online to a quadrupole ion trap ESI mass spectrometer (ESI-MS; Bruker Esquire 2000; Bruker Daltonics) operated in a positive ion mode with a dry gas temperature of 300°C, a flow rate of 12 mL/min, and a nebulizing N2 pressure of 2.1 x 10⁵ Pa (30 psi). The mass spectrometer was optimized at m/z 1,000 with low skimmer voltage to avoid ion fragmentation and charge stripping. Individual fractions were separated at a solvent flow rate of 0.7 mL/min with 0%–100% gradient of 0.1% FA (solvent A) and ACN (solvent B) over a 150 minutes period. The HPLC fractions with ESI-MS multiple charge ion distribution, matching to the masses of the differentially expressed peptides, were collected and verified for purity by MALDI-TOF-MS. Relevant fractions collected from several runs were pooled, dried, and reconstituted in 50 mM AMBIC prior to further processing and identification.
Maldi Peptide Mass Fingerprinting
The peptide fractions were reduced with 10 mM dithiothreitol (DTT) for one hour at 60°C and alkylated with 40 mM iodoacetamide (IAA) (MP Biomedicals). Excess IAA was neutralized with DTT, and the samples were digested with trypsin (Promega) at 37°C for 24 hours. The tryptic digests were desalted using C18 tips (NT1C18; Glygen), and the eluted peptides were mixed with an equal volume of α-cyano-4-hydroxycinnamic acid matrix (10 mg/mL in 0.1% FA in 50% of ACN) and spotted on MALDI 384 target plate for peptide mass fingerprinting (PMF) analysis. The instrument was calibrated using standard peptide calibrators spotted adjacently. Mass spectra were obtained in reflector positive ion mode using an Ultraflex II MALDI-TOF/TOF mass spectrometer (Bruker Daltonics). The MALDI PMF was subjected to tandem MS/MS using MALDI LIFT-TOF/TOF (Bruker Daltonics). Bruker Biotools 3.1 was used to combine PMF and LIFT-MS/MS data to search the database. MASCOT 2.1 (Matrix Science) was used to identify peptides in the NCBI Gallus gallus protein database with the following parameters: single miscleavage, fixed carbamidomethylation of cysteine, variable methionine oxidation with parent ion mass tolerance, and fragment ion mass tolerance of 0.6 Da. Peptides with fragmentation ion score of 10 or higher were considered for protein identification. Tag search option and BLAST-P were used when the routine MASCOT-PMF analyses could not identify the peptide.
LC–MS/MS
Control and LPS-treated chicken HAPD samples (n = 3, 100 μg) were reduced and alkylated as described earlier and digested with 2 μg of trypsin for 48 hours at 37°C. The digests were centrifuged at 21,000 x g for 10 minutes and desalted using C18 spin columns (Pierce) as per the manufacturer's protocol. The eluted peptides were dried, resuspended in 0.1% FA, and subjected to LC–MS/MS using an Agilent 1200 series capillary C18-RP-HPLC coupled to a Bruker Amazon-SL quadrupole ion trap mass spectrometer capable of performing data-dependent acquisition. The tryptic peptides were separated by RP-HPLC using a Zorbax SB C18 column (150 mm x 0.3 mm, 3.5 μm particle size, and 300 Å pore size; Agilent Technologies), with a solvent flow rate of 6 μL/min and a gradient of 0%–40% consisting of 0.1% FA (solvent A) and ACN (solvent B) for 300 minutes.
Data Analysis
The LC–MS/MS spectra were exported from DataAnalysis version 4.0 SP4 (Bruker Daltonics) in *.mzXML format and searched for proteins in global proteome machine (http://h.thegpm.org/tandem/thegpm_tandem.html). 24 We used the Gallus gallus protein database to search for the proteins using the following parameters, fragment mass error of 0.6 Da with fixed carbamidomethylation, and variable methionine oxidation. Protein identifications were considered as true based on at least one unique peptide per protein and a false-positive rate of ≤5%. The results were downloaded as *.xml files for Skyline version 3.1 software quantitation and as Excel (*.xls) files for qualitative analyses.
Qualitative Analysis
The common proteins present in all three samples from each group were selected using an online comparison program (www.xlcomparator.net). The identified list of proteins from control and LPS groups were converted to Ensembl Gene ID using the Biomart online software. 25 The genes were analyzed for the enrichment of annotation terms using the Database for Annotation, Visualization, and Integrated Discovery (DAVID) program with an EASE score set at 0.1 (www.david.abcc.ncifcrf.gov). 26 The clusters enriched only in the LPS group but not in the control group or vice versa were considered to be differentially expressed. In case where gene ontology (GO) annotations for protein/gene IDs were not available in DAVID or Uniprot, the sequence was subjected to BLAST search to obtain relevant matching protein annotations.
Label-free Quantitation of Peptides
The mass spectra (*.mzXML) and the identification (*.xml) files of both control and LPS groups were used for label-free quantification using the Skyline software (http://proteome.gs.washington.edu/software/skyline). 27 The group comparison function of “MSstats” was used to quantitate differentially expressed proteins and generate Volcano plot. 28
Clinical Chemistry
Albumin (ALB), iron, cholesterol (CH), triglycerides (TG), and the high-density lipoprotein (HDL) concentrations of individual plasma samples were determined using an Express plus automated clinical chemistry analyzer (Ciba-Corning Diagnostics Corp.). Low-density lipoprotein (LDL) concentrations were calculated using the following formula: LDL = TC – HDL – TG/5.0 (mg/dL). 29
Statistics
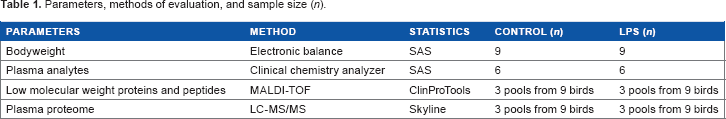
The effect of LPS on BW and the clinical chemistry parameters were analyzed by SAS (SAS Institute Inc.) with one-way analysis of variance and Duncan's t-test. A P-value of ≤0.05 was considered statistically significant. The MALDI and LC–MS/MS data were analyzed using the built-in software CPT and Skyline, respectively (Table 1).
Parameters, methods of evaluation, and sample size (n).
Results
Effect of LPS on Morphological Parameters
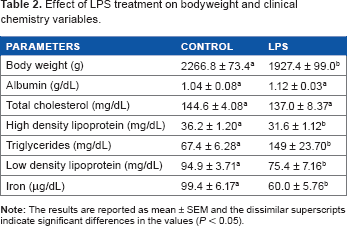
The LPS caused infirmity, eyelid closure, and avoidance of food and water in the treated chickens at three hours after treatment. However, these symptoms were not evident at 24 hours, and chickens from both the control and LPS groups appeared equally alert but with significantly different BW (Table 2).
Effect of LPS treatment on bodyweight and clinical chemistry variables.
Peptide Analysis
Of 68 differentially expressed peptides, based on the MALDI-TOF-MS data (Supplementary Table 1), we purified two peptides corresponding to m/z 4,707 and 8,108 (Figs. 1 and 2) and identified them as fragments derived from a fibrinogen beta (FIBB) precursor and apolipoprotein-AII (APO-AII), respectively. FIBB was identified using a de novo tag of (YDNEEDS) with m/z 2,408, derived from MS/MS and a BLAST-P search. Sequence characterization of the rest of the peptides was not possible due to low purification and concentration.
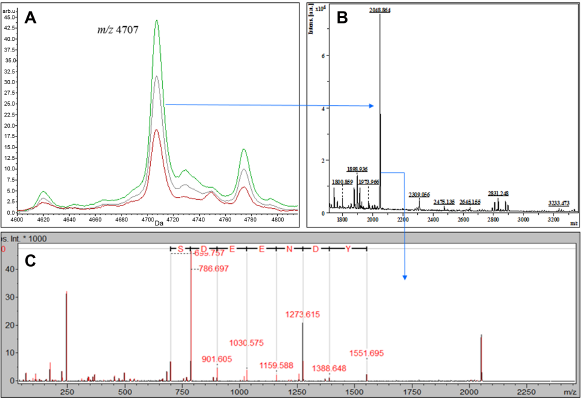
Identification of differentially expressed peak m/z 4,707 as fibrinogen beta (FIBB) chain fragment. (A) MALDI-TOF spectra from control (red), LPS samples (green), and the total average spectra (gray) showing the elevation in m/z 4,707; (B) PMF of purified 4,707 Da peptide; and (C) tandem mass spectra (MS/MS) of the 2,048 Da fragment with the sequence SDEENDY used for the BLAST-P and identified as FIBB peptide.
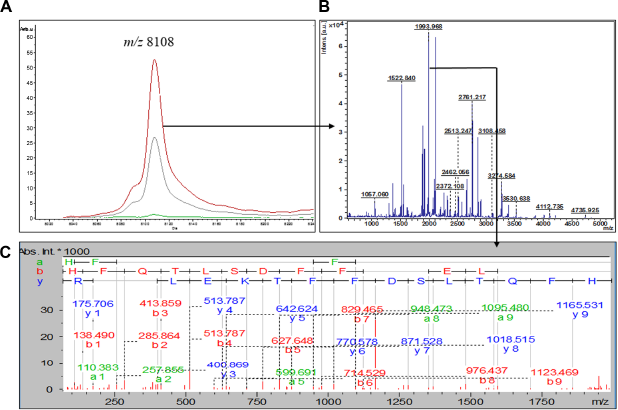
Characterization of differentially expressed m/z 8,108 peptide as apolipoprotein-AII (APO-AII). (A) MALDI-TOF spectra from control (red), LPS samples (green), and the total average spectra (gray) showing the reduction in m/z 8,108; (B) PMF of the purified 8,108 Da peptide; and (C) tandem mass spectrometry (MS/MS) of one of the peptides 1,993 Da from the tryptic digest used to identify the peptide as HFQTLSDFFTKELPQR.
Plasma proteome
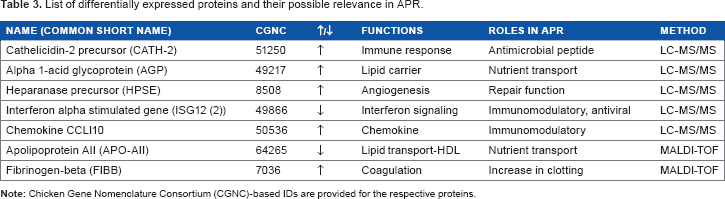
Proteins identified in HAPD plasma of control and LPS groups are given in Supplementary Tables 2–7 (Fig. 3). The mass spectrometry proteomics data were deposited to the ProteomeXchange Consortium 30 via the PRIDE partner repository with the dataset identifier PXD003335 and 10.6019/PXD003335. 30 A qualitative comparison of common proteins in both groups showed a chemokine CCLI10 and α1-acid glycoprotein (AGP) present only in the LPS samples. A label-free quantitation of 48 proteins (97 peptides) showed elevations in the levels of AGP, cathelicidin-2 (CATH-2) precursor, and a heparanase (HPSE) precursor protein and the reduction in an interferon-alpha-stimulated gene 12-2 (ISG12-2) protein in LPS samples (Table 3, Fig. 4 and Supplementary Table 8).
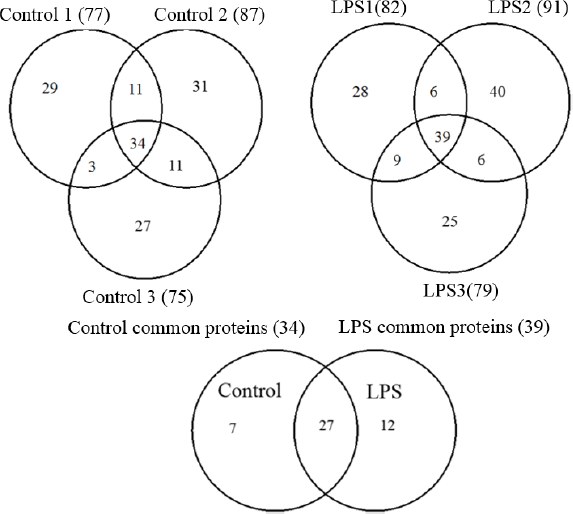
Venn diagrams showing the number of common and unique proteins in control and LPS samples. The three circles (top left) represent the three pools of control, and the three circles (top right) represent the three pools of LPS samples. The two circles (at the bottom center) represent the common proteins in control group compared to the common proteins in LPS group.
List of differentially expressed proteins and their possible relevance in APR.
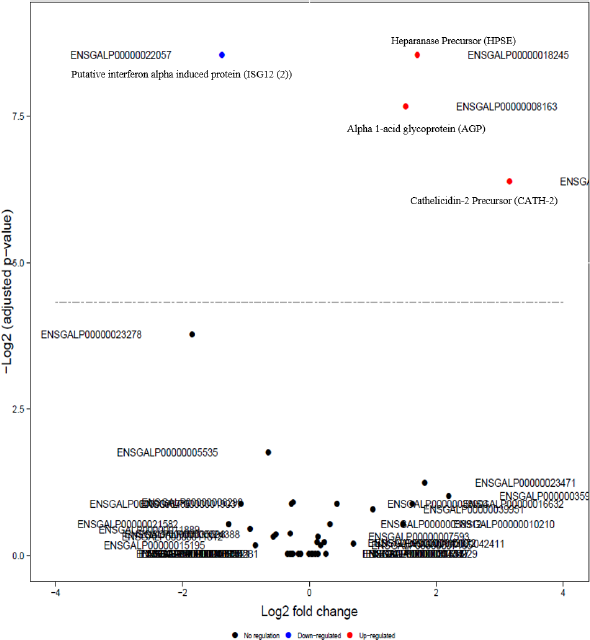
Volcano plot shows differentially expressed proteins in LPS group with respect to control group based on the Skyline-MSstats analysis. Names of the proteins were manually added adjacent to the ensemble ENSGALP ID.
DAVID Enrichment and Clustering
DAVID analysis showed an enrichment of several clusters in both the control and LPS groups (Supplementary Tables 9 and 10). The enrichment output tables in both groups contained clusters enriched with extracellular matrix, such as collagen, fibronectin, and antimicrobial proteins. The control group, however, was enriched with a cluster of lipid-binding proteins, whereas the LPS samples were enriched with oxygen-binding and protein kinase activity-containing proteins. These differences in enrichment were considered as representations of plasma protein responses to the inflammatory challenge.
Clinical Chemistry
The ALB levels remained unchanged, while the iron levels were reduced in the LPS-treated chicken plasma (Table 2). There were no differences in the total CH levels, whereas the HDL and LDL levels were reduced in the LPS group.
Discussion
In higher animals, certain remarkable changes that occur during an infection are sickness behavior, lack of appetite, and eventual weight loss. Such effects were evident in LPS-treated chickens indicated by the loss of their BW, which is consistent with our previous observations. 31 The decreased plasma iron levels as observed here have been a marker of infection in humans and other animals.32,33 Apart from these well-documented changes in vertebrates, this is the first study to explore the effect of LPS in chicken plasma using a shotgun proteomic platform.
The peptide analysis showed an increase in FIBB peptides and a decrease in APO-AII peptides in the LPS-treated chickens. The FIBB peptides are generated during blood coagulation, which increases under inflammation. These peptides are known to be immunomodulatory. 34 The APO-AII is presumably a CH transport protein, which is a part of HDL. 35 The decrease in the plasma levels of APO-AII may relate to a low plasma HDL as a consequence of hypophagia during inflammation. Low plasma lipoprotein levels have been reported in several human and mammalian studies.36,37
A qualitative comparison of proteins identified by LC–MS/MS showed that the proteins, such as AGP and chemokine CCLI10, were present only in the LPS-treated birds and not in the controls. The AGP, also known as orosomucoid-1, serves as a transport protein and increases in plasma during inflammation.38–40 The CCLI10 was predicted as a disease-resistant gene in chickens and later shown to be differentially expressed in the spleen transcriptome of Salmonella enteritidis-infected birds.41,42 However, this is the first study to show the proteomic level changes in CCLI10 in chickens. Whether the elevation in CCLI10 is related to inflammation in general or specific to Salmonella endotoxin challenge is not clear because we used the LPS from S. typhimurium in this study.
Label-free quantitation of proteome by Skyline showed differential expression of four proteins, such as CATH-2, HPSE, ISG12-2, and AGP. CATH-2, is an antimicrobial peptide and also known to be immunomodulatory.43–45 Thus, the elevation of CATH-2 in the LPS group appears to be consistent with the physiological responses during infection. Similarly, the elevation of HPSE in LPS group can be related to the degradation of heparan sulfate involved with extracellular matrix remodeling during inflammation. 46 The ISG12-2 is not a functionally characterized protein in chickens but annotated as a putative protein in Gallus database. 47 The murine ISG12, however, is an antiviral and a proinflammatory protein with the ISG12-knockout mice showing an increased survival during sepsis, implicating its role in lowering of inflammatory stimulus.48,49 This is the first report in chickens showing the decreased levels of ISG12-2 during inflammation, but its relevance to tolerance and immunity needs to be understood.
In addition to qualitative and quantitative changes, the GO enrichment showed a cluster of proteins with lipid-binding activities in the control group, whereas the LPS group had clusters associated with phosphorous metabolism and oxygen transport. The absence of lipid-binding cluster in LPS group may be related to the decreased levels of both HDL and LDL, whereas the GO terms associated with kinases or phosphorylases can be due to the increased signal transduction mechanisms. 50 The cluster with oxygen transport proteins is likely associated with free hemoglobin from red blood cell lysis.51,52
Comparative studies in avian and other models of humoral responses to pathogens, such as to Escherichia coli,53,54 highlight some commonalities with our current study. For example, fibrinogen was reported to be differentially expressed in chickens with infection. 55 Similarly, the differential regulation of some apolipoproteins were reported both in chickens 11 and in other mammalian models of inflammation.36,37 CATH gene expression was induced by LPS in porcine models, 56 and its levels in serum were elevated during inflammation 57 in humans. Hence, these candidate protein makers appear to have considerable similarities, which may be useful across phyla in broad categories of inflammation.
In summary, the label-free quantitation showed the plasma levels of FIBB, APO-AII, AGP, CATH-2, HPSE, and ISG12-2 were significantly altered in LPS-treated chickens. FIBB and AGP are better known acute-phase proteins in chicken, but the proteins CCLI10, ISG12-2, and HPSE are known owing to the sample preparation workflow and mass spectrometry. Although methods such as ELISA and Western blotting are used to verify the changes in proteins, such chicken protein-reactive antibodies are not available. Hence, we are developing selected reaction monitoring method that can validate these changes in future and to better understand the avian immune response.
Conclusion
The S. typhimurium LPS produces sickness in the chickens, which is reflected by BW loss, clinical chemistry, and plasma protein changes. We identified the changes in the plasma levels of FIBB, APO-AII, AGP, CCLI10, CATH-2, HPSE, and ISG12-2 proteins. The identification and characterization of novel plasma proteins using mass spectrometry is a potential method to study proteins involved in innate immunity, which can be exploited to identify and evaluate biomarkers of inflammation and disease in chickens.
Disclaimer
Mention of a trade name, proprietary product, or specific equipment does not constitute a guarantee or warranty by the USDA and does not imply its approval to the exclusion of other products that may be suitable. USDA is an equal opportunity provider and employer.
Author Contributions
Performed the animal and plasma preparation experiments and analyses and wrote the article: BP. Performed the mass spectrometry and shotgun proteomic analyses and wrote the article: RL. Wrote the article and helped in the interpretation of proteomic results: JOL. Designed and performed the animal studies: SM. Oversaw all the experiments and wrote the article: NCR. All authors reviewed and approved of the final manuscript.
Supplementary Materials
Footnotes
Acknowledgments
The authors thank Scott Zornes, Sonia Tsai, and Wally McDonner for assistance.