
Abstract
Background/Aims
We have previously isolated a novel lysosomal cysteine protease, cathepsin Y, which produces a kinin-potenciating octapeptide from rat plasma. The present study aimed to elucidate the influence of protein-restriction on cathepsin Y mRNA expression in tissues of growing rat.
Methods
Weaning rats were fed either 20% casein (normal-protein, NP) or 5% casein (low-protein, LP) diet for 12 weeks, from post-weaning period to maturity. Cathepsin Y mRNA expression in tissues was examined using RT-PCR and compared with that of cathepsin L, a general marker of muscle atrophy.
Results
Body, liver and spleen weights and diet intake of LP were significantly lower than those of NP. Cathepsin Y expression in LP was increased in liver (3.70 fold vs. NP) and spleen (1.28 fold) at early periods of protein-restriction, whereas that of cathepsin L was increased in liver and pectoral muscle through all intake periods. However, significant differences were detected in neither cathepsin Y expression in pectoral muscle nor cathepsin L expression in spleen throughout intake periods.
Conclusions
A significant up-regulation of cathepsin Y was observed in spleen and liver, suggesting that it may associate with immunodepression in rats under protein-malnutrition during the early post-weaning period.
Introduction
The lysosomal system is mainly involved in the degradation of intracellular proteins under hypercatabolic state, such as fasting, injury and sepsis, and the cathepsins are the major lysosomal proteases.1–3 At present,11 human cathepsins (B, H, L, S, C, K, O, F, X and W) are known at sequential level.4,5 Recently cathepsins are believed to be involved in a variety of specific cellular functions much broader than as nonspecific protein degradation and turnover within the lysosomal system.4,5
While researching acid kininogenases in the rat spleen, we isolated a novel 37-kDa lysosomal cysteine protease and named it cathepsin Y.6–8 Cathepsin Y produces a kinin-potentiating octapeptide from rat plasma, suggesting that it may be involved in inflammation. 7 A full-length cathepsin Y cDNA was cloned from a rat spleen cDNA library, which encodes 306 amino acids including 243 amino acids of a mature protein.7,9 In addition to spleen, cathepsin Y mRNA is also expressed in liver, thymus, kidney and lung, 7 and macrophages isolated from rat spleen and thymus is found to express cathepsin Y. 7 A homology search revealed that rat cathepsin Y was highly homologous with human cathepsin X 10 at both the amino acid and nucleotide sequence levels. Rat cathepsin Y, like human cathepsin X, has a very short pro-region and three peptide insertions near the active cysteine site called the “mini-loop,” which is responsible for peptidase activity of the enzyme. 10 However, the integrin binding motif, Arg-Gly-Asp, found in the pro-region of human cathepsin X 10 is missing in rat cathepsin Y. 9 Rat cathepsin Y is an endopeptidase.7,8 whereas human cathepsin X has carboxymonopeptidase activity.11,12
Epidemiological studies have identified that malnutrition during pregnancy and early life presents a risk factor for the onset of both perinatal and later-life diseases, such as diabetes, hypertension and obesity.13,14 Malnutrition induced by feeding rats a low-protein diet after weaning has been reported to cause impaired insulin secretion and significant changes in the gene expression pattern in islets, including reduced expression of cathepsin L.15,16 Under starvation, the protein expressions of cathepsins L is significantly up-regulated in liver of adult rats. 17 The cathepsin L mRNA was markedly increased in skeletal muscle of fasting adult rats18,19 and also in other models of muscle protein degradation, such as sepsis, tumor-bearing and dexamethasone treatment, and thus cathepsin L being recognized as a general marker of muscle atrophy. 20
In order to know the role of cathepsin Y in protein-malnutrition during growth period, from post-weaning period to maturity, we estimated the mRNA expression of cathepsin Y in liver, skeletal muscle and spleen of rats growing under a protein deficient diet and a normal diet and compared it with the cathepsin L mRNA expression.
Materials and Methods
Animals and diet
Twenty-four male Wistar rats (3-week old, body weight 47.3 ± 2.8 g) were purchased from Kyudo Company (Saga, Japan). They were maintained at 22 °C ± 2 °C under a 12-h light:dark cycle and had free access to food and water. They were randomly divided into two groups (n = 12 per group) and fed either a 20% casein (normal-protein, NP) or 5% casein (low-protein, LP) diet. The NP diet was based on the AIN-93G formulation, 21 and the LP diet was isoenergetic, differing only in protein content (Table 1). Their body weight and diet intake were measured every week and every three days, respectively. At the ages of 7-week (infant), 11-week (puberty) and 15-week (adulthood) and in each group were sacrificed. The liver, spleen and part of the pectoral muscle were quickly taken out under ether anesthesia and immediately washed with phosphate-buffered saline (10 mM KH2PO4, 10 mM K2HPO4 containing 154 mM NaCl, pH 7.4). They were stored at −20 °C in 5 mL RNAlater (TaKaRa, Shiga, Japan) until analysis. All our experiments were approved by the Committee for Ethics in Animal Experiments at Nakamura Gakuen University.
Composition of the normal and low-protein diets.
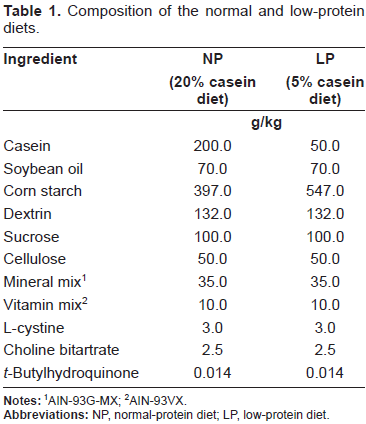
AIN-93G-MX;
AIN-93VX.
RNA extraction
Total RNA was extracted with either an RNeasy Mini Kit (liver and spleen; QIAGEN, Chatworth, CA) or an RNeasy Midi Kit (pectoral muscle; QIAGEN), followed by treatment with RNase-Free DNase I (QIAGEN).
mRNA expression of cathepsin Y and L using reverse transcription-polymerase chain reaction (RT-PCR)
Reverse transcription was performed with 1 µg total RNA, using Superscript II RNase H– reverse transcriptase and 0.5 µg oligo (dT)12-18 primer, according to the manufacturer's instructions (Invitrogen Corp., Carlsbad, CA). The obtained cDNA was stored at −20 °C. The PCR was then performed in a 50-µL reaction column containing 1.0 µL cDNA, 2 mM MgCl2, 0.2 mM each dNTP (dATP, dCTP, dTTP, dGTP), 0.2 µM forward and reverse primers and 1.25 U of TaKaRa Ex Taq polymerase (TaKaRa), using a MiniCycler (MJ Research, Miami, FL). The specific primers were directed against the following rat sequences: cathepsin Y, forward 5‘-GGACCTGCAAT-GAATTCAAAG-3’, reverse 5‘-TCAGACAAT-GGGGTCCCAA-3’; cathepsin L, forward 5‘-ACGACACAGGGTTTGTGGAT-3’, reverse 5‘-CAGAGACGGGTTTGGTCAGT-3’; glyceraldehydes-3-phosphate dehydrogenase (GAPDH), forward 5‘-TGCCACTCAGAAGACT-GTGG-3’, reverse 5‘-AGGAGACAACCTG-GTCCTCA-3’; 18S ribosomal RNA, forward 5‘-CGGCTACCACATCCAAGGAA-3’, reverse 5‘- GCTGGAATTACCGCGGCT-3’. The PCR conditions for tissue distribution of cathepsin Y and L mRNA were as follows: after an initial incubation at 94 °C for 2 min, around 20 cycles of 30 sec at 94 °C, 30 sec at 60 °C, and 1 min at 72 °C. The PCR products (5 µL) were separated on 5% polyacrylamide gels, stained with Vistra Green (Amersham Biosciences Corp., Piscataway, NJ) for 20 min, and then the intensities of the bands were measured using a Luminescent Image Analyzer LAS-3000 (FUJIFILM, Tokyo, Japan). The bands were quantitated by Multi gauge Ver. 2.0 Software (FUJIFILM). The results are presented as the ratio of the target to internal control signals, GAPDH and 18S rRNA. To perform semi-quantitive RT-PCR, the number of amplification cycles was selected to allow linear amplification of the cDNA. 22 The liver cDNA samples were amplified for 23 cycles (cathepsin Y) and 18 cycles (cathepsin L and GAPDH); pectoral muscle cDNA samples for 23 cycles (cathepsin Y), 20 cycles (cathepsin L) and 15 cycles (GAPDH); and spleen cDNA samples for 18 cycles (cathepsin Y and GAPDH) and 21 cycles (cathepsin L). All the 18S rRNA samples were amplified for 10 cycles.
Statistical analysis
The values are means ± SD. The Student's t-test was used to compare NP and LP groups. The level of significance was set at P < 0.05.
Results
Diet intake
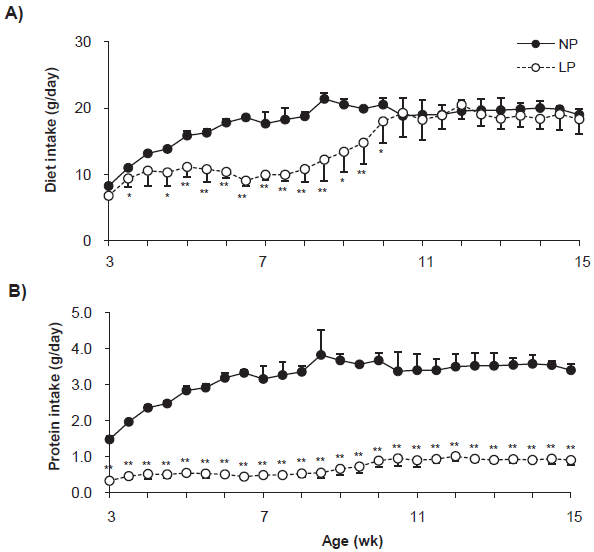
The weaning rats were fed with the NP and LP diets until the day of sacrifice (Fig. 1). Diet intake increased in the NP group with growth until 8-week and then maintained a constant intake level (Fig. 1A). Diet intake in the LP group was significantly low until 7-week, gradually resumed thereafter, and reached the same level as that in the NP group at 11-week. Protein intake in the NP group increased in parallel with diet intake until 8-week, however, that in the LP group was significantly low through all intake periods (Fig. 1B).
Change in the quantity of diet intake
The NP group showed increased body weight with age (Fig. 2). The body weight of the LP group had hardly increased by 7-week (42.4% ± 4.1% vs. NP group); however, it gradually increased after 8-week, but still could not reach the same level as the NP group until 15-week (58.8% ± 7.5% and 66.2% ± 7.8% vs. NP at 11 and 15-week, respectively).

Change in the body weight during intake periods. Results are shown for the same rats as those in Figure 1. The body weight was measured every week and expressed as mean ± SD.
The rat tissue weight at the time of sacrifice,7,11 and 15-week, is shown in Table 2. The liver weight of the LP group at 7-week decreased to 50.6% ± 7.2% in comparison with the NP group, but gradually recovered to 68.9% ± 11.9% and 77.1% ± 11.8% at 11 and 15-week, respectively. Increased liver fat contents were observed in the LP group at 7-week, but not at 11 or 15-week. The decrease of spleen weight in the LP group was remarkably significant than that of liver, being 40.1% ± 14.9%, 58.4% ± 11.5% and 50.5% ± 6.7%, at 7, 11 and 15-week respectively. The pectoral muscle was not weighed because we only removed part of it.
Effects of low protein diet on liver and spleen weight.

Values are mean ± SD, n = 4. The values in parenthesis are the vehicle weights of the LP group taking those of the NP group as 100%.
p < 0.05;
p < 0.01 versus NP.
Tissue expression of cathepsin Y and L mRNA
In order to determine the differences in the mRNA levels of cathepsins Y and L among tissues, we performed RT-PCR with the same amplification cycle (20 cycles) on the tissues from the NP group at 7-week (Fig. 3). The cathepsin Y mRNA level was high in spleen and liver and low in pectoral muscle. In contrast, cathepsin L mRNA expression was found to be high in both liver and pectoral muscle compared with that in spleen.

Cathepsins Y and L mRNA expression in the liver, pectoral muscle and spleen of the NP group. The PCR products were amplified for 20 cycles with cDNA from the NP group at 7-week. The sizes of PCR products of cathepsin Y and cathepsin L were 405 bp and 419 bp, respectively.
Changes in mRNA expression of cathepsins Y and L during intake periods
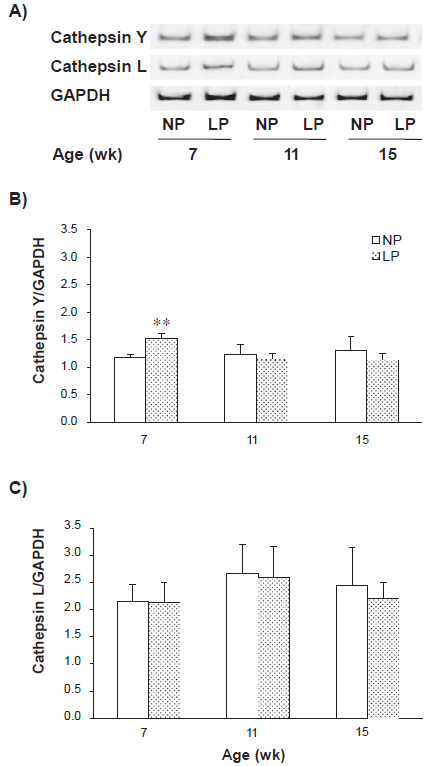
Cathepsin Y and L mRNA expression levels in liver, pectoral muscle and spleen during intake periods were measured using semi-quantitative RT-PCR (Figs. 4–6). The cathepsin Y mRNA level in the liver from the LP group remarkably increased to 3.70 ± 0.77 fold at 7-week in comparison with the NP group (cathepsin Y/GAPDH: 2.17 ± 0.45 for the LP group vs. 0.59 ± 0.06 for the NP group), then the degree of increase gradually diminished to 2.48 ± 0.19 fold (1.80 ± 0.14 vs. 0.73 ± 0.18) and 1.54 ± 0.07 fold (1.20 ± 0.09 vs. 0.78 ± 0.10) at 11 and 15-week, respectively (Fig. 4B). The expression of cathepsin L mRNA in the liver from the LP group was also significantly increased through all intake periods, 1.67 ± 0.23 fold, 1.54 ± 0.17 fold and 1.84 ± 0.07 fold at 7, 11 and 15-week, respectively (Fig. 4). In the pectoral muscle, the cathepsin Y mRNA level in the LP group remained unchanged in comparison with the NP group through all intake periods (Fig. 5B). However, the cathepsin L mRNA levels in the LP group were significantly up-regulated 1.38 ± 0.19 fold and 1.56 ± 0.33 fold at 7 and 11-week, respectively (Fig. 5C). In the spleen, the cathepsin Y mRNA level in the LP group significantly increased to 1.28 ± 0.09 fold at 7-week, but no further increase was observed at 11 and 15-week (Fig. 6B). The difference in the cathepsin L mRNA level was not significant between both groups through all periods (Fig. 6C). The same results were obtained when we replaced the internal standard 18S rRNA with GAPDH (data not shown).
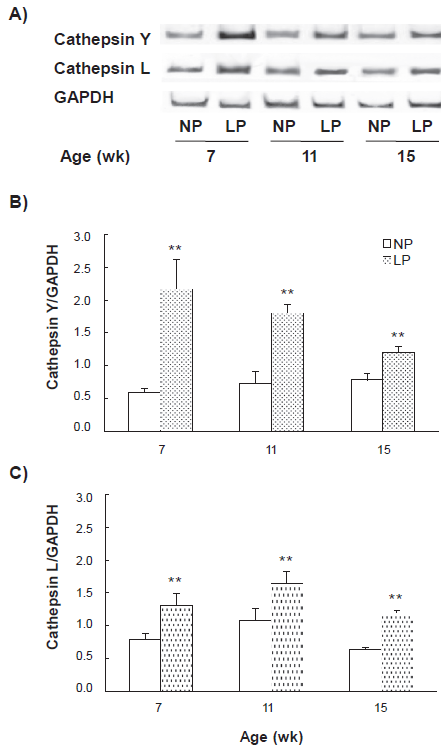
Change in the mRNA expression levels of cathepsins Y and L in the liver during intake periods. Total RNA of 1 µg in the liver was amplified by RT-PCR. The number of PCR cycles for cathepsin Y was 23, and those for cathepsin L and GAPDH were 18. Representative RT-PCR products of cathepsin Y, cathepsin L and GAPDH are shown

Change in the mRNA expression levels of cathepsins Y and L in the pectoral muscle during intake periods. See Figure 4 for other explanations. The number of PCR cycles for cathepsin Y was 23, that for cathepsin L was 18 and that for GAPDH was 15.
Change in the mRNA expression levels of cathepsin Y and L in the spleen during intake periods. See Figure 4 for other explanations. The number of PCR cycles for cathepsin Y and GAPDH was 18, and that for cathepsin L was 21.
Discussion
In the present study, the mRNA expression of cathepsin Y, a novel 37-kDa lysosomal cysteine protease,6–8 was examined in liver, skeletal muscle and spleen of the rats under normal- and low-protein diet from weaning (3-week) to adulthood (15-week) and compared with that of cathepsin L, a general marker of muscle atrophy. 20
First, the mRNA expression of cathepsins Y and L in the tissues of the NP group at 7-week was determined (Fig. 3). The cathepsin Y mRNA expression was found to be high in spleen and liver while low in pectoral muscle, being similar to that of human cathepsin X, 10 a human homologue of rat cathepsin Y. In contrast, the cathepsin L mRNA expression was high in liver and pectoral muscle compared with that in spleen.
Under low-protein diet, the diet intake of the weaning rats was significantly low until 7-week, gradually resumed and reached the same level as that in the NP group at 11-week (Fig. 1A), in agreement with a previous report. 23 A protein malnutrition during the early post-weaning period has been reported to cause behavioral deficits presumably due to detrimental effects on the hippo-campal formation and the cerebellum. 24 The body, liver and spleen of the LP group weighed significantly less than those in the NP group at 7-week, gradually increased thereafter, being coincident with an increase in diet intake, but still could not reach the same level as the NP group at 15-week (Fig. 2, Table 2), probably because the protein intake had not been compensated (Fig. 1B). Increased liver fat contents were found in the LP group at 7-week. These findings on the LP group were consistent with the characteristics of protein-malnutrition after weaning, such as growth inhibition, liver and spleen atrophy, and fatty liver. 25
In the liver from the LP group, the mRNA level of cathepsin Y was significantly increased at 7-week in comparison with the NP group, then the degree of increase gradually diminished at 11 and 15-week, whereas that of cathepsin L was elevated through all intake periods (Fig. 4). The mRNA level of cathepsin Y in the spleen from the LP group was also significantly increased at 7-week, however that of cathepsin L was not elevated (Fig. 6). In contrast, the mRNA level of cathepsin Y in the pectoral muscle from the LP group remained unchanged through all the periods (Fig. 5). Taken together with the results of diet and protein intakes (Fig. 1), it is suggested that the expression of cathepsin Y is strongly induced in liver and spleen to compensate for an amino acid shortage of these tissues due to remarkable protein malnutrition during the early stage of development. In order to confirm the effects of low-protein diet on the expression of cathepsin Y, it would be necessary to analyze its expression using Western blotting method.
We also presumed that the increase in cathepsin Y mRNA expression in the contracted liver and spleen could be associated with stimulation of inflammatory reactions, because cathepsin Y is expressed in macrophages, 7 possesses T-kminogenase activity 6 and is able to produce a kinin-potentiating octapeptide from rat plasma. 7 The expression of T-kininogen in rat liver has been reported to be regulated by interleukin-6 (IL-6), 26 one of the cytokines up regulated during malnutrition. Recently, human cathepsin X has been reported to be expressed mostly in the immune cells such as monocytes, macrophages and dendritic cells 27 and modulate the immune response via activation of beta 2 integrins, 28 and its plasma concentration is significantly elevated during severe injury. 29 Further examinations such as evaluating typical inflammatory markers are necessary to clarify whether cathepsin Y may play an important role in the cellmediated immunodepression observed in weaning animals under protein and energy-malnutrition. 30
The expression level of cathepsin L mRNA was elevated in the liver and pectoral muscle from the LP group through all intake periods (Figs. 4, 5), in good agreement with the previous studies on adult rats under starvation.18,19 Cathepsin L is suggested to be responsible for initiating the breakdown of muscle proteins to supply amino acids, and thus being recognized as a general marker of muscle atrophy. 20 In the spleen, however, there were no differences in cathepsin L mRNA expression between the LP and NP groups (Fig. 6).
In conclusion, cathepsin Y expression was significantly up-regulated in liver and spleen at early periods of protein-restriction, suggesting that it may associate with immunodepression in rats under protein-malnutrition during the early post-weaning period.
Disclosure
The authors report no conflicts of interest.
Footnotes
Acknowledgements
This work was supported in part by Grant-in-Aid for Young Scientists (B) (No. 15700489 to EN) and Grant-in-Aid for Scientific Research (C) (No. 15500560 to HT) from the Ministry of Education, Culture, Sports, Science and Technology of Japan, and by the grant from Nakamura Gakuen University.