
Abstract
Dietary induced metabolic acidosis (MA) results in a negative calcium balance in normal animals. In order to maintain acid-base homeostasis the body's primary base buffer source calcium is mobilized from bone. This study examined the impact of dietary induced MA on bone in an adolescent ovine model. We hypothesized that a MA diet would reduce bone mineral density (BMD) in growing sheep.
Twelve 2 month old lambs of mixed sex were divided into 2 groups. The MA group consumed a ration that was relatively acidogenic compared to the control diet (CD) for 6 months. DXA was performed on days 0 and 180. Arterial blood samples were evaluated on days 0, 30, 120, 150 and 180 for pH, pCO2, pO2, HCT, Na, K, ionized Ca, HCO3–, TCO2, base excess (BE), and O2 saturation. Histomorphometry of the femoral diaphysis was performed from samples harvested at 180 days. Statistical analysis consisted of a 2-way ANOVA for sex and diet with repeated measures for bone mineral content (BMC) and blood parameters, a 2-way ANOVA for one time measurements at 180 d including BMD of the whole body, radii, femora and lumbar vertebrae, and 1-way ANOVA to compare histomorphometric measurements.
Percent increase from baseline for BMD of the whole body was 1.8x greater in the CD group than the MA group. BMC of the whole body and lumbar vertebrae was significantly less in the MA group. Lumbar BMD on day 180 was 30% less in the MA group. Cortical bone was less affected. Radii and femora BMD was 18% and 21% less, respectively, in the MA group than in the CD group. MA treatment significantly decreased pH, HCT, iCa, HCO3–, TCO2 and BE. However, no blood parameters were outside the normal range for this species. Histomorphometry revealed significantly decreased cortical area and thickness and increased mineral apposition rate and endosteal active surface length in the femoral cortex of the MA group compared to the CD group.
This study demonstrated a well compensated dietary induced MA that resulted in a significant decrease in bone mineral acquisition in juvenile sheep. Diets that induce MA may have a profound impact on lowering peak BMD in adolescents and therefore predispose individuals to osteoporosis later in life.
Introduction
Osteoporosis is a common and severe metabolic disease. The lifetime risk of having an osteoporotic related fracture is close to 40% in postmenopausal women residing within the United States. 1 Peak bone mineral density in the young adult and development of osteoporosis later in life are influenced by many factors including lifestyle, life-stage, genetic and dietary factors.2–4
While all factors influencing development of osteoporosis are important, dietary acid has gained recent attention. Several authors have implicated a dietary induced metabolic acidosis as a contributing factor in the development of osteoporosis.5–8 Metabolic acidosis (MA) induces mobilization of calcium buffering salts from bone and increases renal calcium excretion. Calcium absorption from the gastrointestinal tract cannot adequately increase to compensate for the renal losses, therefore an overall decrease in total body calcium ensues. Documented loss of bone mineral and/or increased renal calcium excretion occurs in humans and sheep, but not rats fed acidogenic diets.9–12
Osteopenia induced by MA is typically thought of in the context of pathologic conditions such as chronic renal insufficiency. However with normal renal function, a relative excess of strong anions compared to strong cations in the diet can also induce MA because strong ions are absorbed directly from the intestine and immediately impact acid-base balance. Depending on the composition of the diet, the imbalance may be slight or substantial corresponding to severity of MA. 13 Overall blood pH is maintained within the normal physiologic range by the combined effect of renal excretion of excess ions and mobilization of calcium from bone to act as a buffer. While influence of diet on acid base balance is accentuated in geriatrics with decreased or impaired renal function, the effect of diet on inducing MA and calciuria in people with normal renal function is well documented. 7
Total dietary cation-anion difference may be estimated by measuring strong ion content of the whole diet or calculating it from multiple individual feedstuffs. Multiple articles have discussed methods for determining cation-anion balance in the diet.6,8,14–16 The most important strong ions in the diet are sodium, potassium, chloride and sulfur. Magnesium and calcium have a lesser impact. From dietary analysis, the overall dietary cation-anion difference (DCAD) may be estimated by the following equation:

Diets are analyzed and ions are measured in mEq/kg dry matter (DM). The equation then calculates the acidifying capacity of a particular diet per kg. The influence of a particular diet on acid-base status depends on the quantity consumed. When total daily intakes are known, the daily cation-anion difference consumed per day can also be calculated. 15
In people, dietary acid imbalance arises primarily through the consumption of a diet that is relatively low in potassium and high in the sulfur containing amino acids that comprise animal proteins. 17 This is largely because sodium and chloride are typically consumed as NaCl in balanced equimolar amounts. In response to chronic, dietary acid load the body seeks to maintain neutrality by mobilizing calcium, phosphate and carbonate buffers from the bone. The mechanism by which bone is resorbed is both by physicochemical dissolution in the acidic environment and cell-mediated resorption by osteoclasts that are stimulated by the acidic environment.18,19 Heritable differences in titrat-able acid excretion by the kidney may also play a role in the degree of MA resulting from the diet. 20
The impact of dietary MA has been demonstrated in pre and postmenopausal women and in mature animal models, but not to any extent in the growing skeleton. As adolescents typically consume a diet that is similar to adults, it stands to reason that dietary MA may have a negative impact on the attainment of peak BMD and hence predispose individuals to osteoporosis later in life. Therefore, the purpose of this study was to examine the effect of dietary induced MA during a period of rapid growth. We chose 2 month old lambs and monitored them for 6 months. Bone mineral acquisition was measured by serial DXA examination and bone histology performed after euthanasia. Acid base metabolism was measured by monthly arterial blood measurements.
Materials and Methods
Animals and diet
Twelve skeletally immature 2 month old Rambouillet-Columbia mixed bred sheep were studied following approval of the institutional animal care and use committee. Six sheep, 3 males and 3 females, comprised each of two groups. Group 1 was fed a diet that induced metabolic acidosis (MA) and Group 2 consumed a diet that was relatively alkalogenic compared to the MA diet (CD) and was normal for this species (Tables 1 and 2). Both diets were designed to provide nutrients in excess of and calories appropriate for growth based on values established by the U.S. Board of Agriculture, National Research Council. 21
Nutrient Analysis for the three feedstuffs that comprised the diets fed in this study.

Nutritional analysis for each feedstuff used in the study.

Lambs were weighed monthly and the amount of feed offered was increased based on the mean weight of the group of 6 lambs (Table 3). The total amount of feed for each group of 6 was weighed out daily and fed free choice to the animals in each group. As body weights increased the Mcal/day was increased. When the mean weight of the group was 10 kg, a diet providing 1.7 Mcal/sheep/day was offered; at 20 kg, a diet providing 3.3 Mcal/sheep/ day, at 30 kg a diet providing 4.0 Mcal/sheep/day, at 40 kg a diet providing 4.1 Mcal/sheep/day, and at 50 + kg a diet providing 4.7 Mcal/sheep/day was offered.
Table of estimated total daily intake of nutrients in mEq dry matter (DM) based on amount offered daily which was adjusted monthly based on weight gain and Meal necessary for growth. Based on NRC requirements. Sheep nutrient requirements listed are all in excess of those established by the subcommittee on Sheep Nutrition, Committee on Animal Nutrition, Board of Agriculture, National Research Council and published as Nutrient Requirements of Sheep. 6th edition. 1985. National Academy Press.
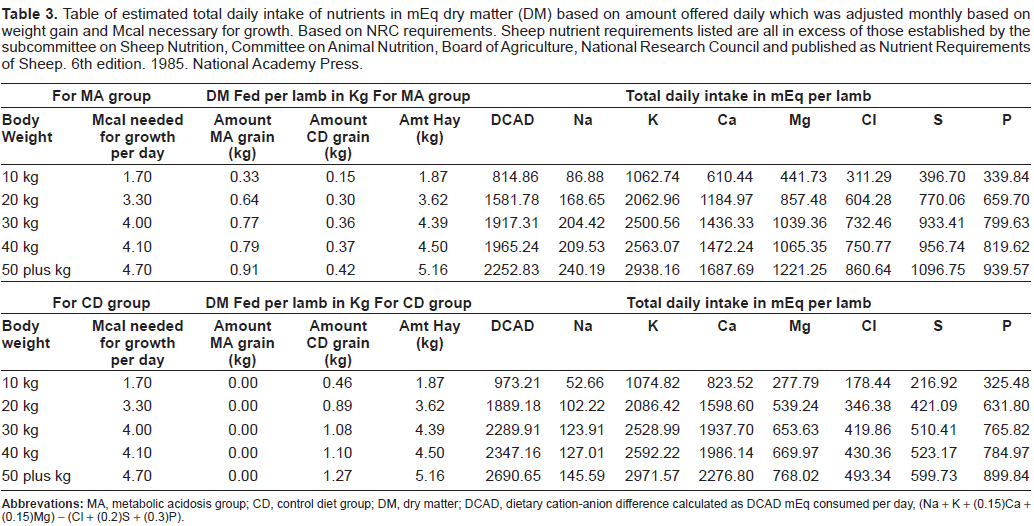
Diets were balanced such that 70% of Mcal per day was provided as hay in both groups. In the CD group, lambs were fed the balance of 30% Mcal/day as grain to provide adequate nutrients for growth. In the MA group, lambs were fed the balance of calories per day divided with 10% Mcal per day of the same grain as the CD group and 20% Mcal per day of an acidotic grain. The composition of each feedstuff is shown in Table 2 and the composition of the feedstuffs based on weight is shown in Table 3. The feeding regimen was designed such that the MA sheep consumed 85% of the daily DCAD of the CD sheep, even though the total number of calories increased throughout the study.
Metabolic acidosis was induced primarily by limiting the amount of potassium and adding magnesium, sodium, sulfur and chloride to the diet in the form of the MA grain. The diets were analyzed to determine the dietary cation-anion difference (DCAD) by quantifying strong ion content; sodium, potassium, chloride and sulfur.
a
DCAD was estimated using the equation below:

DHI Forage Testing Laboratories, Ithaca NY.
All sheep were humanely euthanized using an intravenous overdose of 4g of pentobarbital on day 180. 22
Bone densitometry
Bone densitometry (DXA) examination of the lumbar vertebrae was performed on days 0 and 180. b All measurements were performed by the same operator (JMM.). On days 0 and 180 the BMC and BMD of the last four lumbar vertebrae were measured in a standard dorsoventral view twice then averaged between the two measurements. A whole body DXA scan was also performed. On day 180, BMD data was collected for the lumbar vertebrae and whole body. In addition, ex-vivo BMC and BMD of the radii and femora was measured on day 180. Right and left bones were scanned and the mean taken for analysis of each bone.
Hologic Delphi QDR dual-energy X-ray Absorptiometer and Software version 11.1. Hologic, Inc. Bedford, MA.
Serum and Urine Samples
Arterial blood samples were obtained into heparin-ized syringes on days 0, 30, 120, 150 and 180 and immediately analyzed for pH, pCO2, pO2, HCT, Na, K, ionized Ca, HCO3–, TCO2, base excess (BE), and O2 saturation using a standard blood gas analyzer. c
Diametrics IRMA blood gas analyzer, Diamond Diagnostics, Holliston, MA.
Bone histomorphometry
Sheep were administered oxytetracycline intravenously two times at an 11 day interval prior to euthanasia. Following euthanasia, femurs were harvested at necropsy, wrapped with saline soaked towels, and frozen at −20 celcius until evaluation. The right femur was used for histomorphometric analysis.
The femoral diaphysis was sectioned using a bone saw and a 0.5 cm mid-diaphyseal ring created. Femoral diaphyseal rings were labeled for orientation and unique identification information and then prepared for further processing. After fixation in fresh 70% ETOH for 1 week, the specimens were dehydrated in graded solutions of ETOH (70%, 95%, and 100%) and xylene over the course of approximately 3 weeks. 28 The samples were then infiltrated with a series of solutions containing methyl methacrylate, dibutyl phthalate, and benzoyl peroxide. The final methyl methacrylate solution was polymerized into a hardened plastic block. Sections were then cut using an diamond blade bone saw. d All sections were ground using a microgrinder to 10-20 µm thickness. d Sections were then imaged and analyzed for histomorpho-metric parameters.
EXAKT Technologies, Oklahoma City, OK.
Histomorphometric analysis was performed on all 12 femurs from the MA and CD groups. Unde-calcified immature ovine mid-diaphyseal femurs, stained with oxytetracycline, were sectioned transversely, mounted, and imaged using a SPOT camera system under a Nikon epi-fluorescence microscope with a tri-filter fluorescence cube. Images were analyzed in with a custom semi-automated subroutine. e Parameters measured over the whole section were periosteal cortical area, medullary area, cortical area (peri-osteal less medullary areas), periosteal perimeter length, and medullary perimeter length. The specimen was then divided into cranial, medial, caudal, and lateral quadrants to quantify the quadrant-specific and full cortex mineral apposition rates, average cortical thicknesses, number of cortical pores, area of cortical pores, and the lengths of endosteal and Haversian active surfaces relative to the measured endosteal perimeter length. The observer was blinded to treatment group during analysis.
ImagePro Plus 4.5.1.29, Media Cybernetics, Inc., Silver Spring, MD.
Statistical analysis
Continuous data were reported as mean ± standard deviation. Statistical analysis consisted of a two-way analysis of variance (gender and dietary treatment) for variables measured once including bone mineral density (BMD) of the lumbar vertebrae and whole body at 180 d and bone mineral content (BMC) and BMD of the radii and femora at 180 d. A two-way ANOVA for repeated measures was conducted for the BMC of the last 4 lumbar vertebrae, whole body BMC, animal weights, arterial pH, pCO2, pO2, HCT, Na, K, ionized Ca, HCO3–, TCO2, Base excess (BE), and O2 saturation. One-way ANOVA was conducted on histomorphometrical data to determine effects of diet, gender, and any interactions of diet and gender. Significance determined by p < 0.05 for all comparisons. Analysis was conducted using commercially available software. f
SPSS Inc., Chicago, IL.
Results
All sheep remained in good health throughout the experiment. The sheep in both dietary groups consumed all of the offered feedstuffs each day.
Weight
Weights were similar between groups at the beginning and end of the study (Table 4). There was no effect of gender on weight gain and all sheep gained a significant amount of weight over the course of the study as they grew. There was no significant effect of dietary treatment on weight gain. Mean body weight of the MA group was 13.45 ± 3.22 kg at time 0 and 45.73 ± 7.07 kg on day 180. Mean body weight of the CD group was 13.64 ± 3.22 kg on day 0 and was 48 ± 4.88 kg on day 180.
Lamb body weight change (kg) between 0 and 180 days.

Whole body bone mineral content and density
Mean whole body BMC was not different between groups or genders at the beginning of the study and was not different between genders at 180 d. All sheep gained a significant amount of BMC over the course of the study. The MA sheep had significantly less BMC at 180 d compared to the CD sheep. Mean BMC MA 0 d = 221.65 ± 45.98 g and 180 d = 633.00 ± 78.72 g; CD 0 d = 222.81 ± 44.25 g and 180 d = 970 ± 127.40 g. Change in whole body BMC and Percent change from baseline in whole body BMC was significantly different between groups with the MA group failing to gain as much BMC as the CD group. Mean percent increase from baseline for whole body BMC MA 0 d = 190.69 ± 38% and CD 345 ± 67.77%. This represented a 1.8x greater gain in BMC in the CD group over the MA group (Table 5). Bone mineral density at 180 d was also significantly less in the MA group compared to the CD group; BMD MA 180 d = 0.910 ± 0.046 g/cm2 and BMD CD 180 d = 1.102 ± 0.063 g/cm2 (Table 5).
Significant (p < 0.05) parameters measured in this study between the metabolic acidosis (MA) dietary group and the control (CD) group.

Lumbar bone mineral content and density
Similar to whole body BMC, lumbar BMC was not different between groups or genders at the beginning of the study and was not different between genders at 180 d. All sheep gained a significant amount of BMC over the course of the study. The MA sheep had significantly less BMC at 180 d compared to the CD sheep. Mean BMC MA 0 d = 12.87 ± 3.91 g and 180d = 33.04 ± 10.48 g; CD 0 d = 13.81 ± 5.69 g and 180 d = 46.51 ± 7.90 g. Mean percent increase from baseline in lumbar BMC was not significantly between dietary treatments. Bone mineral density at 180 d was significantly less in the MA group than the CD group; BMD MA 180 d = 0.623 ± 0.059 g/cm2 and BMD CD 180 d = 0.894 ± 0.073 g/cm2. This represented 30% less BMD in the MA group compared to the CD group (Table 5).
Radii and femora bone mineral content and density
At post mortem the radii and femora from each sheep were scanned using DXA and the BMC and BMD from the right and left limbs were averaged for each bone. Dietary treatment, but not gender, had a significant effect with MA sheep having significantly less BMC and BMD than the CD sheep. Mean radial BMC MA 66.2 ± 6.89 g; CD 82.97 ± 10.78 g and mean femoral BMC MA 88.54 ± 10.41 g; CD 115.47 ± 13.00 g. Mean radial BMD MA 0.617 ± 0.040 g/cm2; CD 0.752 ± 0.035 g/cm2 and mean femoral BMD MA 0.741 ± 0.061 g/cm2; CD 0.937 ± 0.062 g/cm2. The BMD of the radii from the MA group was 18% less than the CD group and the BMD of the femora was 21% less (Table 5).
Arterial blood gas measurements
Parameters examined included pH, PCO2, hematocrit (HCT), Na, K, ionized calcium (iCa), HCO3–, TCO2, Base excess (BE), oxygen saturation and total hemoglobin (tHB). None of the examined parameters were influenced by gender. Dietary treatment significantly decreased pH, HCT, iCa, HCO3–, TCO2 and BE in sheep consuming the MA diet (Table 5). Whereas, PCO2, Na, K, oxygen saturation and tHB were similar between treatments. For those parameters that did significantly decrease, they decreased from baseline and remained low throughout the study without any further decline over time. None were considered to be outside of the normal range and therefore declines were not of clinical significance.
Histomorphometric analysis
The cortical area and average cortical thickness were significantly greater in sheep consuming the CD diet compared to the MA diet. Cortical area CD: 186.61 ± 18.26 mm2 vs. MA: 154.56 ± 19.41 mm2 (p = 0.0146). Average cortical thickness CD: 3.57 ± 0.48 mm vs. MA: 3.02 ± 0.41 mm (p < 0.0001). The mineral apposition rate was significantly greater in MA dietary group (MA: 0.89 ± 0.79 mm/year vs. ND: 0.42 ± 0.72 mm/year, p = 0.0356), specifically in the cranial and medial quadrants. A measure of the length of the endosteal active surface for MA group full cortices was found to be significantly greater than the CD group (CD: 2.59 ± 2.67 mm vs. MA: 0.51 ± 1.94 mm, p = 0.0035), but only existed strongly in the caudal quadrant (Fig. 1). The cortical porosities, area of cortical pores, periosteal and medullary perimeters and areas, and Haversian lengths, relative to endosteal perimeter length, were not affected by diet treatment.

Undecalcified histologic composite image of a sheep femora from the MA group displaying caudal quadrant cortical activity. Orientation of image: medial aspect of femoral diaphysis is on the left and caudal aspect of the femoral diaphysis is on the bottom.
Discussion
This study successfully demonstrated that a moderately acidogenic diet may have a profound impact on the accumulation of bone mineral during growth. In addition, while dietary induced metabolic acidosis (MA) does induce shifts in calcium metabolism the effects are well compensated for systemically as evidenced by statistically significant but not clinically significant changes in systemic acid-base status as measured by arterial pH, HCT, iCa, HCO3–, TCO2 and BE. The decrease in hematocrit, unlike the other parameters, cannot be explained by shifts in acid-base balance but was very small and most likely was a spurious finding.
The interaction of diet, lifestyle, and genetics with estrogen depletion and relative impact on the development of osteoporosis is currently a field of growing investigation. Ultimately the loss of bone mineral and the propensity for fractures depends upon the peak BMD and the length of time an individual is exposed to factors that lead to bone mineral loss. One study recently published a theoretical analysis and concluded that postponing the age of menopause by 10% may delay the onset of osteoporosis by 2 years. Whereas improving the BMD by 10% may delay the onset of osteoporosis by as much as 13 years. 25 Therefore, studying factors that influence bone mineral acquisition and maintenance are essential as peak BMD will ultimately influence the number of individuals at risk for osteoporosis.
We have previously shown that feeding mature ewes an acidogenic diet can cause significant loss of bone mineral and the quality of the resulting bone is very similar to human osteoporotic bone histologically 11 , biomechanically 25 and by FT-IR analysis. 26 While increased cortical porosity was not seen in this study, the increased mineral apposition rate observed indicates that active remodeling is increased in lambs subjected to metabolic acidosis, and the quantity of bone mass is significantly reduced when compared to normal diet lambs evaluated hitstomorphometrically. The consumption of an acidogenic diet is commonplace in western societies and is consumed by adults6,27 and adolescents alike. Therefore, this study was undertaken to determine the potential impact of dietary acidosis during adolescence using an ovine model.
We examined BMC over time as it is more independent of bone dimensions and BMD at the endpoint of our study. The results show that consumption of a diet that contains 85% of the cations of the control diet on a daily basis led to a significant decrease in the BMC achieved by the test group. The percent increase from baseline in the control group was 1.8 times greater than that seen in the MA group. This resulted in a whole body BMD in the MA group that was 17.4% less than the control group. Vertebrae, which are rich in trabecular bone, were more significantly affected with a final BMD that was 30% less than the control group. Less pronounced a difference was seen in radii and femora, which are predominantly composed of cortical bone. The radii and femora were 18% and 21% less than the control group respectively. These results are consistent with that seen in bone mineral loss later in life.
On a per kg of dry matter feed basis, the DCAD of the MA diet in this study was approximately 350 mEq and the DCAD of the CD diet was approximately 420 mEq. Both of these diets are relatively more alkaline than a typical human diet. However, it is likely that each species is well adapted to their basal diet and deviations from this induce metabolic acidosis or alkalosis by similar physiologic mechanisms. Some authors claim that humans are most adapted to a more alkaline diet than we typically consume today and this is supported by studies which have found a more positive calcium balance in women supplemented with potassium bicarbonate.9,21,27,28 In adult sheep, where the skeleton is relatively more quiescent, we have found that we can induce significant bone mineral loss over 6 to 12 months. 11 However, the significance of the present study was that we were able to substantially affect bone mineral acquisition with a less severe dietary model over 6 months during a period of rapid growth.
The implication for human research may be that when adolescents consume diets that are similar to adults that the impact upon their skeletal development may be much more profound than previously thought. Their attainment of peak bone mineral density may be significantly decreased thereby predisposing them to osteoporosis later in life.
Disclosure
The authors report no conflicts of interest.