
Abstract
The use of magnetic resonance spectroscopy (MRS) for the detection of in-vivo metabolic perturbations is increasing in popularity in Prostate Cancer (PCa) research on both humans and rodent models. However, there are distinct metabolic differences between species and prostate areas; a fact making general conclusions about PCa difficult. Here, we use High Resolution Magic Angle Spinning Nuclear Magnetic Resonance (HRMAS NMR) spectroscopy to provide tissue specific identification of metabolites and their relative ratios; information useful in providing insight into the biochemical pathways of the prostate. As our NMR-based approach reveals, human and rat prostate tissues have different metabolic signatures as reflected in numerous key metabolites, including citrate and choline compounds, but also aspartate, lysine, taurine, glutamate, glutamine, creatine and inositol. In general, distribution of these metabolites is not only highly dependent on the species (human versus rat), but also on the location (lobe/zone) in the prostate tissue and the sample pathology; an observation making HRMAS NMR of intact tissue samples a promising method for extracting differences and common features in various experimental prostate cancer models.
Introduction
Rodent models are widely used in experimental studies of prostate cancer (PCa), where modern MRI/ MRSI (Magnetic Resonance Spectroscopic Imaging) techniques greatly advanced researchers’ insight into the various pathological processes, including the effects of treatments. However, there are remarkable anatomical differences between rat and human prostates.1,2 Furthermore, there are metabolic differences between the various regions of the prostate, and the nature of these differences varies amongst species. HRMAS NMR spectroscopy has emerged as an excellent, non-invasive tool for studying metabolic pathways and their associated metabolites in intact tissues.3,4 Due to the non-destructive nature of the NMR approach, the tissue specimens employed can be further analyzed by classical histopathological methods and the results may be correlated with pathological staging methods such as the Gleason Score (GS) system which is based on microscopic tumor patterns and is the single most important prognostic factor today. 5 Furthermore, HRMAS NMR spectra provide a “fingerprint” of the metabolome, enabling metabolic profiling. NMR spectroscopic studies of the different zones of the human prostate (peripheral, transition, and central) have shown that each zone has its own distinctive metabolic profile, as do some of the various pathological states of the prostate (eg, glandular and stromal benign prostatic hyperplasia (BPH), precancerous lesions, and adenocarcinoma). 6 Notably, it has been reported that levels of citrate are decreased while levels of choline compounds are increased in malignant prostate tissue as compared to non-malignant; consequently, these changes are considered to be useful biomarkers of malignancy since they are detectable by standard clinical MRSI scanners.3,7
Thus, small animal MRSI is emerging as a powerful tool for investigative research. However, it is unclear whether the spectroscopic markers used in human tissue are also applicable to animal models.8,9 Hence, further research is warranted into the relationship between the species and prostate lobe/zone from which a sample is taken, the pathology of the sample, and the levels of the various metabolites observed in the sample. The main objective of this study was therefore to qualitatively characterize the metabolic differences and similarities between different species and prostate pathologies using HRMAS NMR (often used as a high resolution complement to in vivo MRSI). To this end, we analyzed tissue samples from the combined dorso-lateral (DLP) lobes and the ventral prostate (VP) lobe of normal rats, and Dunning R3327-PAP rat prostate tumors, as well as both non-malignant and malignant tissues samples from the peripheral zone of the human prostate.
Our results clearly indicate distinct metabolic signatures in human and rat prostate tissues. Key metabolites found in the human peripheral zone prostate, visible by MRSI scanners, include citrate and choline-compounds, while the spectra of the VP are characterized by a dominant multiplet originating from aspartate in the region where also citrate resonates, and pronounced resonances typical for lysine. The spectra obtained from the DLP display intense choline-compounds, while the Dunning PAP tumor spectra are containing resonances typical for Omega-6 compounds. In addition, also many other significant metabolites are observed in prostate tissue, such as taurine, myo-inositol, scyllo-inositol, the polyamines, glutamate, and glutamine; all of them highly dependent on the species, the zone and lobe area from which the specimen was sampled, and on the sample's pathology. As our study shows, HRMAS NMR analysis of intact tissue samples provides a versatile tool for comprehensive analysis of specific tissue samples and their metabolic processes; making it a suitable method for evaluation of experimental prostate cancer models.
Material and Methods
Source of material and preparation
Human specimens
Twenty-seven patients were operated upon for clinical stage T1–T3 prostate cancer, with a Gleason score 6 (3 + 3); n = 17, or 7 (3 + 4); n = 10. Age: 59.6 ± 5.8 (mean ± SD), (range 41–71). Their mean serum prostate specific antigen (PSA) was 12.4 ng/ ml ± 13.0 (mean ± SD), (range 3.4–50). Tissue samples were punched out from the surgical specimens by the pathologist (Anders Bergh) within 20 minutes of removal of the specimen, and immediately frozen in liquid nitrogen. A total of n = 191, (n = 147 non-malignant, and n = 44 malignant) specimens were included in this study.
Rat specimens
Six adult male Copenhagen × Fisher F rats (ALAB, Uppsala, Sweden) were transplanted subcutaneously with pieces of highly differentiated Dunning R3327 PAP adenocarcinomas in their right flank as earlier described. 10 Upon growth to 1–2 cm in diameter each tumor was removed and immediately frozen in liquid nitrogen. Nine adult male Sprague-Dawley rats (B&K, Stockholm, Sweden) were sedated, and their ventral prostate (VP) and dorso-lateral (DLP) lobes were removed and immediately frozen in liquid nitrogen. The study protocols were approved by the relevant ethical boards in Umeå.
HRMAS NMR experiments
NMR experiments were performed as we recently described in detail. 4 The NMR spectra were obtained at 500 MHz ( 1 H) using a 4 mm HRMAS dual band ( 1 H and 13 C) probe (Bruker, Karlsruhe, Germany). 1D (one dimensional) NMR spectra were acquired at RT (room temperature) using a rotor-synchronized Carr-Purcell-Meibom-Gill (CPMG) pulse sequence [90° - (τ - 180° - τ)n-acquisition] with a T2 filter to suppress broad NMR resonances, and the following settings: 5 kHz sample spinning speed, 256 transients, 5s recycle delay. TOCSY (Total Correlation Spectroscopy). 11 NMR experiments were performed with 41.8 ms mixing time at 2.25 kHz sampling. All NMR spectra were processed using MNova 6.1.0 (Mestrelab Research, A Coruña, Spain). The free induction decays (FID's) of the CPMG edited 1 H HRMAS spectra were subjected to a 1.5 Hz exponential multiplication prior to Fourier transformation. The spectra were referenced to the residual water peak by setting the chemical shift of the lactate doublet equal to exactly 1.33 ppm. 2D TOCSY, recorded with 2,048-512 complex data points. A 90° shifted sine squared window function and 2 Hz line prediction (LP) was applied. The metabolite resonances and 2D (two dimensional) HRMAS NMR cross peaks were assigned according to published chemical shift values. 4 After HRMAS NMR analysis, samples were fixed in formalin and embedded in paraffin, and then 5 μm sections were stained with haematoxylin-eosin and subjected to histopathological analysis. The percentage of tumor tissue in each sample was quantified using stereological methods as described earlier. 12
Statistics
Statistics were performed on the human prostate tissue samples. The resulting data generated from the line-fitting procedure were transferred into Excel (Microsoft Office Excel 2003) for the construction of a matrix. The resulting data matrix, consisting of integral ratios of selected metabolites, was brought into SPSS (v. 16.0, SPSS, Chicago, IL, USA) for statistical calculations. The following variables were included in the investigation; (GPCho+PCho)/Cre, Choline/Cre, (tCholine+Cre)/Citrate, and Citrate/Cre. Receiver Operating Characteristic (ROC) and Area Under the ROC Curve (AUC) analysis was used to define sensitivity and specificity of the models ability to correctly classify malignancy vs. non-malignancy. Multivariate logistic regression was used to perform a dichotomized analysis of the obtained prostate tissue data to determine whether the tissue sample is malignant or non-malignant, Odds Ratios (ORs) and 95% confidence intervals (CIs) were calculated. P-values ≤ 0.05 were considered to be statistically significant.
GC-MS analysis
The GC-MS (gas chromatography-mass spectrometry) studies were performed as previously described. 13 The files containing the data from these studies were exported into MATLAB 7.3 (R2006b) (Mathworks, Natick, MA) in NetCDF format for further data processing and analysis.
Sample preparation
Frozen tissues from the VP (n = 3) and DLP (n = 3) were homogenized in liquid nitrogen prior to weighing and extracted in 1.5 ml Eppendorf tubes with a mixture of chloroform:methanol:water (2:5:2, v/v/v; 1 mL of extraction solution per 15 mg of tissue). Two 3 mm diameter tungsten beads were added to each tube and the tissues were homogenized for 2 min at 30 Hz in a MM400 mixer mill (Retsch, Germany). The samples were then centrifuged at 4°C at 14 000 rpm for 15 minutes. A 0.2 mL aliquot of each supernatant was dried for two hours in a miVac Quattro Concentrator (Genevac Inc, New York, USA). The residue was then left in 0.03 mL of methoxylamine hydrochloride in pyridine (15 mg/mL solution) for approx. 16 h. 0.03 mL of MSTFA (N-Methyl-N-(trimethylsilyl)trifluoroacetamide) containing 1% TMCS (trimethylchlorosilane) was added to the solution, which was then left to derivatize for 1 h. After silylation, 0.03 mL of a solution of methyl stearate in heptane (15 ng/μL) was added to the sample as an internal standard prior to the GC-MS analysis.
Aspartate and citrate determination (GC-MS)
The concentrations of aspartate and citrate in tissue samples were calculated by external calibration. Mixtures of aspartate and citrate standards ranging in concentration from 0.05 μg/μL to 0.0001 μg/μL were used to create calibration curves. Peak areas were calculated using a MATLAB 7.3 (R2006b) (Mathworks, Natick, MA) script developed in-house for multiple calculations of pure mass channels, as a sum of areas for compound-specific mass channels: m/z 232, 218 and 202 for aspartate and m/z 273 and 211 for citrate.
Results
NMR experiments were performed on various human prostate tissues; typical
1
H HRMAS NMR spectra are shown in Figure 1a, b. The study focuses on NMR peaks in the region of the spectrum between 1.25 ppm and 3.50 ppm, which contains peaks corresponding to a range of interesting metabolites (as indicated). Importantly, this region is free of peaks arising from alcohol-based markers that are used on prostatectomy material for anatomical identification, and which frequently contaminate NMR samples (ethanol gives rise to peaks at 1.19, 3.65 and 5.25 ppm). In addition, the TOCSY NMR spectrum and the supplemental spectra show the NMR region between 0.7 ppm and ~4.0 ppm. A typical NMR spectrum of a non-malignant human tissue sample is shown in Figure 1a, while Figure 1b shows a typical NMR spectrum of a malignant prostate sample. It is clearly visible that there are pronounced differences in the appearance and intensity of the peaks in the spectra of the two tissue samples, indicating the potential of the method for the identification of different metabolites and even changes in their levels in various tissues. This is essential if one is to obtain detailed insights into metabolism in the prostate and the pathological changes induced by the onset of cancer.
Representative
1
H MAS NMR spectra obtained from: A) human (57 yrs old patient) non-malignant prostate tissue, with a characteristic large double doublet at 2.65 and 2.55 ppm arising from citrate; B) a human (64 yrs old) 100% malignant prostate tissue. Note the small citrate peaks, the absence of the polyamines and the increased intensity of the GPC+PC peak relative to that of Cho.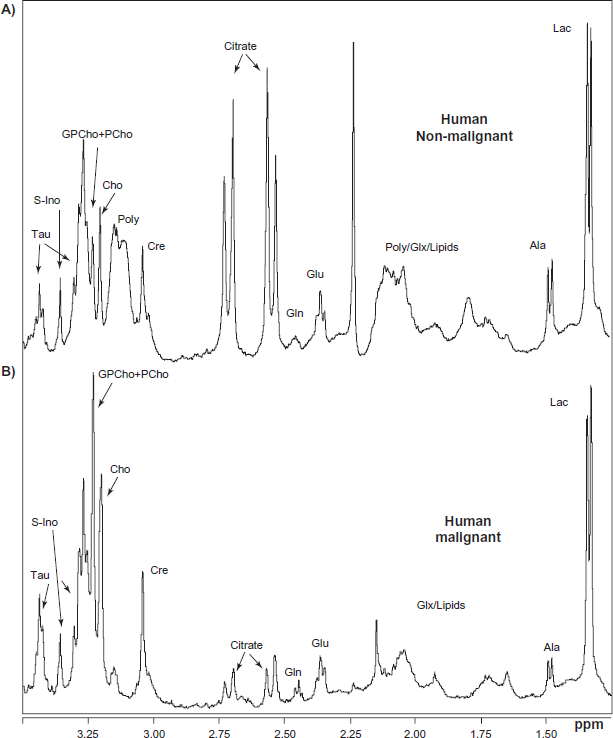
As can be seen in Figure 1a, NMR spectra of non-malignant human prostate tissue feature prominent and characteristic citrate resonances. Peaks corresponding to other typical metabolites with resonances in the region between 1.25–3.50 ppm are also observed, including lactate (1.33 ppm), alanine (1.48 ppm), glutamate (2.05, 2.15, and 2.35 ppm), glutamine (2.14 and 2.47 ppm), citrate (2.55 ppm and 2.65 ppm), creatine (3.02 ppm), polyamines (3.05–3.15 ppm), choline (3.20 ppm), glycerophosphorylcholine + phosphorylcholine (GPCho+PCho) (3.22 ppm), taurine (3.25 and 3.46 ppm), myo-inositol at 3.29 ppm and scyllo-inositol at 3.35 ppm. However, the NMR spectra of malignant human prostate tissue are, in most cases, characterized by a comparatively small citrate peak and a GPCho+PCho peak that is noticeably taller than the choline peak; these differences are clearly visible in the NMR spectrum (Fig. 1b). The intensity of the combined GPCho+PCho peak at 3.22 pm is considerably greater than that of the free choline peak at 3.20 ppm. This change in ratio is assumed to be a sign of malignancy.
Many metabolites appear to be present at similar spectral levels in both malignant and non-malignant human prostate tissue (Fig. 1a,b). The specific sample of malignant prostate tissue whose spectrum is displayed in Figure 1b consisted exclusively of tumor tissue. If one compares NMR spectra arising from several different human prostate samples, it is apparent that there is a significant degree of intrinsic variability in the relative levels of specific metabolites from one sample to the next (see supplemental data for examples of typical NMR spectra obtained under identical conditions for a range of samples). In general, the spectra of non-malignant tissues display large variations in the observed levels of citrate (2.55 ppm and 2.65 ppm) and polyamines (3.05–3.15 ppm) (Fig. 1a, Supplement 1a). The proportion of tumor cells in the malignant prostate tissue samples used in this study ranged from 10%–100% (as determined by stereological measurements), and it seems reasonable to suppose that this variability contributed to the heterogeneity of their spectra. The infiltration of tumor cells among normal cells is one of the characteristics of prostate cancer, i.e., most samples are a variable mix of cancer cells, non-malignant epithelial cells and different types of stroma cells. This heterogeneity is also reflected in the large variability in the presence and concentrations of lipids observed in the spectra of these samples. Some of the resonances due to lipids are observed at 0.9 ppm, 1.3 ppm, 2.05 ppm, and 2.8 ppm, (Fig. 1b, Supplement 1b).
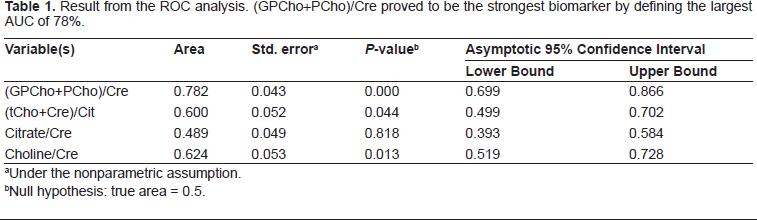
The result from the ROC analysis can be seen in Figure 2 and Table 1. The ratio of (GPCho+PCho)/ Cre proved to be the biomarker that defined the largest AUC of 78.2%, 95% CI 0.70–0.87, (P < 0.001). The ratio of (tCho+Cre)/Citrate, which is common in MRS diagnosis of the prostate, showed a low AUC 60%, 95% CI 0.50–0.70, although with a significant P-value of 0.044 (Table 1). The other spectral markers; Choline/Cre, and Citrate/Cre, AUC defining properties are shown in Figure 2 and Table 1.
Receiver Operating Curve (ROC) displaying how the different biomarkers; (GPCho+PCho)/Creatine, (tCho+Cre)/citrate, Choline/Creatine and Citrate/Creatine, are defining the area under the ROC (AUC). Result from the ROC analysis. (GPCho+PCho)/Cre proved to be the strongest biomarker by defining the largest AUC of 78%. Under the nonparametric assumption. Null hypothesis: true area = 0.5.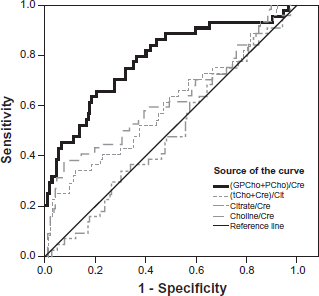
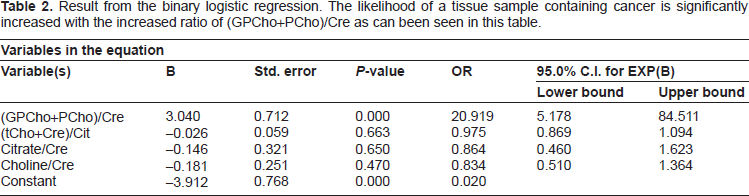
Result from the binary logistic regression. The likelihood of a tissue sample containing cancer is significantly increased with the increased ratio of (GPCho+PCho)/Cre as can been seen in this table.
For comparative purposes, animal (rat) models of prostate cancers were studied using the same NMR techniques as used to analyze human prostate tissues. Various rat prostate tissues, including the Dunning prostate tumor, were investigated (as described in the Materials and Methods section). Typical NMR spectra of the different tissue types examined are shown in Figure 3a, b, c. Figure 3a shows the NMR spectrum of a healthy rat ventral prostate (VP) tissue sample, which is characterized by intense resonances attributable to aspartate and the essential amino acid lysine. In addition, the NMR spectrum shows the presence of a wide range of small organic compounds, many of which were also visible in the NMR spectra of analogous non-malignant human prostate samples (Fig. 1a). There were some notable differences between the spectra of non-malignant human and rat VP tissues. Specifically, there were differences in the relative sizes of the peaks corresponding to various metabolites, including the polyamines, aspartate, citrate, glutamate and glutamine, myo-inositol, scyllo-inositol, and lysine. These compounds were identified by means of 2D TOCSY NMR experiments using rat VP tissue (Fig. 4). The spectra of non-malignant human prostate samples exhibit a large double doublet at 2.55 ppm and 2.65 ppm attributable to citrate. By contrast, the region between 2.6–2.8 ppm in the spectra of non-malignant rat VP tissue is dominated by a multiplet arising from aspartate, and only the upfield doublet resonance of citrate at 2.55 ppm is resolved and visible, albeit with a lower intensity than is observed in the analogous human samples. The peaks at 1.47, 1.7 and 3.05 ppm show the presence of the amino acid lysine in the VP spectrum (Fig. 3a). The lysine peak at 1.47 ppm is coincident with, and swamps, the alanine signals that one would expect to observe at 1.48 ppm (visible in Fig. 3b, c). The polyamines also contribute to the spectral profile of the ventral prostate, as indicated by the intense resonances observed at 3.05–3.15 ppm. Additionally, the VP spectra contain intense peaks attributable to glutamate (at 2.05, 2.15, and 2.35 ppm) and glutamine (at 2.14 and 2.47 ppm); these peaks are much less pronounced in the spectra of non-malignant human prostate tissue.
Representative
1
H MAS NMR spectra obtained from: A) healthy rat ventral prostate tissue, B) healthy rat dorso-lateral prostate tissue, C) the Dunning R3327- PAP rat prostate tumor.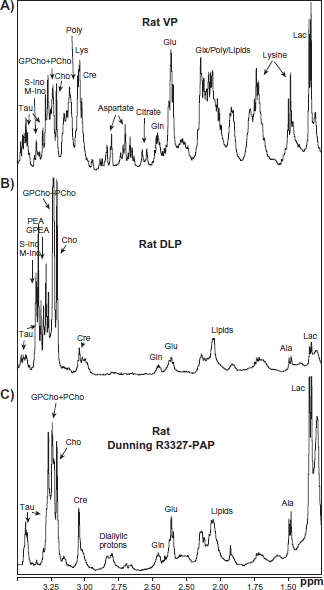
The NMR spectra of healthy rat dorso-lateral prostate (DLP) tissues (Fig. 3b) are quite different from those of VP tissues. Specifically, the DLP spectra are characterized by an absence of notably intense peaks at chemical shifts below 3.1 ppm. When comparing tissue samples from a single rat, it is observed that the intensity of the choline peaks at 3.2 and 3.3 ppm is significantly greater in the spectrum of the DLP than in the spectrum of the VP (Fig. 3a). The majority of the spectra of DLP tissues contain a very intense peak attributable to (GPCho+PCho) at 3.22 ppm, which is significantly larger than the nearby choline peak at 3.20 ppm and the creatine peak at 3.02 ppm (see supplemental data for further details). A similarly high ratio of (GPCho+PCho) to creatine and/or choline was observed in the spectra of malignant human prostate samples; this is somewhat puzzling because the DLP samples used were all taken from healthy rats. By contrast to the spectra of the VP, no signals corresponding to citrate or aspartate were observed in the DLP analyses. Low resonances most likely arising from lysine were also detected in the DLP.
In addition to DLP and VP rat tissues, Dunning R3327- PAP tumor tissues were also studied by NMR; a typical spectrum is shown in Figure 3c. The NMR spectra of these tissues are characterized by the absence of citrate and, as was observed with malignant human and DLP tissues, a pronounced GPCho+PCho peak at 3.22 ppm, the intensity of which is considerably greater than that of the choline resonance at 3.20 ppm. The spectra of this particular type of rat prostate tumor exhibit certain similarities to those of the human cancer samples shown in Figure 1b. However, the glutamate resonance at 2.35 ppm is noticeably more pronounced in the rat tumor sample than in the malignant human tissue. The NMR spectrum of the Dunning tumor is more similar to the spectrum of the DLP than to the VP spectrum, although the glycerophosphorylethanolamine (GPEA) and phosphorylethanolamine (PEA) resonances at 3.30 ppm and 3.23 ppm, and the myo-inositol and scyllo-inositol signals at 3.29 ppm, 3.35 ppm, are significantly more intense in the DLP spectrum than in those of the tumor samples (Fig. 3b). Interestingly, all of the Dunning tumor spectra contain intense peaks at 2.8 ppm that overlap part of the aspartate peaks found between 2.6 and 2.8 ppm. Previous studies using 2D TOCSY and 2D GE-HSQC (Gradient-Enhanced Heteronuclear Single Quantum Coherence) have shown that these intense peaks are attributable to the diallylic protons of essential polyunsaturated omega-6 fatty acids.
4
Note that the variability in the NMR spectra of different (but inbred) animals was smaller than the variation between the spectra of individual human patients, as can be seen in Supplemental figures 1a, b and 2a, b, c.
2D HRMAS NMR TOCSY spectrum obtained from a rat VP tissue and used to verify the assignment of selected resonances observed in the 1D CPGM spectra. The characteristic cross-peaks attributable to lysine, aspartate, spermidine (one of the polyamines), taurine, glutamine, glutamate, myo-inositol, and scyllo-inositol are indicated in the figure. The characteristic cross peaks of citrate were below the limit of detection in this case.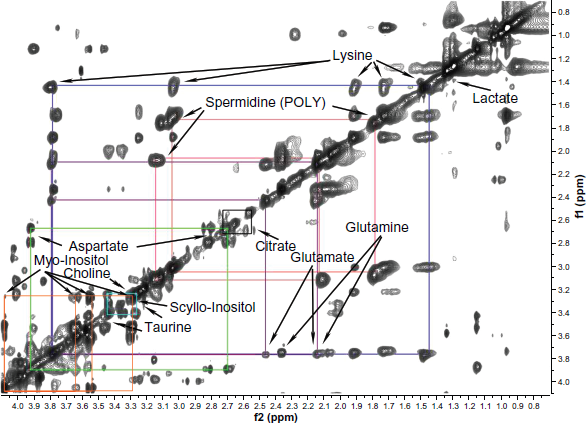
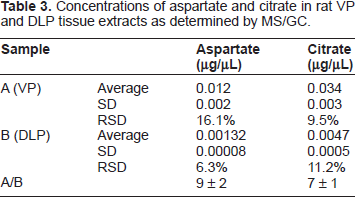
Concentrations of aspartate and citrate in rat VP and DLP tissue extracts as determined by MS/GC.
Discussion
By using an HRMAS NMR approach for identifying key metabolites in human and rodent PCa tissues we could reveal metabolic differences, which were not only species dependent but also on the location in the tissue and its sample pathology. In general, the results of our HRMAS NMR experiments on human prostate tissue samples are generally consistent with earlier observations regarding citrate accumulation in normal prostate epithelial cells, ie, decreased citrate levels are a hallmark of malignancy in the prostate.7,15 Our (unpublished) observations suggest that the differences in citrate concentrations seen amongst spectra arising from different samples of non-malignant human tissue are mostly due to differences in the amount of epithelial cells present in the individual specimens. However, the NMR spectra of some of the malignant human tissue samples examined, including some that consisted entirely of tumor tissue, did not exhibit decreased citrate levels. The pathological staging post-HRMAS did not indicate correlations between Gleason Score and detected biomarkers. There were only slight differences in GS among the patients which may be part of the explanation for this. Statistics on the human prostate tissues were performed to investigate which of the four common biomarkers; (GPCho+PCho)/Cre, (tCho+Cre)/ Citrate, Choline/Cre, and Citrate/Cre, that possesses the strongest predictive abilities for the discrimination of malignant vs. non-malignant human prostate tissue. As both the ROC AUC and the binary logistic regression revealed, the metabolic ratio of (GPCho+PCho)/ Cre proved to be the strongest biomarker. This difference in resonance intensity of (GPCho+GPCho) is often easily visually detected in the spectra, ie, it does not necessarily require numerical calculations. The variability in intensity of the citrate resonance makes this common biomarker of PCa more uncertain, as can be viewed in Supplement 1ab. The metabolic differences that are visually distinguished when comparing the HRMAS NMR spectra of VP, DLP and Dunning prostate tissues were pronounced and, consequently, there was no need for statistical verification of these major dissimilarities.
The intensity of the citrate peaks in the NMR spectra of normal rat VP tissues is very low; by contrast, these spectra contain pronounced multiplets attributable to aspartate (the precursor of citrate) 16 which partially overlap the double doublet of citrate. Neither citrate nor aspartate peaks were visible in the spectra of the rat DLP samples examined. Overall, these findings suggest that the presence or absence of a citrate peak in NMR spectra of prostate tissues may not be an ideal universal indicator for determining whether a prostate tissue sample is normal or malignant, especially if one compares tissues originating from different species, as eg, rodent models versus human models. The main focus of the work presented here is to qualitatively investigate differences in the metabolism of the prostate. Relative changes in metabolite levels and appearance could easily be analyzed in individual spectra of tissue by exploiting chemical shift differences and relative intra-spectral intensities.
The synthesis of citrate in the human prostate is directly dependent on aspartate, which is present in extraordinarily high concentrations in the prostate. Aspartate is a non-essential amino acid in most mammalian cells other than the citrate-accumulating cells in the prostate. The transamination of aspartate generates oxaloacetic acid (OAA). Citrate is then synthesized from OAA and acetyl Coenzyme A (which is derived from glucose). A Na+ dependent high-affinity L-aspartate transporter has been identified in prostate cells, which participates in the uptake of high levels of aspartate from the circulatory system. 16 Aspartate gives rise to an ABX coupled spin system that appears as a multiplet in NMR spectra. This multiplet includes peaks at 2.65 ppm that could easily be misinterpreted as citrate, especially when viewing spectra generated from rodent prostates by a standard small animal MRSI scanner. Citrate gives rise to peaks at ~2.65 ppm and ~2.55 ppm, hence the citrate and aspartate peaks at 2.65 ppm coincide. Interestingly, the NMR spectra of VP samples from rats contain large peaks stemming from the essential amino acid lysine at 3.05, 1.7 and 1.47 ppm. Lysine is often the limiting dietary amino acid 17 and nutritional studies have detected interspecies differences in its metabolism; notably, rats appear to be able to conserve and re-use this particular amino acid. 18 Peaks corresponding to lysine were not observed in the 1 H HRMAS NMR spectra of either the malignant or the non-malignant human prostate samples, or in the Dunning tumor rat samples. However, resonances, (most likely), arising from lysine were detected in the DLP, although is much lower concentrations than in the VP. These findings raise questions about why the DLP and the VP do not have more similar metabolism.
Interestingly, despite the small (or non-existent) peaks corresponding to metabolites such as aspartate or citrate in the spectra of certain prostate samples, the metabolites are not necessarily absent in these tissues. The GC-MS data show that both compounds are present, and that the concentration of citrate is greater than that of aspartate, in normal rat VP and DLP tissue. This apparent discrepancy emphasizes the complexity of biochemical systems in living organisms, as discussed above. In order to assess the impact of the NMR sequences employed on the relative intensities of the peaks observed in the spectra of the tissue samples, additional NMR trials using CPMG sequences with varying echo times were conducted (data not shown 4 ). Since our NMR spectra were obtained using a CPMG pulse sequence with a 20 ms echo time, a significant T2 weighting of the NMR signal intensities occurs. By analyzing spectra acquired at various different echo times (data not shown), T2 values of 58 ms and 361 ms for citrate and aspartate were measured, respectively. Using these values, a CPMG experiment with 20 ms echo time will underestimate the molar ratio of citrate to aspartate by approximately 34%. These findings indicate that the NMR experiments discussed in this paper may underestimate the molar ratio of citrate to aspartate by approximately a third. Nevertheless no peaks corresponding to citrate, or aspartate were observed in the NMR spectra of the DLP (obtained from the same rat from which the VP sample was taken); an observation indicating very low concentrations of these metabolites in the DLP. The dorsal and the lateral lobes are often combined as the dorsolateral lobe (DLP) as they share the same ductal system and therefore making it difficult to separate them. The LP is thought of as the one lobe of the rat prostate that is the most similar to the human peripheral zone. 19 The lateral lobe actually comprises two different ductal systems; the lateral type 1, and the lateral type 2. 20 It is interesting to note that the lateral lobe of the rat prostate demonstrates similar cellular citrate and zinc accumulating characteristics as with the human glandular peripheral zone. The rat ventral lobe shares the same characteristics but not the dorsal lobe. 23 Further studies to spectrally scrutinize the different areas of the DLP are warranted.
The spectra of Dunning rat prostate tumors did not contain pronounced peaks corresponding to citrate or aspartate. Similar observations were made in a previous study in which MRS was used to examine seven different Dunning rat prostate tumor sub-lines. 21 This is perhaps not surprising as the Dunning tumor is believed to originate from the DP, which lacks citrate-accumulating cells.21–23 In transgenic mouse models of prostate cancer the citrate peak has been found to be reduced in the probasin-ErbB-2Δ X Pten+/- mouse, but unaffected in the TRAMP model 8 or only decreased in poorly differentiated cases. 9 All of the Dunning tumor samples contained the PUFA omega-6, as demonstrated by the presence of a pronounced resonance at 2.8 ppm. This PUFA was also found in some rat DLP samples and has previously been observed in 4 out of 27 human prostate tumor samples, 4 but it was not detected spectroscopically in any of the non-malignant human prostate tissues or in the healthy rat VP tissues. Inositol is an interesting compound that seems to be important in male reproductive processes. 24 The most common form is myo-inositol and its isomer scyllo-inositol, both of them detectable in all human NMR spectra, here. Even, the VP and the DLP spectra contain resonances from myo-inositol, while the scyllo-inositol is difficult to distinguish due to overlapping signals in the relevant spectral region. The spectra obtained from the Dunning tumor reveals that the inositol levels in general are much lower than in the VP, DLP and the human prostate tissue samples.
Human cancer samples were characterized by prominent peaks arising from choline compounds, as has been previously reported,4,25,26 but high choline compounds (and low citrate) peaks were also observed in the spectra of normal dorso-lateral rat prostate tissue, indicating that increases in the levels of choline compounds may not be useful as a universal marker of malignancy in prostate tissue samples.
Conclusions
High resolution NMR spectroscopy on intact tissue samples provides unique information on the metabolism of the prostate; information useful for future metabolic studies on living animal models by MRSI scanners. Already 1D proton NMR spectra provide identification of key metabolites and their relative distribution in a specific tissue sample as visible in their intra-spectral NMR resonance intensities. As our study shows, the NMR visible distribution of metabolites observed in a prostate sample is highly dependent on the species, the zone and lobe area from which the sample was taken, and on the sample's pathology. While a decrease in the intensity of the citrate peak and an increase in that of the (GPCho+PCho) peak are useful markers of human prostate malignancy, they are not universally applicable because the absolute and relative intensities of their NMR specific resonances in individual NMR spectra are not only a result of the sample origin such as species or prostate zone/lobe, but also on the grade and stage of the tumor.
Abbreviations
prostate cancer;
polyunsaturated fatty acid;
high-resolution magic angle spinning;
total correlation spectroscopy;
ventral prostate;
dorsolateral prostate;
glycerophosphorylcholine + phosphorylcholine;
glycerophosphorylethanolamine;
phosphoryl-ethanolamine;
choline;
creatine.
Footnotes
Acknowledgements
Support by the Lion's Cancer Research Foundation (grant no. AMP 04-408), Umeå University, the Swedish Cancer Foundation and Swedish Research Council are gratefully acknowledged. Thanks are due to Birgitta Ekblom, Elisabeth Dahlberg, Pernilla Andersson (Department of Medical Biosciences, Pathology), Kerstin Almroth and Britt-Inger Dahlin (Department of Surgical and Perioperative Sciences, Urology and Andrology), and Ingmar Sethson for technical assistance.
This manuscript has been read and approved by all authors. This paper is unique and is not under consideration by any other publication and has not been published elsewhere. The authors and peer reviewers of this paper report no conflicts of interest. The authors confirm that they have permission to reproduce any copyrighted material.