
Abstract
The aim is to investigate the relationship between microstructural white matter (WM) diffusivity indices and macrostructural WM volume (WMV) among healthy individuals (20–85 years). Whole-brain diffusion measures were calculated from diffusion tensor imaging using FMRIB software library while WMV was estimated through voxel-based morphometry, and voxel-based analysis was carried out using tract-based spatial statistics. Our results revealed that mean diffusivity, axial diffusivity, and radial diffusivity had shown good correlation with WMV but not for fractional anisotropy (FA). Voxel-wise tract-based spatial statistics analysis for FA showed a significant decrease in four regions for middle-aged group compared to young-aged group, in 22 regions for old-aged group compared to middle-aged group, and in 26 regions for old-aged group compared to young-aged group (
Keywords
Introduction
Normal aging in the human brain manifests itself through structural and functional changes accompanied by cognitive decline even in the absence of disease. There have been several studies attempting to comprehend the age-related microstructural changes1,2 and macrostructural degeneration of brain tissue.3,4 White matter (WM) being an important factor in brain aging consists mostly of myelinated long distance axonal projections of neurons and glial cells, such as oligodendrocytes and astrocytes, which may be differently affected with age in mammals. 5 Some reports showed age-related changes in WM volume (WMV) along with different WM integrity indices 6 but specific relationship between micro- and macrostructural mechanisms remains unclear. Hence, it is important to study the relationship between the macrostructural measure, ie, WMV, derived from structural T1-weighted magnetic resonance imaging and the microstructural measures of WM integrity indices, such as fractional anisotropy (FA), mean diffusivity (MD), axial diffusivity (AD), and radial diffusivity (RD), using diffusion tensor imaging (DTI) to get an insight into life-span aging.
The atrophy of human WM with aging is caused by a loss of myelinated fibers with a small diameter. 7 Postmortem studies revealed progressive decrease in myelin lipid concentration starting from as early as 20–100 years of age. 8 Also, during normal aging, the myelin breakdown processes make a significant contribution to the degradation of cognitive processing speed.9–11 On the other hand, water diffusion in WM tissue is stronger when parallel, rather than perpendicular to myelinated nerve fibers; DTI can be utilized to gain information about the integrity of nerve fibers. Thus, many features of WM are not directly related to myelin and may affect FA and WMV in different ways. Therefore, FA reflects aspects of axonal integrity and organization that are not related to myelin, 12 and myelin is not necessary for fibers to have significant diffusion anisotropy. 13 In addition to FA, AD and RD were also related to age and WMV.
Several investigations have been done on the age-related alterations in various measures of WM integrity. The effects of age and gender are not uniform with normal aging in several WM regions. 14 Age differences are found greatest for the parietal and occipital regions. 15 Evidence from early brain morphology studies has revealed greater total WMV in males than females.16,17 The global effects of aging on brain volume, MD, and FA using voxel-based analysis showed that brain volume and FA were negatively correlated predominantly in anterior structures and MD was positively correlated in the periventricular WM. These results indicate that diffusion properties and brain volume are complementary markers to the effects of aging. 18 The patterns of age-related differences in WM integrity measures, such as FA, AD, and RD, revealed a relatively new pattern (radial increase/axial decrease) that varied by brain region and may reflect differential aging of microstructural (eg, degree of myelination) and macrostructural (eg, coherence of fiber orientation) properties of WM. 19 The age-related changes, sex differences, and age-by-sex interactions in WM integrity (FA, AD, and RD) across the whole brain showed that global FA was negatively correlated with age and AD and RD were positively correlated with age. 20 Recent study reported linear and curvilinear correlations of FA, MD, and WMV with age in children. 21 Correlations between FA and age as well as between MD and age showed exponential trajectories in most regions of interest in males and females, except for several fibers, such as the corpus callosum connecting the bilateral rectal gyri in males. 21
Earlier investigations also reported regional changes in MD and FA in the central nervous system during normal aging, and results showed a significant increase in MD in frontal WM and lentiform nucleus and significant FA decline in the genu of the corpus callosum with advancing age. 22 The regional basis of age-related alterations in prefrontal WM was noticed using DTI, and the results revealed that much of prefrontal WM showed a reduced FA with increasing age and obtained a significant correlation between prefrontal WM anisotropy and prefrontal WMV for the participants aged over 40 years. Thus, regionally accelerated alterations in prefrontal WM with aging illustrated FA's potential as a microstructural index of volumetric measures.23,24 Another study showed the regional reduction in FA with aging in the whole brain. The results revealed that cerebral hemisphere, hippocampus, frontal lobe, corona radiata, corpus callosum, and internal capsule have decreased FA, and there was a strong negative correlation between age and FA in frontal lobe, hippocampus, and cerebral hemisphere, whereas there was a weaker negative correlation between corona radiate, corpus callosum, and internal capsule. 25
The characterization of WM structural changes at the tract level, tract group (limbic, commissural, association, and projection tracts) level, and comprehensive analysis was done with four metrics (FA, MD, AD, and RD) derived from DTI. 26 The changes in FA were mapped for 11 major cerebral WM tracts; pointing tracts that reach their peak FA values later in life also showed progressively higher age-related decline than earlier maturing motor and sensory tracts. 27 In healthy aging, the trajectories of FA of cerebral WM and thickness of cortical gray matter have been reported as quadratic with age, but the relationship between them was found linear, indicating that a putative biological mechanism may explain the nonlinearity of their age trajectories. 28
Although there are studies focused on WM diffusivity in healthy children, young aged (<40 years), older adults (>60 years), none of the studies reported the relationship between WMV and WM integrity indices. Also there are some concerns about methodological limitations, such as image resolution in DTI acquisition and DTI software or statistical discrepancies in estimating diffusion indices due to unequal number of subjects in each age group and gender. Nonetheless, it is necessary to understand relationship between the WM diffusivity indices and structural WMV in healthy aging specifically during the transition state from young-to-middle age or middle-to-old age. To overcome these limitations in existing studies, we aim to study the relationship between WM diffusion indices and WMV among three age groups (young, middle, and old) along with voxel-wise analysis of FA, MD, AD, and RD values calculated using tract-based spatial statistics (TBSS) and global WMV estimated from voxel-based morphometry (VBM).
Subjects and Methods
Dataset
Summary of demographic information of the subjects.
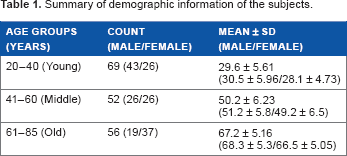
Image acquisition
T1-weighted magnetization prepared rapid acquisition gradient echo sequence and DTI scans were acquired using Philips Intera 3T scanner. Acquisition parameters for T1-weighted MRI scans were as follows: TR/TE = 9.6/4.6 ms, number of phase encoding steps = 208, echo train length = 208 ms, reconstruction diameter = 240 cm, acquisition matrix = 208 × 208, and flip angle = 8°. Single-shot echo-planar diffusion images comprised 15 diffusion-weighted volumes with gradient encoding applied in 15 noncollinear directions (
Image processing
The processing pipeline was divided into two levels: T1-weighted MR image processing (using VBM) and DT image processing (using FMRIB software library [FSL]) as shown in Figure 1. VBM was performed on high-resolution T1-weighted structural images for tissue segmentation
29
using Statistical Parametric Mapping (SPM8)
30
software implemented in MATLAB 2010. Initially, T1-weighted MR images of subjects were segmented in native space into different tissue types, such as WM (c1), gray matter (c2), and cerebrospinal fluid (c3). Later a built-in SPM function (SPM_get_volume) was executed to acquire global WMV. The normalization of WMV was done by correction of intracranial volume.
Processing pipeline depicting our methodology. Right: T1-weighted MR images undergo segmentation (white matter, gray matter, and CSF) and volumetric calculation through SPM and VBM followed by statistical analysis. Left: Diffusion indices (FA, MD, RD, and AD) are extracted from DTI images through FDT toolbox followed by volumetric calculation. On the other side, diffusion maps are subjected to TBSS for voxel-wise statistical analysis.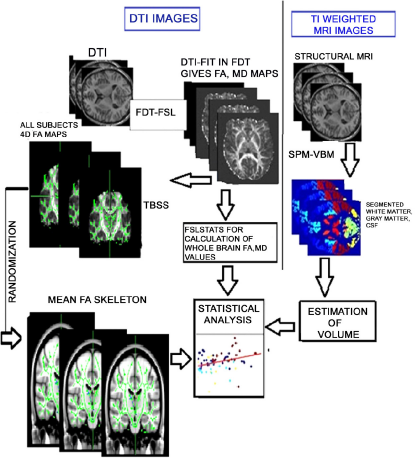
DTI analyses
DTI data were processed using FSL. 31 Initially, DT images (15 direction) obtained for each subject were merged to form a single four-dimensional DT image, which was corrected for head movement and eddy current distortions using FDT's (FMRIB's Diffusion Toolbox) Eddy correct. The eddy-corrected image was then passed through the FSL Brain Extraction Tool to extract the brain and exclude skull, scalp, and other nonbrain tissues. The output of Brain Extraction Tool generated a binary brain mask, which was further used as an input file for the next step, ie, DTIFIT. Finally, DTIFIT was used to fit diffusion tensor model at each voxel, with the brain mask limiting the fitting of tensors to brain space. The output of DTIFIT yielded voxel-wise maps’ eigenvalues (L1, L2, and L3), FA, AD (L1), RD (average of L2 and L3), and MD. The threshold value of 0.2 is used in FSL stats for computing FA in single subject to see the prominent tracts.
Tract-based spatial statistics
Voxel-wise statistical analysis of diffusion indices was carried out in TBSS 32 implemented in FSL. In TBSS, between-group skeleton-wise statistical analysis was performed for diffusion indices. Initially, FA image of each subject undergo nonlinear registration to a standard FMRIB58_FA template followed by affine transformation into MNI152 1 mm3 standard space resulting in a transformation of the original FA image into MNI152 space. All these are merged into a single four-dimensional image of all FA, and the mean of all FA images gives mean FA image. This mean FA image was used to generate a WM skeleton that identifies the center of WM tracts shared by all subjects. Mean FA skeleton was threshold to 0.2 to include the major WM pathways but exclude intersubject variability regions and partial volume effects. Each subject's prealigned FA image was registered to the mean FA skeleton, and then resulting skeletonized FA data undergo voxel-wise statistics that includes comparisons of FA among three age groups. This between-group test uses randomized tool to see significance at each voxel against a null distribution generated from 5000 random permutations of group membership. The significant WM clusters were identified with reference to the atlas tool JHU ICBM-DTI-81 WM labels. Later, other diffusion indices underwent TBSS using the FA images to achieve the nonlinear registration and skeletonization stages. Also, FA images are used to estimate the projection vectors from each individual subject onto the mean FA skeleton.
Statistical analysis
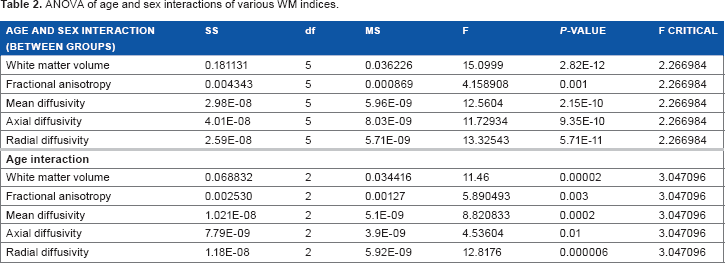
Age-related and gender-related statistical analysis for WMV and all the four diffusion indices was estimated between groups using nonpaired parametric group analysis of variance (ANOVA) with post-hoc pair-wise Bonferroni correction. Graphical representation of above analysis includes box plots in which boxes represent the lower and upper quartiles (blue solid lines) and the median measurement (red line) for each group. Whiskers indicate the sample minimum and maximum, whereas the represented outliers (dots) differ from the lower and upper quartiles by more than 1.5 times the interquartile range. For gender-related differences, the intergroup and within-group differences were represented by column graphs, and statistical analysis was performed using ANOVA. The correlation analysis between WMV and different diffusion indices is performed, and statistical analysis for regression is done using linear model.
Results
Age-related trends for various WM diffusivity indices
The results of age-related changes along with the whole-brain values of FA, MD, AD, and RD are shown in Figure 2. Box plot analysis indicates that the global WMV followed a similar trend of volume decline across an age range of 20–85 years. FA showed decline with age among the three age groups. Also MD, AD, and RD showed the same increasing pattern with age. In younger and middle age groups, the mean value remains in same range, whereas in old age group, there is an inflate increase in values of MD, AD, and RD.
Box plots of whole-brain white matter volume, fractional anisotropy, mean diffusivity, radial diffusivity, and axial diffusivity in three age groups.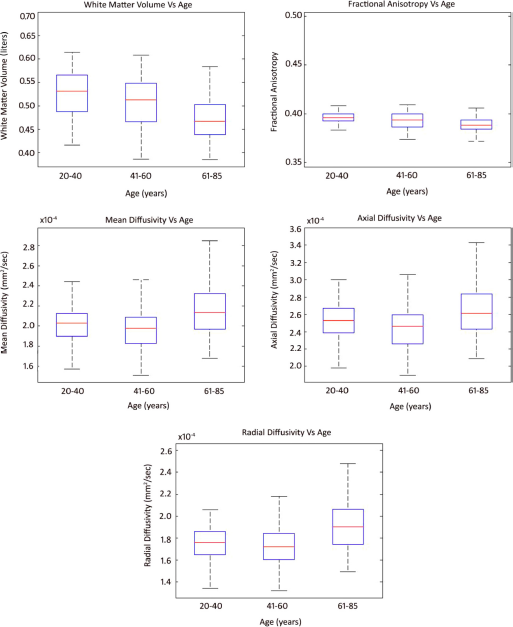
ANOVA of age and sex interactions of various WM indices.
Gender differences
The overall gender differences for WMV and diffusion indices are shown in Figure 3. The analysis revealed that the global WMV, FA, and MD (
The gender-based within-group and intergroup differences are summarized in Figure 4. In young adults, the global values of AD and MD ( Box plots showing overall gender differences with whole-brain white matter volume, fractional anisotropy, mean, radial, and axial diffusivities. Column graphs showing within-group gender differences and intergroup differences of male and female with whole-brain white matter volume and each diffusion index. The standard errors are shown with black band above the columns.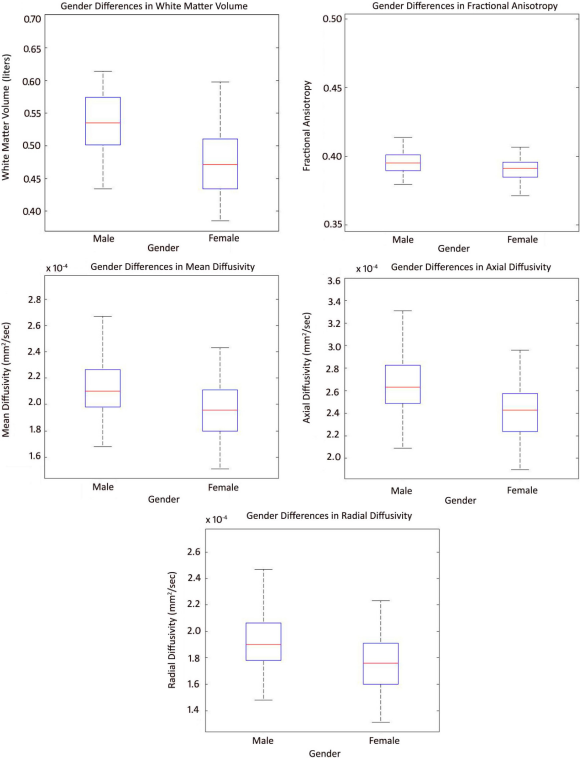

The intergroup differences for male subject's WMV and diffusion indices measures revealed that in young- vs middle-aged adults, no statistically significant differences were found for the global values of WMV, FA, MD, AD, and RD. However, there were statistically significant differences in middle- vs old-aged adults for the global values of WMV and RD (
Measures revealed that in young- vs middle-aged adults, statistically significant differences were found in the global values of WMV (
Intergroup voxel-wise statistics of FA
The between-group voxel-wise analysis revealed a significant decrease in FA in certain regions based on the TBSS voxel-wise statistics represented by color magnets superimposed on the mean FA skeleton in red–yellow color as shown in Figure 5, and MNI coordinates are summarized in Table 3.
Statistical maps showing white matter clusters (red) where FA was significantly greater in young-aged > middle-aged adults, middle-aged > old-aged adults, old-aged > young-aged adults. White matter clusters showing significant greater values of FA among three age groups.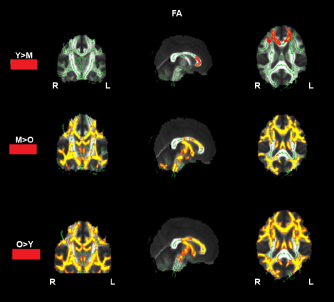
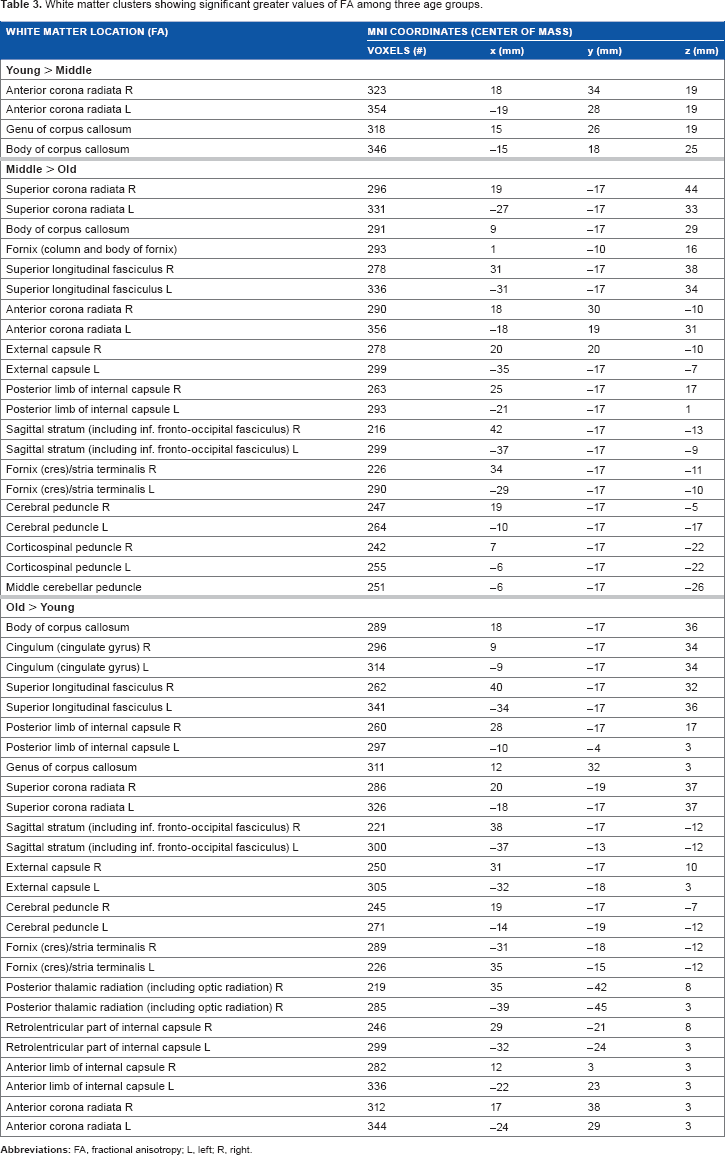
TBSS analysis showed an increase in FA (young > middle) in four regions, including superior corona radiata R, superior corona radiata L, body of corpus callosum, and genus of corpus callosum (
However, we notice some regions, such as genu of corpus callosum, external capsule, and fornix, showed increase values of AD and RD in old-aged group compared to young- and middle-aged groups. Similarly, we notice AD decrease in anterior/superior corona radiata, left cerebral peduncle, and retrolentricular part of internal capsule in old-aged group compared to young- and middle-aged groups and RD increase in anterior pericallosal, anterior/superior corona radiata (L), cerebral peduncle (L), and retrolentricular part of internal capsule (L) in young- and middle-aged groups compared to old-aged group.
Regression analysis between WMV and diffusion indices
Scatter plots and the results for regression analysis for WMV and diffusion indices (FA, RD, MD, and AD) using GLM are summarized in Figure 6. We noticed good correlation between global MD, AD, RD values, and WMV and poor correlation with FA in all the age groups with statistical significance Scatter plots of the whole-brain values of each diffusion index vs Whole-brain white matter volume.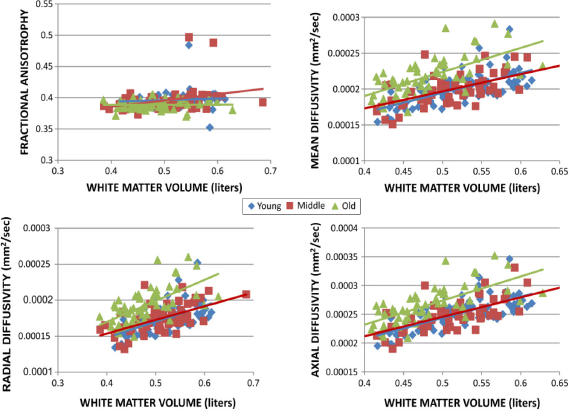
In young adults, there was good correlation (
Discussion
The underlying mechanism in myelination processes that lead to alterations in WM anisotropy with age is poorly understood. Till date, studies have reported changes in fiber orientation that in turn affects WM anisotropy, but they did not noticed the association of WM anisotropy and microstructural diffusion parameters with T1-weighted WMV.
Global changes with age
Our results are consistent with earlier studies that have shown a decline in WMV with aging.16,33 We noticed a significant decrease in WMV as aging occurred with no significant change in young- and middle-aged groups when compared to old-aged group. The quantitative global estimates of FA, MD, AD, and RD in three age groups, namely young-, middle-, and old-aged adults, were estimated. Our results showed similar pattern of a significant increase in MD, AD, and RD values in old-aged group when compared to young- and middle-aged group and no significant change in young-aged group when compared to middle-aged group. These results were consistent with earlier studies suggesting an age-related decline in the composition and integrity of WM.34–39 On the other hand, FA showed a significant decrease in old-aged group compared to young-and middle-aged groups; however, no significant change was observed in the middle-aged group when compared to young-aged group. The decrease in FA with aging is consistent with previous studies.22,40–42 This decline may be due to an increase in the water diffusion in the direction perpendicular to the directions of WM fibers.43,44 This may have implications for degeneration of the myelin sheath (demyelination) and recently showed the role of apolipoprotein with WM integrity in memory decline. 45
There are some methodological issues in group-level analysis of DTI for examining the differences in WM anisotropy development during aging process. In order to solve the important issues of cross-subject data alignment, performing localized cross-subject statistical analysis, we used TBSS. Tract-based spatial statistics method works by transforming the data from the center of the tracts that are consistent across all the subjects into a common space. Till date, studies have reported the changes of FA values in young-and middle-aged groups and young and old-aged groups.19,23 The skeleton-wise between-group test for FA showed significantly higher FA values in young-aged group compared to middle-aged group specifically in anterior corona radiata and corpus callosum. This study reported the changes of FA values in transition from young- to middle-aged groups and middle- to old-aged groups. Analysis revealed higher FA values in middle-aged group when compared to old-aged group in 22 regions. Our analysis suggests lower FA values in older group compared to younger group in 26 WM clusters, suggesting that the integrity of WM connections degrade with age. Also, a decrease in FA is associated with a significant increase in both RD and AD,19,46–49 and some of these changes of RD and AD are reported in earlier studies in superior corona radiata, 50 corpus callosum,37,38 superior longitudinal fasciculus,38,48 external capsule,44,48,50 fornix,48–51 sagittal striatum, 50 retrolentricular part of internal capsule, 50 and anterior/superior corona radiata. 44
Gender differences
The gender-related effects on global WM and diffusivity measures are unclear, ie, some studies reported no gender differences52,53 and showed a significant gender differences.14,48,55,56 Few volumetric studies reported the life-span changes of the human brain WM.57,58 We notice statistically significant increase in the values of WMV, FA, MD, and AD for males compared to females, which was in agreement with the previous studies.14,20 The gender differences in FA for male subjects can be explained with three eigenvalues (λ1, λ2, and λ3) analysis, which stated that these changes are due to an increase in λ1 but no significant change in diffusion perpendicular to the fiber tract orientation (eg, λ2 and λ3). While analyzing within-group gender differences, we noticed a significant increase in AD values of males across three age groups, suggesting an increase in diffusion parallel to fiber orientation rather than perpendicular direction. Within-group changes for male and female subjects were similar, ie, a gradual decline in WMV and a gradual increase in the values of MD, AD, and RD across three age groups. FA shows different pattern in males and females. In males, FA shows quadratic trajectory (inverted-U) and linear decrease in females across three age groups. Another recent study also reported that the aging effects during transition from young-to middle-aged groups were associated with more dispersion of WM fibers, while the tissue restriction and intraaxonal volume fraction remained relatively stable. 59
Relationship between global WM and various diffusion indices
Our findings of age-related decline in FA with age and relationship among FA and other structural indices of cerebral health are consistent with some earlier studies. It was first report utilization of FA as an index of declining WM health in normal healthy aging. 54 These reports were followed by other studies with similar findings regarding change in FA with age.22,41 All these studies interpreted their findings of age-related decline in cerebral FA as an indication of mild demyelination and/or axonal loss. These findings may reflect the fact that even small changes with age in myelin and fiber tract density result in a higher signal change for both FA and WM density. The changes in axonal diameter and density presumably affect both WM density and anisotropy values. Hence, our special focus was to notice differences in age-related trends along with the relationship of WMV with WM integrity indices. We found good correlation between all the WM integrity indices and WMV except for FA.
Strengths and limitations of this study
The strengths of the present study is the use of the native space for each participant, which allowed us to maximize neuroanatomical validity and to avoid the misregistration, segmentation, and smoothing errors that can occur in automated or semiautomated techniques as well as other limitations of voxel-based methods that may be especially apparent in aging brains.52,60 However, manual methods limit the choice of regions to a priori hypothesized selections, and hence, we chose TBSS. Another potentiality of this study is that we have almost significant gender sample size in all the three age groups; however, the demerits are more number of males in young-aged group and more females in old-aged groups. We found significant sex differences in FA, MD, and RD but not in AD. Furthermore, the statistical trends found in the large sample data analyses revealed few additional structure–function associations. The present study relied on data that were acquired on a single 3-T MRI scanner with TBSS implementation of the DTI analyses. However, the proposed approach will be applicable for multiple scanners, and application of new advances in DTI methods may reveal findings that were missed in earlier studies. However, the limitation of this study is the implementation of the cross-sectional data that limits to estimate and assess the age-related life-span changes and differences.
Conclusions and Future Scope
We estimated global WMV, FA, MD, AD, and RD of WM integrity in three healthy age groups. We analyzed the volumetric relationship of WMV with normal aging and also relationship of measures of WM integrity using TBSS, such as FA, MD, AD, and RD, maps with aging as well as WMV. From this study, we noticed a significant decrease in FA in four regions for middle-aged group compared to young-aged group, in 22 regions for old-aged group compared to middle-aged group, and in 26 regions for old-aged group compared to young-aged group. Another finding is the inverted-U-shaped relationship for whole-brain FA values with age and increase trend of MD, RD, and AD with aging. Also, we notice that there is a decrease in WM, FA, MD, AD, and RD in females compared to males. Thus, this study helps understand the differential relationship between microstructural integrity and WMV as the human brain undergoes normal aging and gives the reasons for this highlighting age-dependent atrophy and sheds light on the differential value of various complementary imaging techniques in the assessment of brain aging. In future, we plan to extend the findings presented here. However, the data analyses of entire dataset containing different MRI scanners at other two centers will provide more accurate information as to the nature of WM changes in life-span aging. Also, it is important to delineate the laterality differences that may play a significant role in diffusivity as aging.
Author Contributions
Conceived and designed the experiments: RR, VPSR, PKR. Analyzed the data: RR, VPSR. Wrote the first draft of the manuscript: RR, VPSR, PKR. Contributed to the writing of the manuscript: RR, VPSR, PKR. Agree with manuscript results and conclusions: RR, VPSR, PKR. Jointly developed the structure and arguments for the paper: RR, VPSR, PKR. Made critical revisions and approved final version: RR, VPSR, PKR. All authors reviewed and approved of the final manuscript.
Footnotes
Acknowledgments
We extend appreciation to the facilities of National Brain Research Centre for enabling this work.