
Abstract
Background
Multiple sclerosis (MS) is an important cause of acquired neurological disability in young adults, characterized by multicentric inflammation, demyelination, and axonal damage.
Objective
The objective is to investigate white matter (WM) damage progression in a Brazilian MS patient cohort, using diffusion tensor imaging (DTI) post-processed by tract-based spatial statistics (TBSS).
Methods
DTI scans were acquired from 76 MS patients and 37 sex-and-age matched controls. Patients were divided into three groups based on disease duration. DTI was performed along 30 non-collinear directions by using a 1.5T imager. For TBSS analysis, the WM skeleton was created, and a 5000 permutation-based inference with a threshold of p < .05 was used, to enable the identification of abnormalities in fractional anisotropy (FA), mean diffusivity (MD), radial diffusivity (RD), and axial diffusivity (AD).
Results
Decreased FA and increased RD, MD, and AD were seen in patients compared to controls and a decreased FA and increased MD and RD were seen, predominantly after the first 5 years of disease, when compared between groups.
Conclusion
Progressive WM deterioration is seen over time with a more prominent pattern after 5 years of disease onset, providing evidence that the early years might be a window to optimize treatment and prevent disability.
Keywords
Introduction
Multiple sclerosis (MS) is an important cause of acquired neurological disability in young adults, characterized by multicentric inflammation, demyelination, and axonal damage. 1 MS affects over than 2.5 million people worldwide. The average age at onset is 30 years old and prevalence according to geographic distribution and ethnicity. The frequency of MS in Brazil is 1.36/100,000 to 27.2/100,000 inhabitants and the Brazilian Multiple Sclerosis Association (ABEM) estimates that there are 35,000 Brazilians currently living with the disease.2,3
Early diagnosis of MS was impacted by the inclusion of biomarkers (BMs) as oligoclonal bands (OCBs) and magnetic resonance imaging (MRI) criteria, considered an “in vivo” biomarker. MRI is an established tool to support the diagnosis of MS and to look for atypical radiological features that challenge this diagnosis. MRI of the brain and spinal cord remains the most useful paraclinical test to aid in the diagnosis and follow-up of patients with MS. 4 Over the past two decades, several MRI techniques have been developed and applied to better understand the natural history of MS. These are aimed at improving the poor correlation between conventional MRI measures and clinical disability, such as diffusion tensor imaging (DTI), magnetization transfer ratio, measures of atrophy,5,6 and functional MR images 7 among others. These quantitative techniques are more sensitive than conventional MRI for gray matter (GM) and white matter (WM) damage found outside focal white matter lesions. 8 By using echo-planar MRI sequences with diffusion-weighted magnetic field gradients applied in different directions, DTI enables the random diffusional motion of water molecules to be measured thus providing metrics such as mean diffusivity (MD) and fractional anisotropy (FA), which are sensitive to the size and geometry of water-filled spaces. 9 WM damage is mainly reflected by a decrease in FA and an increase in MD (which consists of axial diffusivity [AD] and radial diffusivity [RD], measuring diffusivity parallel and perpendicular to the main axis of WM tracts, respectively). RD is modulated by myelin in WM, whereas AD is more specific to axonal degeneration.10–12 The majority of previous studies assessing DTI findings in MS have evaluated MRI by using a region-of-interest–based analysis. However, this method is subjective and necessarily hypothesis driven. Since its appearance in the literature in 2006, 13 tract-based spatial statistics (TBSS) analysis (https://fsl.fmrib.ox.ac.uk/fsl/fslwiki/TBSS) has been applied to multisubject spatial analysis of DTI data.13–19 It is an observer-independent and hypothesis-free method that provides the ability to spatially localize group differences in the DTI data. Registration error and personal bias are minimized because this technique projects all the FA, MD, RD, and AD data from each subject onto a voxelized skeleton located within the centers of the large cerebral white matter pathways through the brain. 20
The importance of TBSS analysis of MS patients was established by studies that demonstrated the correlation of changes in DTI parameters with increased EDSS disability, lower cognitive performance, and specifically for processing speed, visual, and verbal working memory.14,15 However, studies assessing a group of patients at different stages of the disease course are scarce. The aim of this retrospective cross-sectional study is to describe patterns of WM damage progression in a Brazilian relapsing-remitting multiple sclerosis (RRMS) patient’s cohort, using DTI post-processed by TBSS.
Materials and methods
Subjects
Patients and controls were obtained from the databases of the Department of Neurology and Radiology from the University Hospital of Federal University of Rio de Janeiro. Patients were included if (a) they met the current standard clinical diagnosis for relapsing remitting MS by McDonald 4 ; (b) were between the ages of 18 and 70 years, regardless of sex; and (c) no limit on duration of disease, frequency of recurrence or Expanded Disability Status Scale scores. 21 Patients excluded from this study were those (a) without the necessary advanced MR imaging sequences for the study (DTI in 30 directions); (b) with ferromagnetic or motion artifacts that could mislead the post-processing of images; (c) on corticosteroid therapy or with an acute relapse in the 8 weeks prior to the MRI study; and (d) exposed to high efficiency disease-modifying treatment (heDMT). Healthy controls (those without neurological or psychiatric disorders) were identified within the same databases and matched with patients in terms of age and gender. The hospital’s institutional review board approved the study, and all subjects gave written informed consent.
MR imaging acquisition
MR imaging was performed with a 1.5-T imager (Avanto; Siemens, Erlangen, Germany) by using an 8-channel phased-array head coil. The conventional MR imaging protocol included a coronal T2-weighted sequence (repetition time 3700/102 msec/echo time msec, 220 mm field of view, 216 × 320 matrix, and 1 mm section thickness with a 10% gap), a sagittal three-dimensional fluid-attenuated inversion recovery sequence (5000/418, inversion time of 2500 msec, 260 mm field of view, 218 × 256 matrix, and 3 mm section thickness), and an axial T1-weighted sequence with magnetization transfer before and after intravenous contrast material administration (606/9, 230 mm field of view, 288 × 512 matrix, and 5 mm section thickness with 35% gap). All measurements, with the exception of the T1-weighted magnetization transfer precontrast sequence, were acquired after administration of 0.1 mmol per kilogram of body weight of gadopentetate dimeglumine contrast medium (Schering, Berlin, Germany). Diffusion-weighted single-shot echo-planar imaging was performed by following the parameters suggested by Smith et al., 22 with bipolar diffusion gradients applied along 30 non-collinear directions (B = 0 and 900 s/mm2; 9500/87, 122 × 122 matrix, field of view of 230 mm, 73 sections with 2 mm section thickness and no gap, one signal acquired).
DTI analysis
For voxelwise diffusion modeling (TBSS), diffusion data were analyzed by using the Diffusion Toolbox within FSL software (FMRIB Software Library, version 5.0), Oxford Centre for Functional Magnetic Resonance Imaging of the Brain, or FMRIB, http://www.fmrib.ox.ac.uk/fsl) 22 (T.D., 16 years of experience in medical physics; R.S.C., 7 years of experience in neuroradiology; and F.C.R.L., 19 years of experience in neuroradiology). After eddy current correction and brain extraction were performed, FA, MD, RD, and AD images for all subjects were created by fitting a tensor model into the raw diffusion data. Voxelwise statistical analysis of the FA data was performed by using the TBSS module of FSL, version 5.0. 22 FA data from all subjects were aligned into a common space by using the nonlinear registration tool (FNIRT),17,18 which uses a B-spline representation of the registration warp field. Next, the mean FA image was created and thinned to generate a mean FA skeleton, which represents the center of all tracts common to the group. Each subject’s aligned FA data were then projected onto this skeleton, and the resulting data were fed into voxelwise cross-subject statistics for all voxels. The FA threshold was 0.30 or less, with the intention of excluding peripheral tracts where substantial intersubject variability and/or partial volume effects with gray matter exist.
By applying the original nonlinear registration of each subject’s FA to standard space, the MD, RD, and AD were also projected onto the mean FA skeleton. These data were used to calculate voxelwise cross-subject diffusion statistics. To illustrate the alterations, three-dimensional reconstructions of the corrected P maps of FA, MD, RD, and AD were computed and visualized.
Lesion maps
T2 hyperintense lesion volume measurements were performed on fluid-attenuated inversion recovery (FLAIR) images by using a semi-automated local thresholding contouring technique (Jim 4.0, Xinapse System, Leicester, UK. http://www.xinapse.com/) by a neuroradiologist (R.S.C. 5 years of experience in neuroradiology).
Statistical analysis
To determine FA, MD, RD, and AD, we performed a voxelwise fashion using FSL’s randomize tool, which combines general linear model testing with permutation inference statistics. A threshold-free cluster enhancement with a threshold of p less than 0.05, corrected for multiple comparisons, was used. Corrected threshold-free cluster enhancement p value images were computed to enable the identification of differences in the FA, MD, RD, and AD between patients and healthy control subjects and between patients groups (T.D., R.S.C., and F.C.R.L.). p less than 0.05 was considered to indicate a statistically significant difference and p less than 0.1 was considered a trend. The Kolmogorov–Smirnov test of normality was used to ensure that variables like age, disease duration, and lesion load have a normal distribution. Lesion load between groups was also compared using ANOVA. All analyses were performed with IBM-SPSS version 20 (Chicago, IL, USA). A p<.5 was considered statistically significant.
Results
Demographic variables of the studied population.
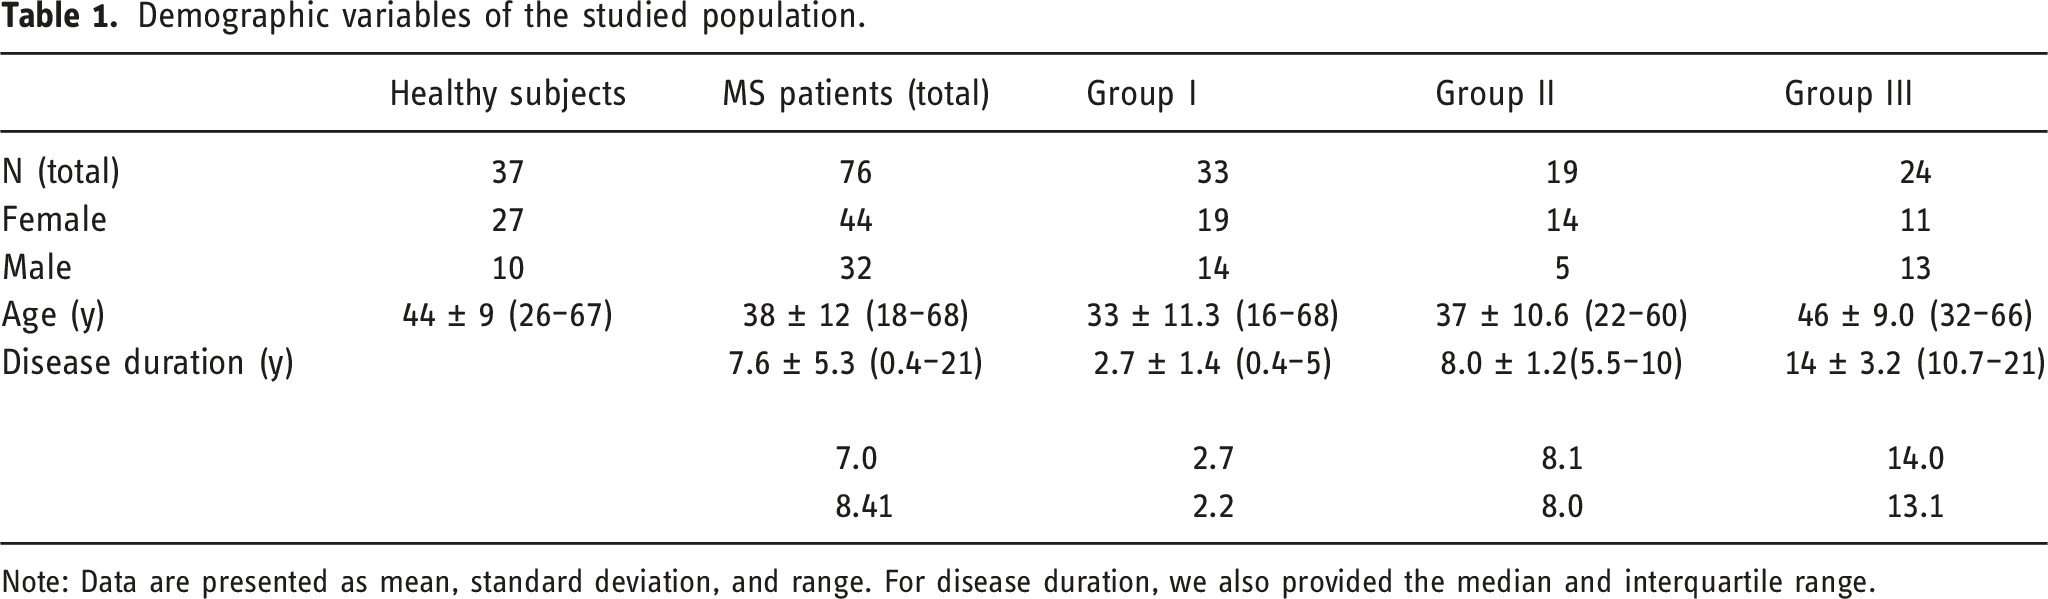
Note: Data are presented as mean, standard deviation, and range. For disease duration, we also provided the median and interquartile range.
Comparison between patients and control subjects
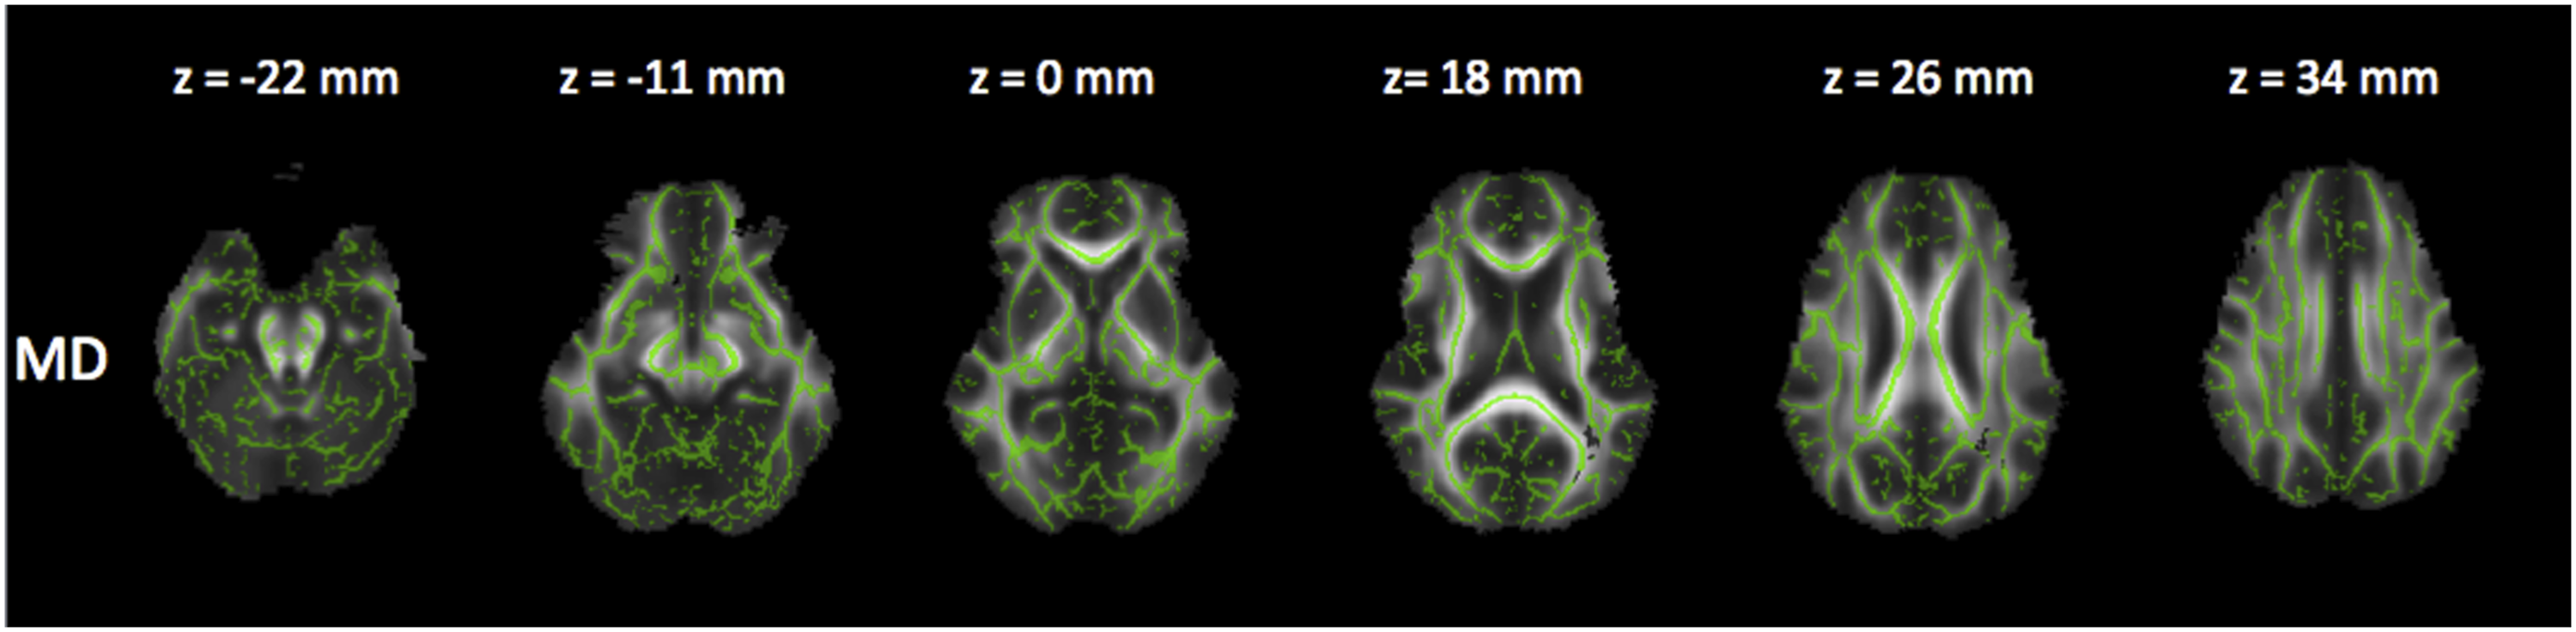
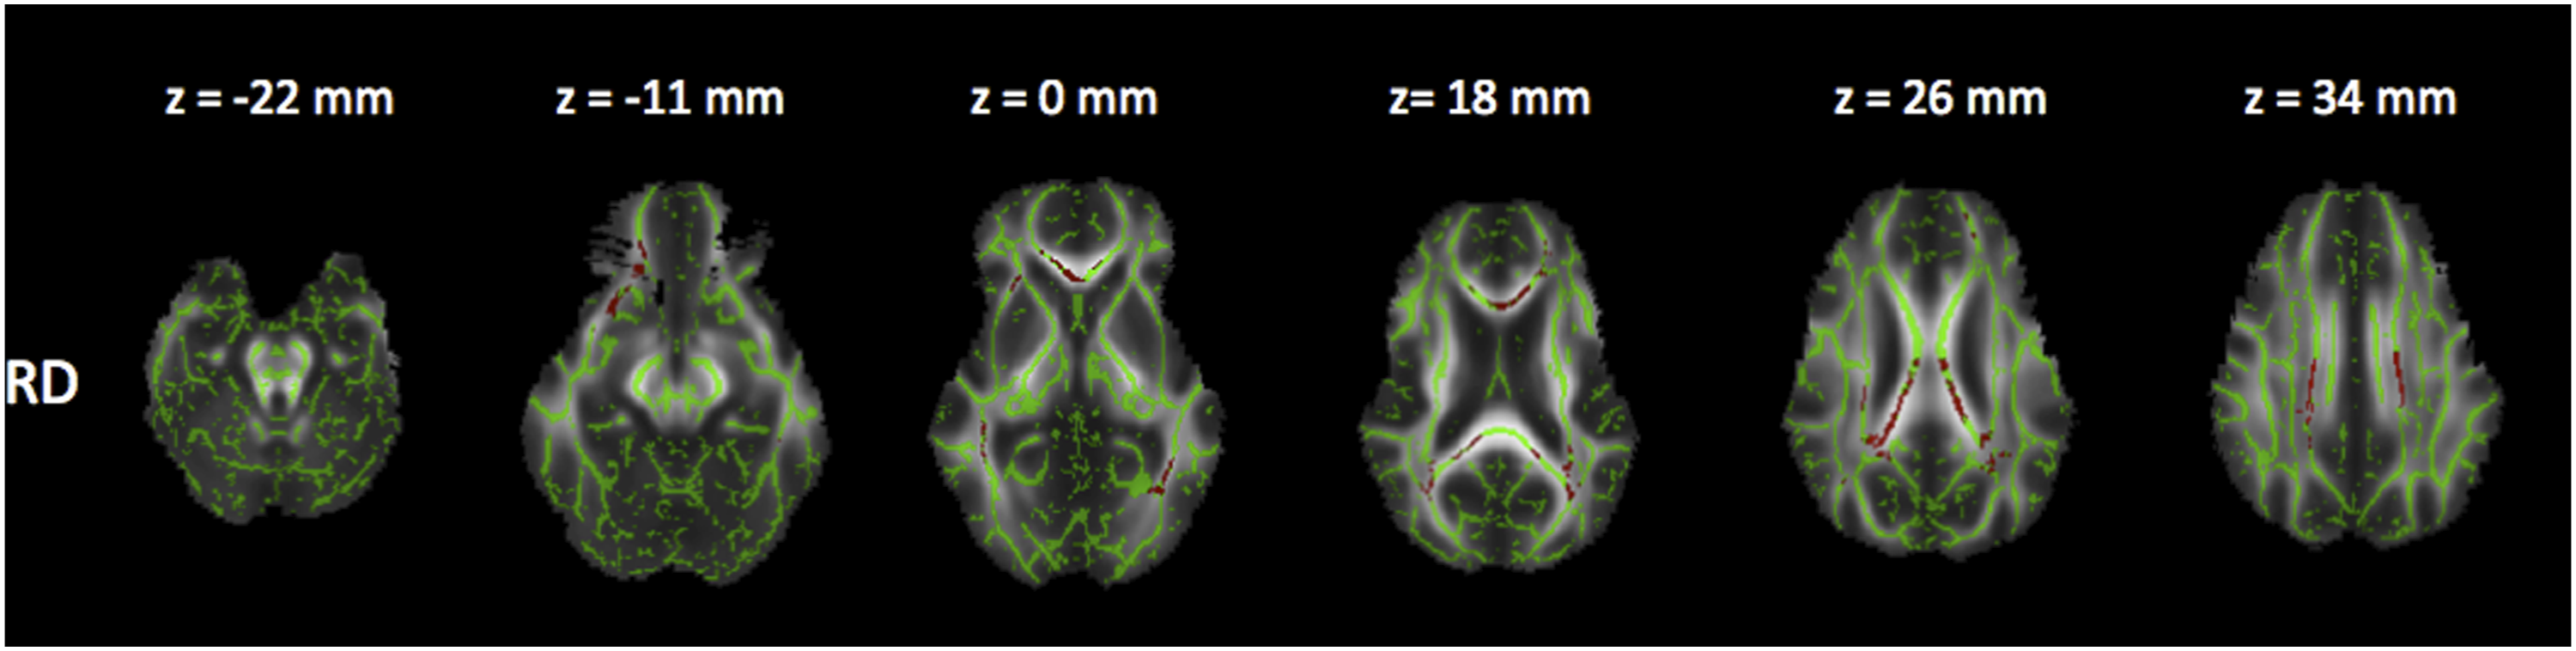
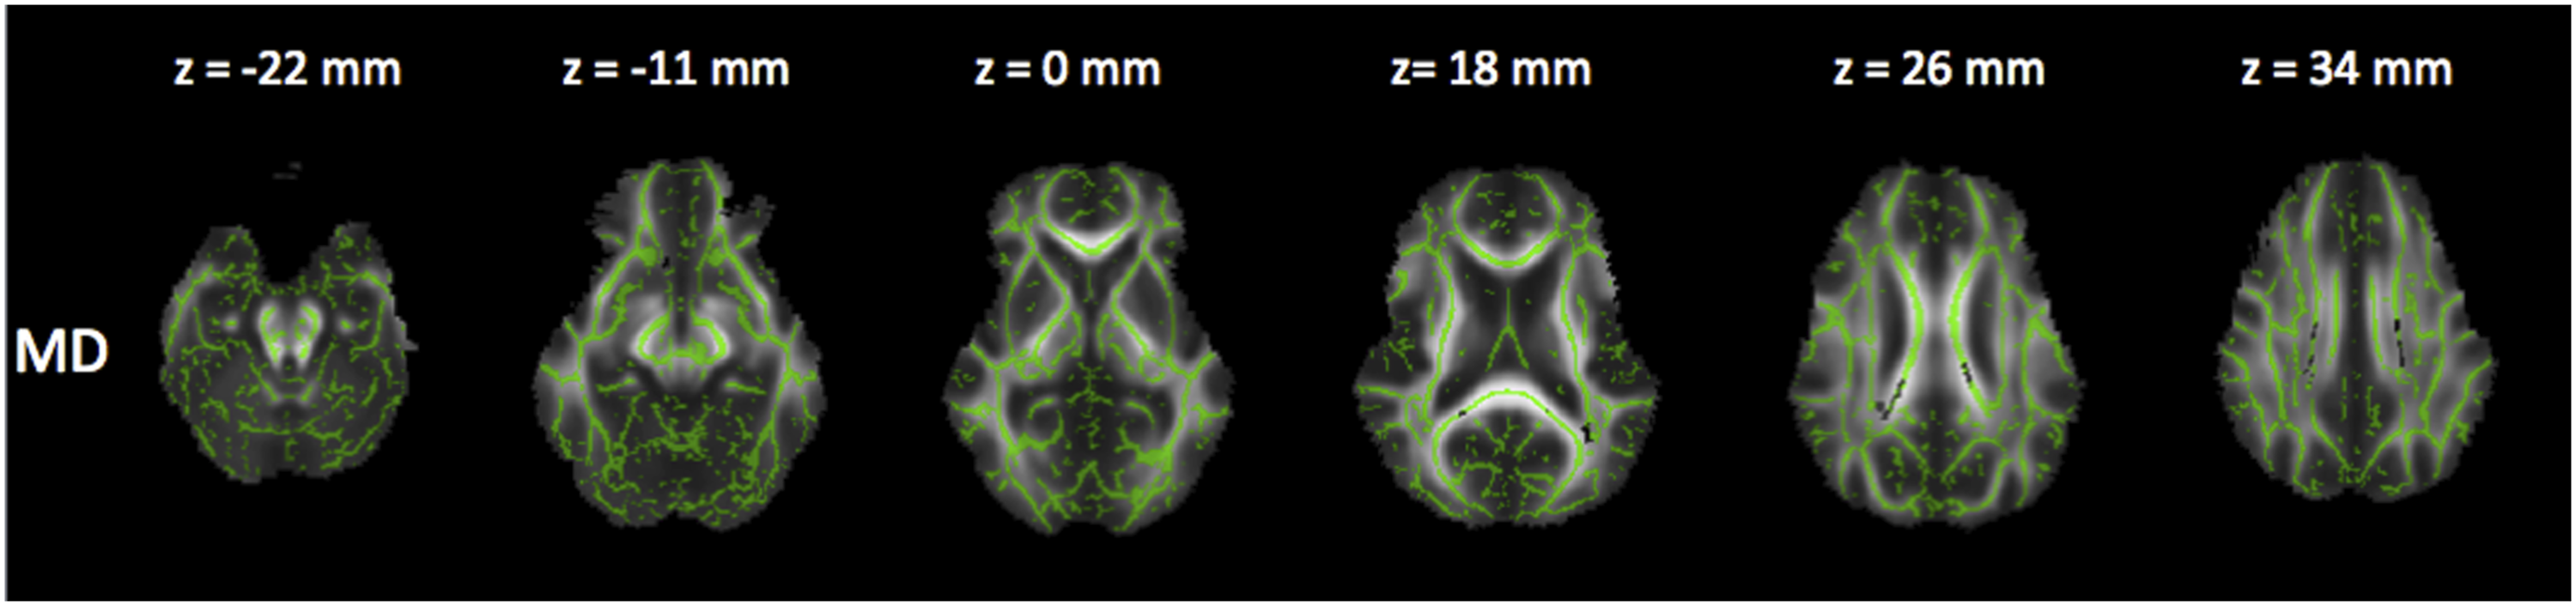
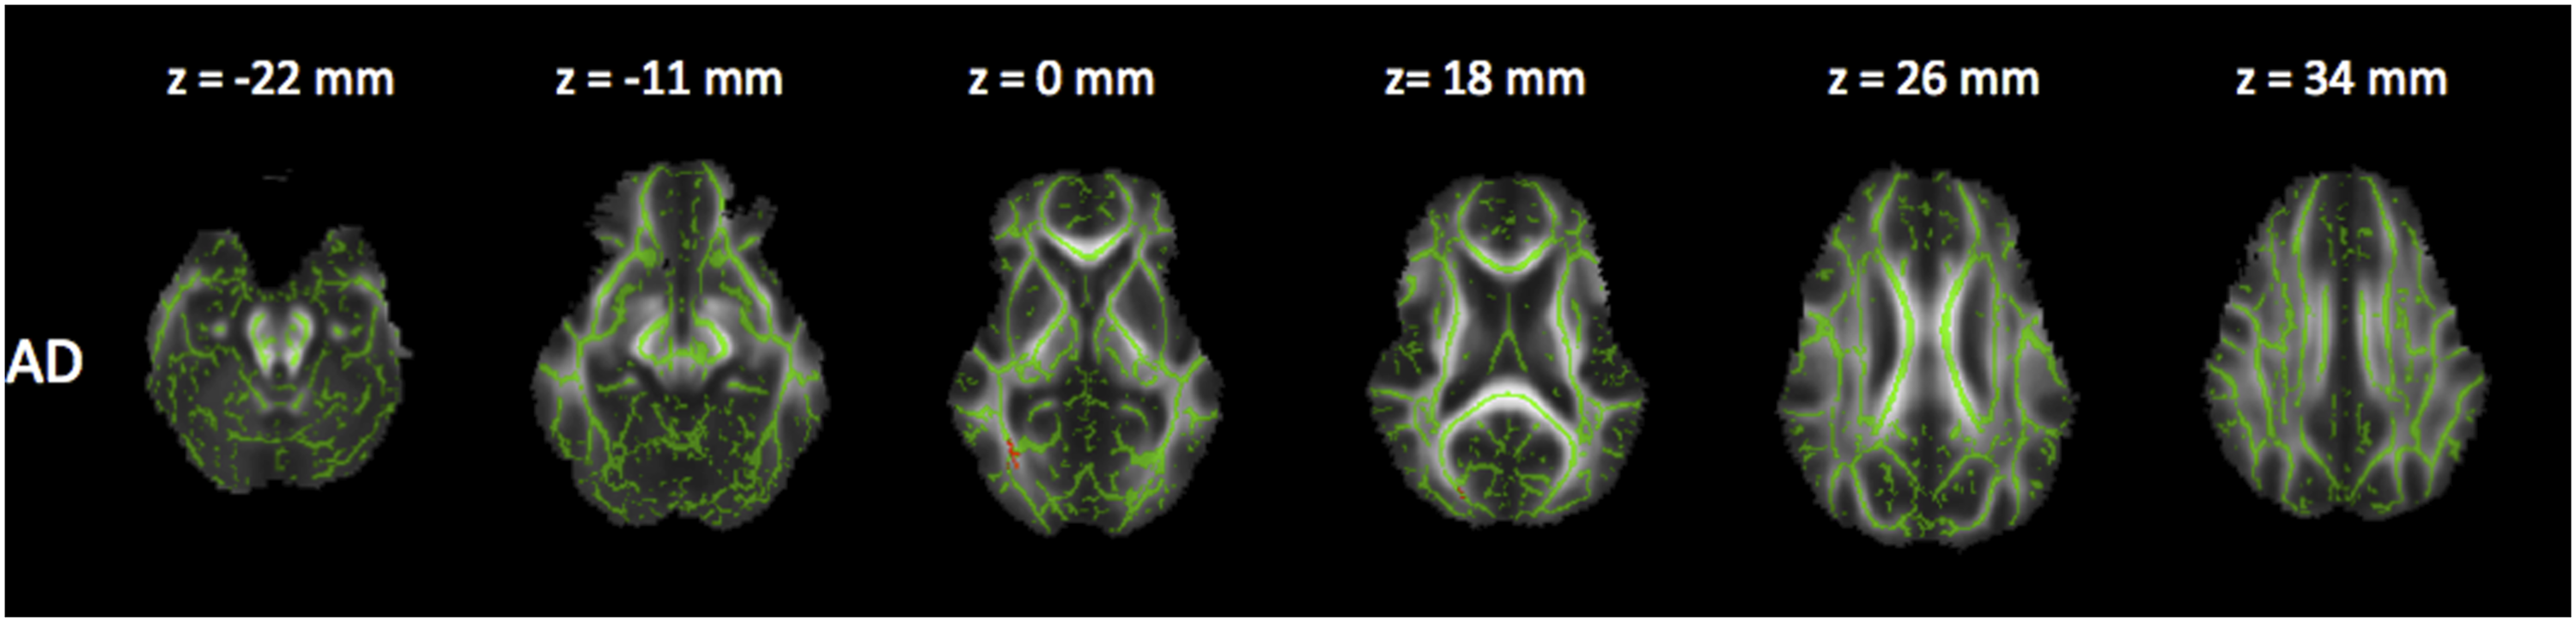
In the voxelwise-based group comparison, multiple white matter areas with significantly decreased FA and increased RD, AD, and MD (p < .05) were found in patients with MS compared with control subjects (Figure 1). Potentially, there was a significant influence of groups II and III (more than 60 months of disease) on the results. Corrected P maps (p < .05). These maps show the regions where FA (decreased in the blue/light blue voxels), AD (increased in the yellow/orange voxels), RD (increased in the red voxels) and MD (increased in the grey voxels) were significantly different between patients with MS and control subjects. 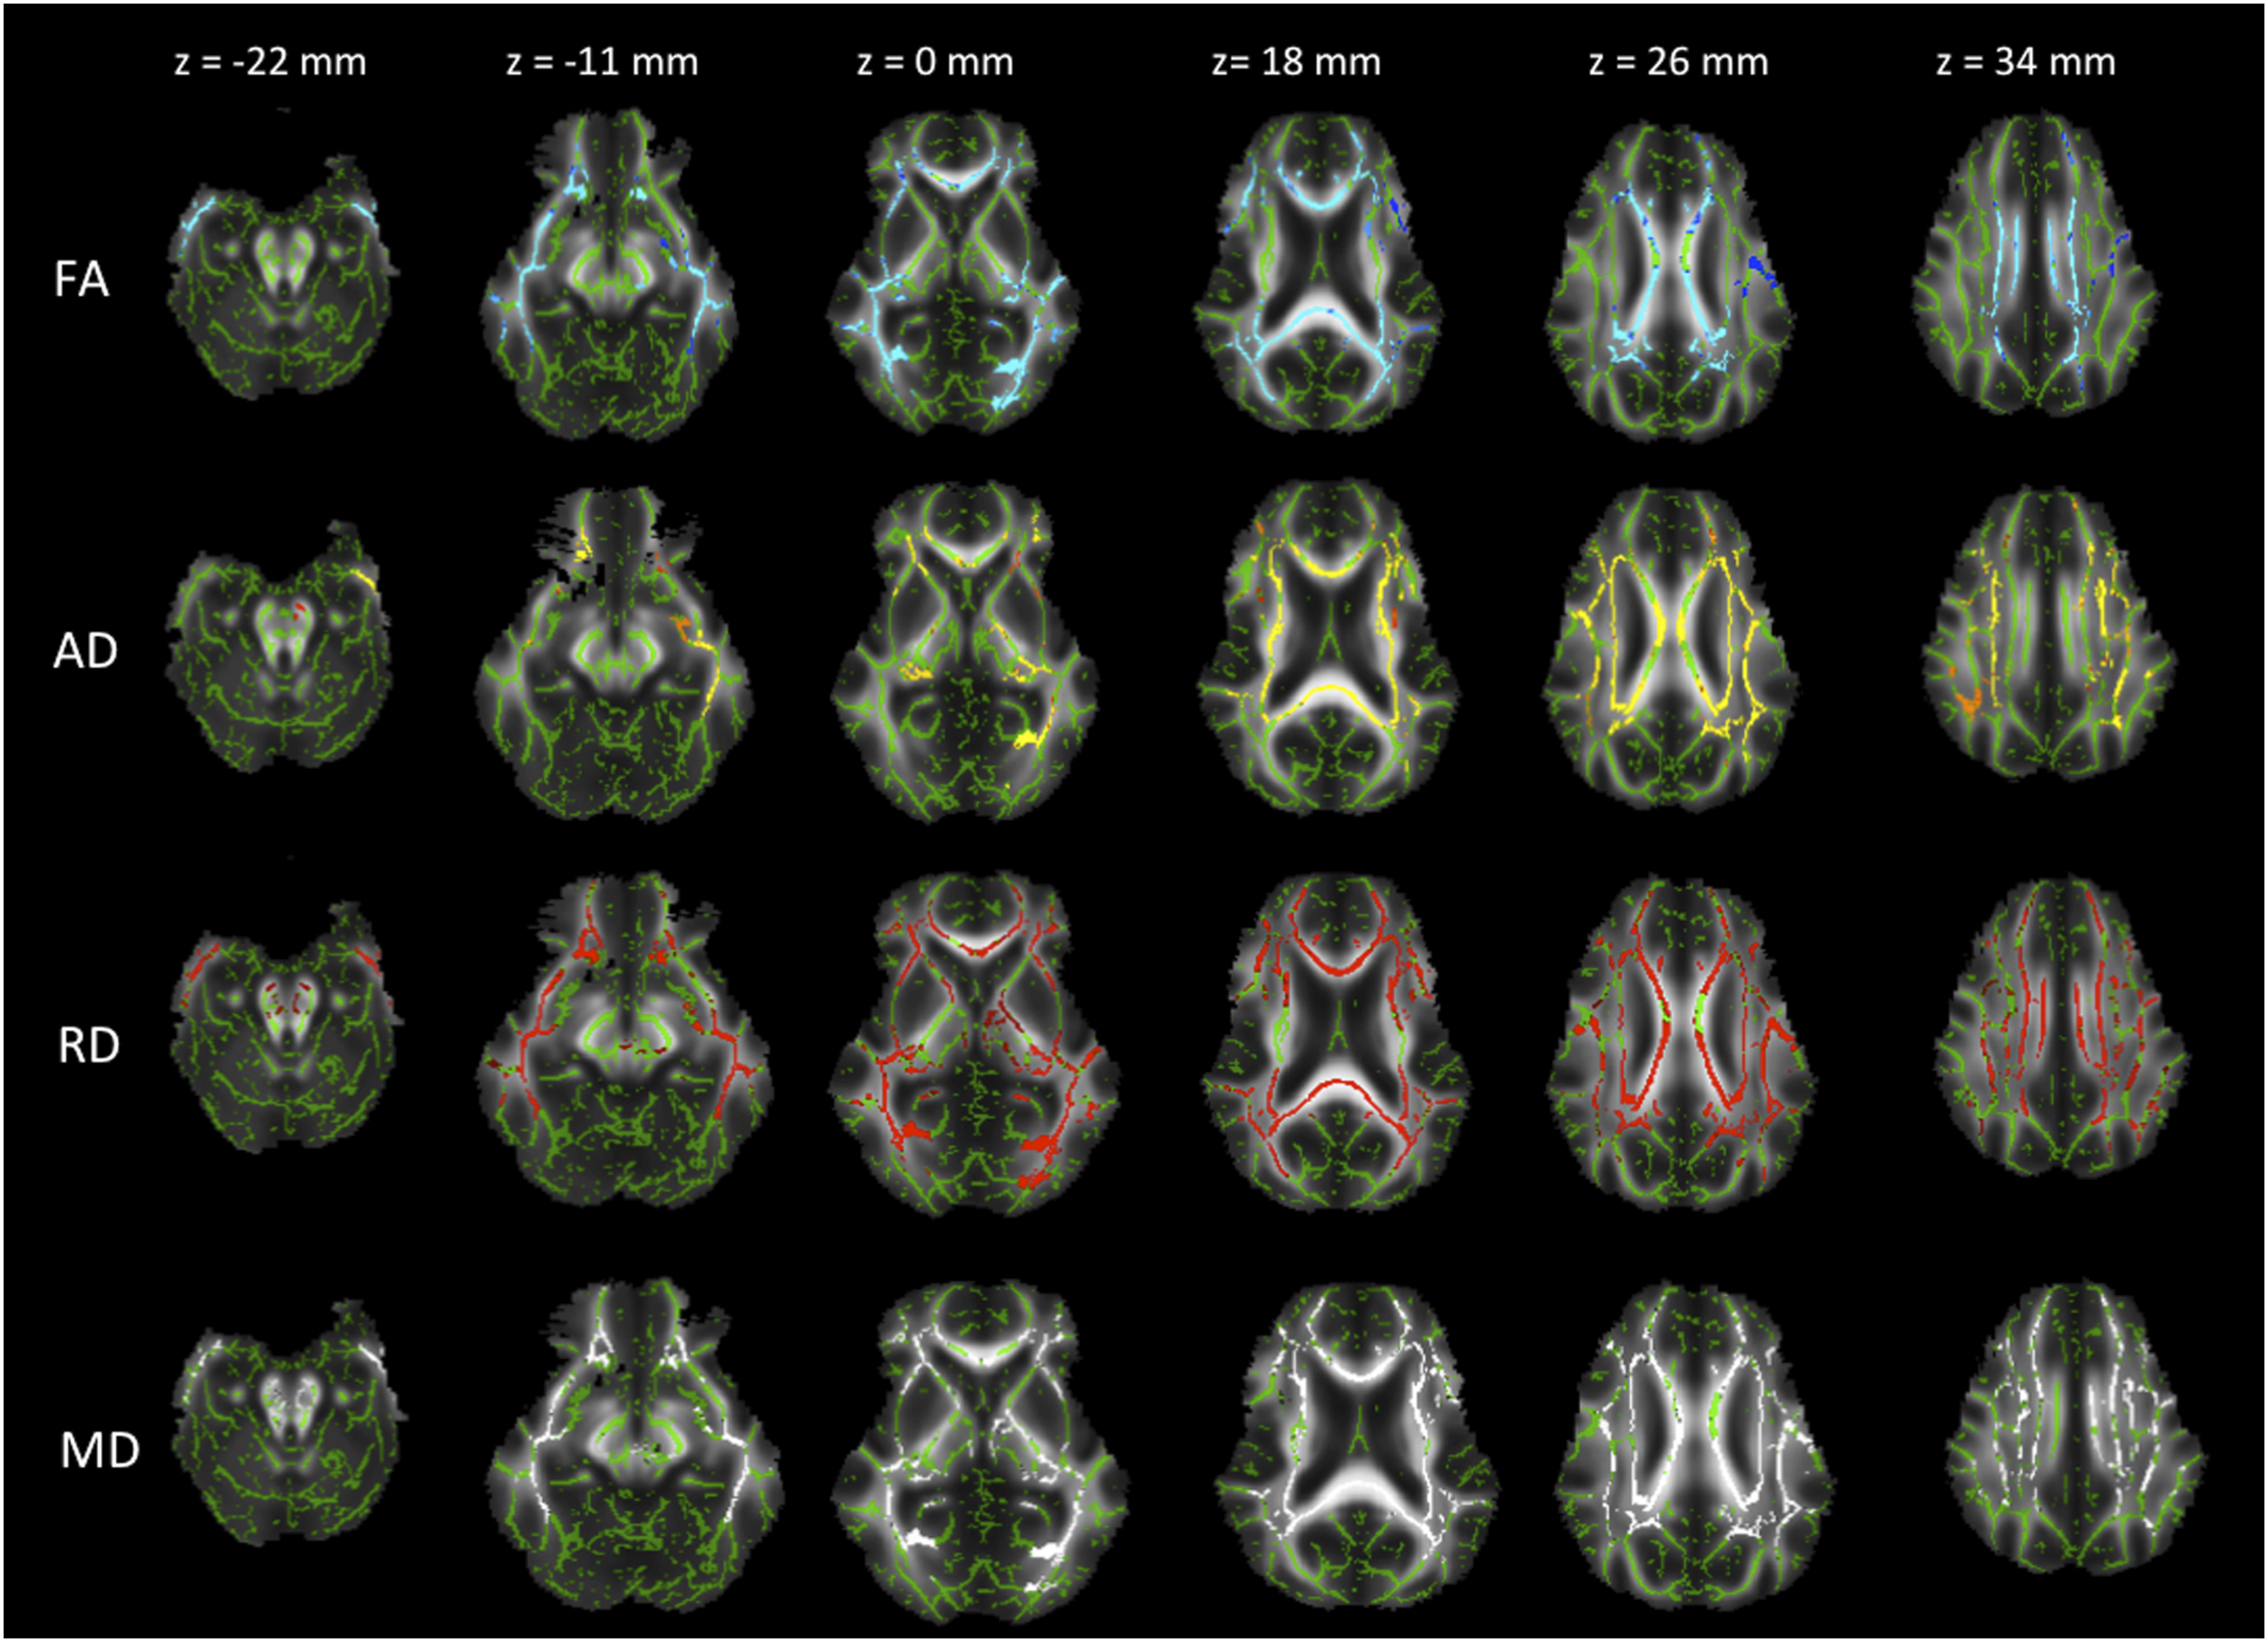
Comparison between patient groups
In the voxelwise-based group comparison, multiple white matter areas with significant differences of FA, RD, AD, and MD were found between patients groups, as follows:
Comparison between groups II and I (medium duration x early stage)
Reduced FA (Figure 2), and a trend to increased RD and MD (Figures 3 and 4). Corrected P maps (p < .05). These maps show the regions where FA (decreased in the blue/light blue voxels) were significantly different between patients in group II and I. Corrected P maps (<0.1). These maps show the regions where RD (increased in the red voxels) were different (trend) between patients in group II and I. Corrected P maps (<0.1). These maps show the regions where MD (increased in the grey voxels) were different (trend) between patients group II and I. 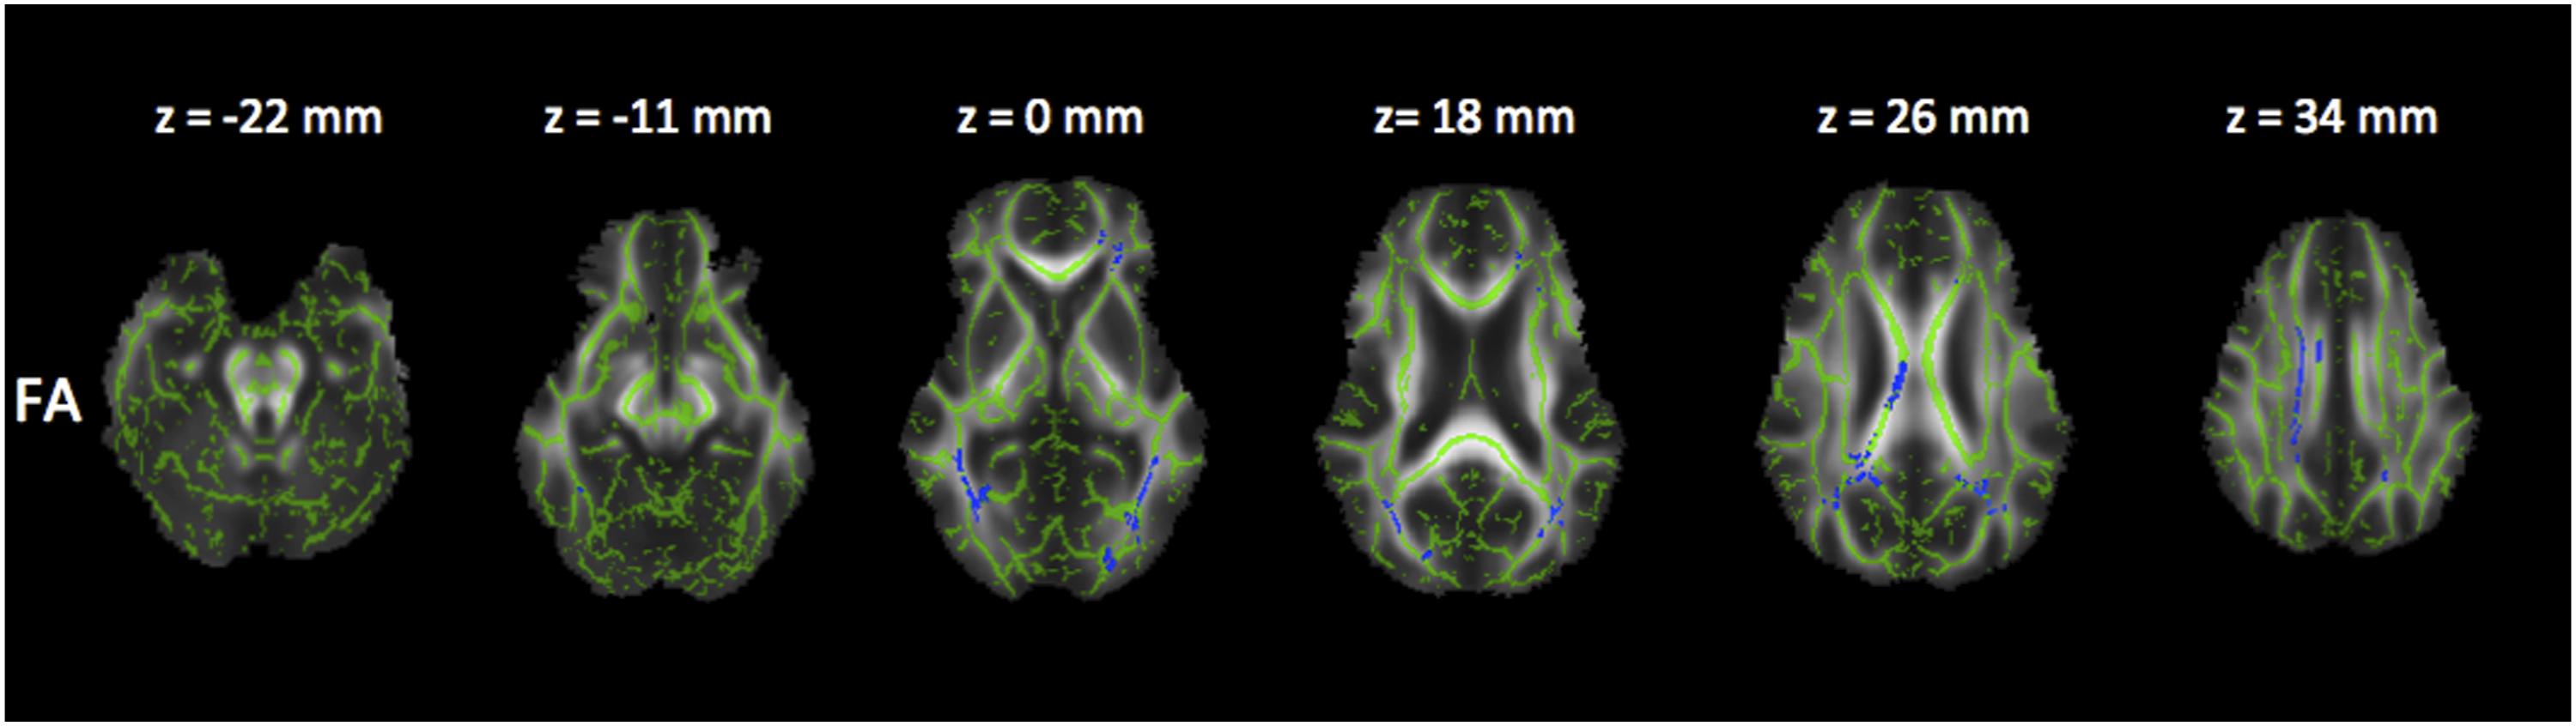
Comparison between groups III and I (severe MS x early stage)
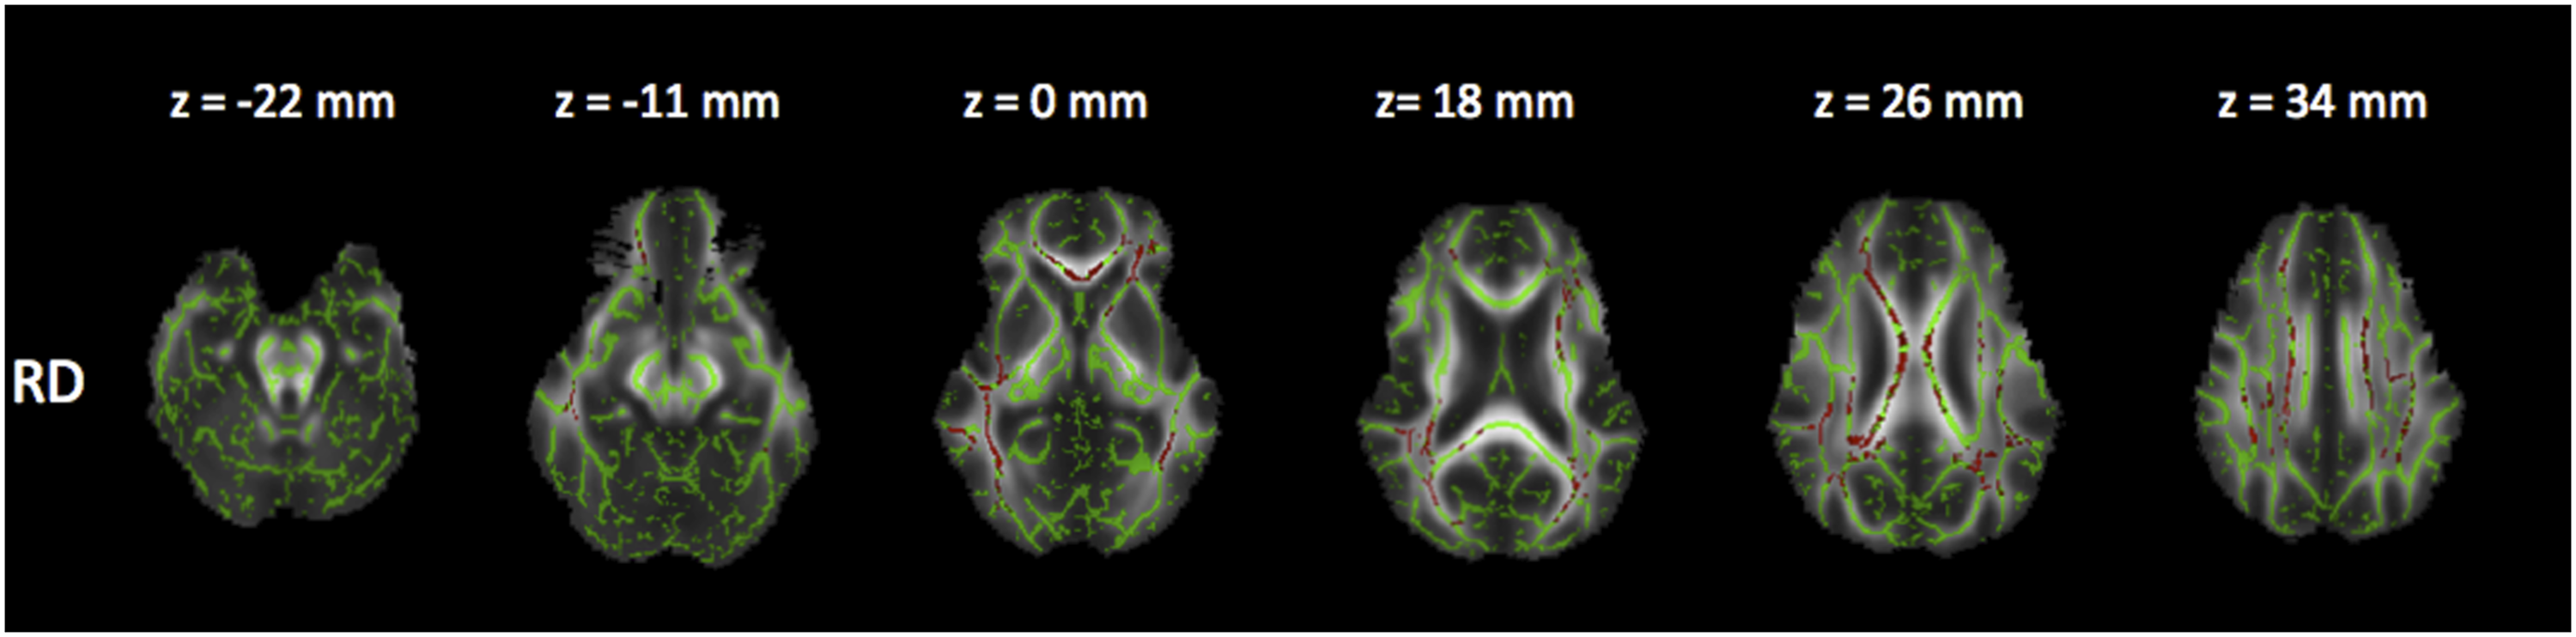
Reduced FA and increased RD (Figures 5 and 6), as well as a trend in increased MD and reduced AD (Figures 7 and 8). Corrected P maps (p < .05). These maps show the regions where FA (decreased in the blue/light blue voxels) were significantly different between patients in group III and I. Corrected P maps (p < .05). These maps show the regions where RD (increased in the red voxels) were significantly different between patients in group III and I. Corrected P maps (<0.1). These maps show the regions where MD (increased in the grey voxels) were different (trend) between patients group III and I. Corrected P maps (<0.1). These maps show the regions where AD (decreased in the yellow/orange voxels) were different (trend) between patients in group III and I.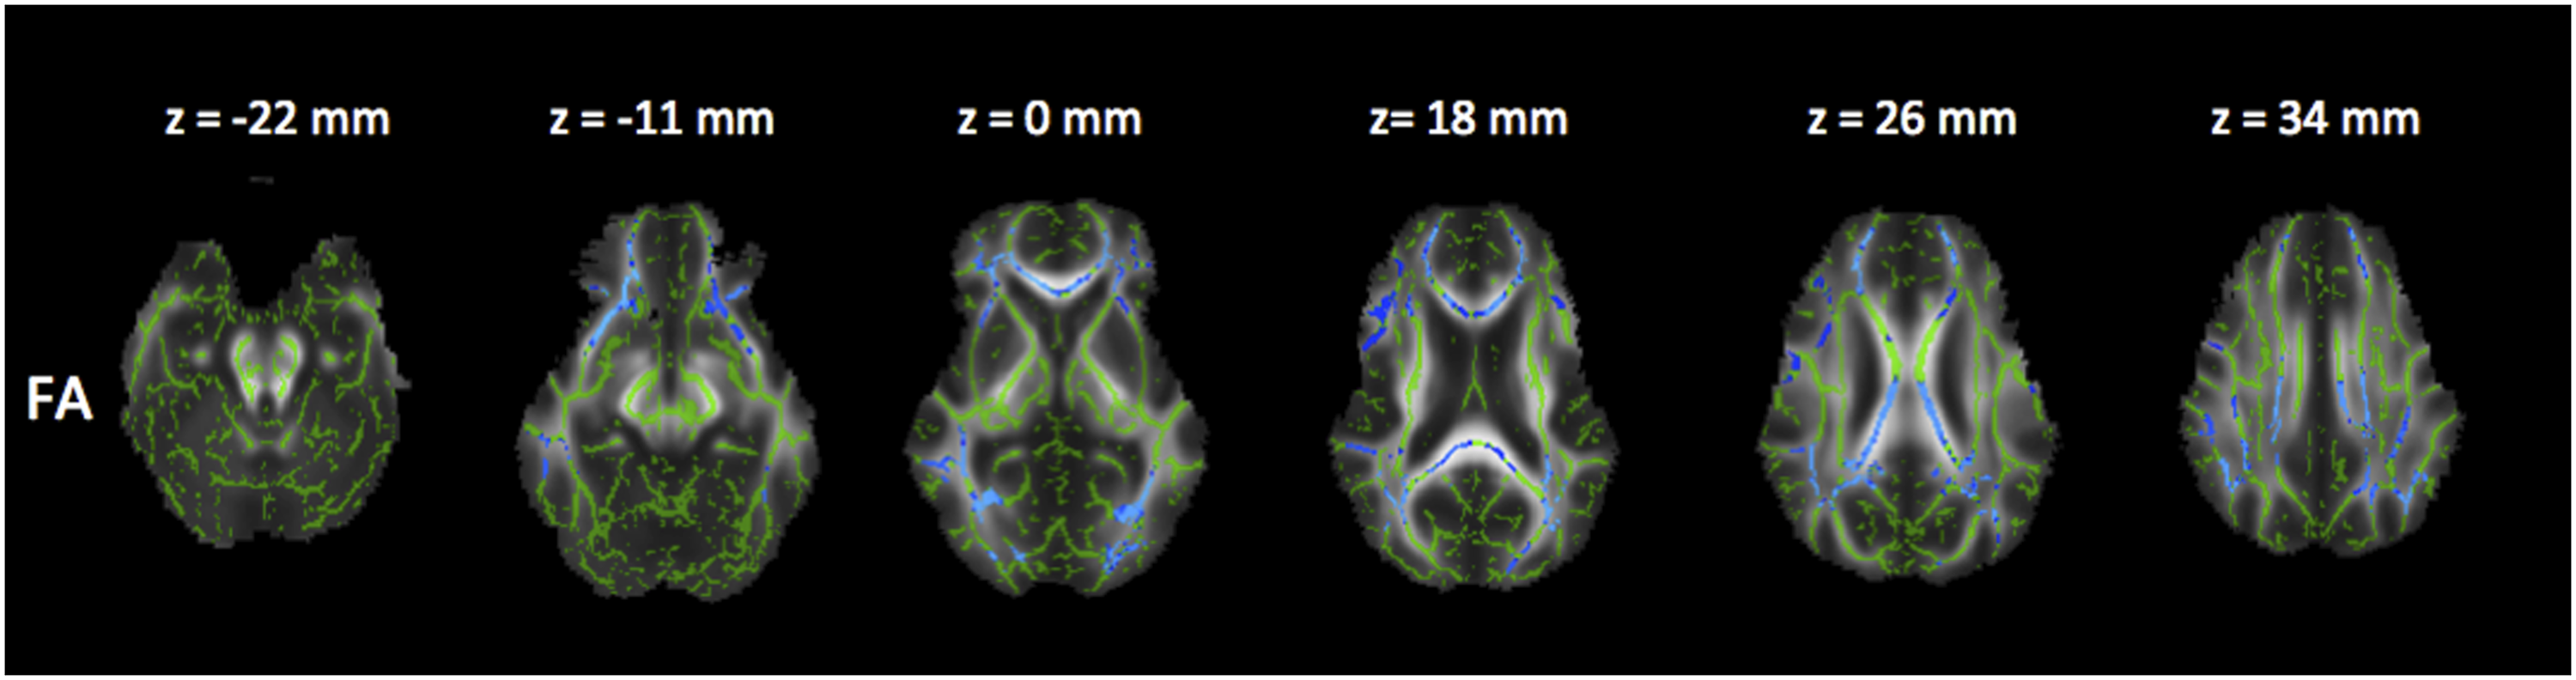
Comparison between groups II and III (medium duration x severe MS)
There was no correlation.
All the anatomic information was based on the Johns Hopkins University white matter tractography atlas and the International Consortium for Brain Mapping DTI-81 white matter labels (part of FSL package) (Supplementary data).
Lesion load
Lesion load of the studied population.
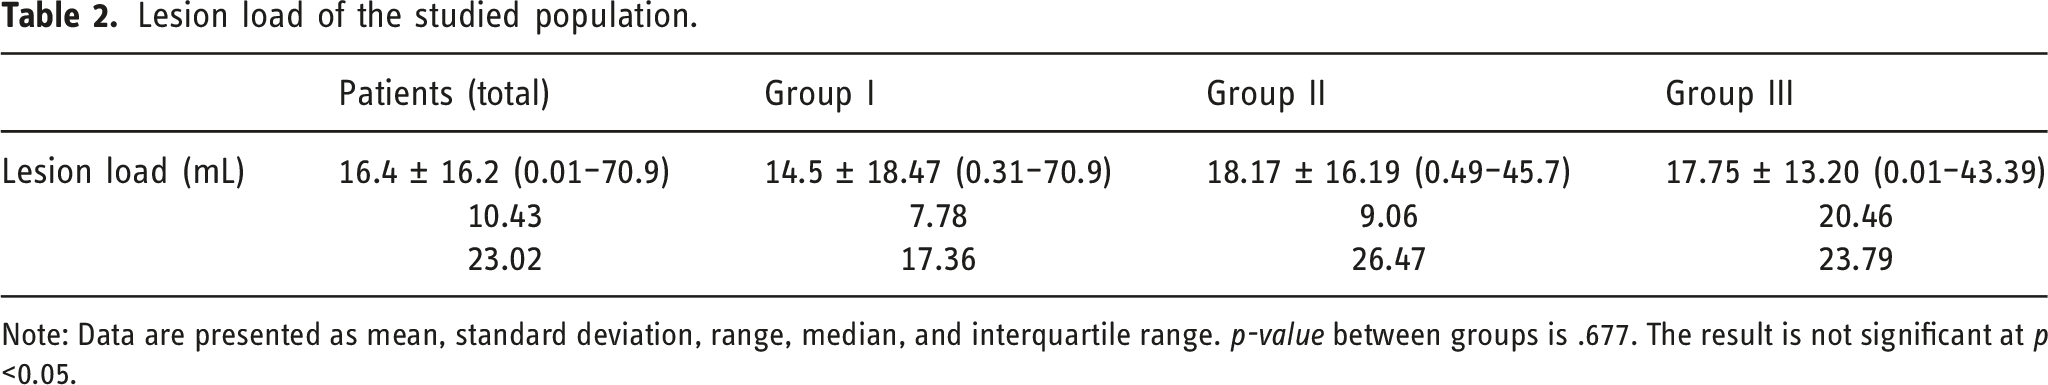
Note: Data are presented as mean, standard deviation, range, median, and interquartile range. p-value between groups is .677. The result is not significant at p <0.05.
Discussion
In the current study, we evaluated the white matter of a series of Brazilian patients with MS by using a voxelwise-based method for DTI data analysis, offering a global view of the WM damage in RRMS patients in relation to disease duration. We first investigated the relationship of whole-brain skeletal measurements between healthy subjects and MS patients, and further analyses were performed grouping patients by 5-year intervals of disease duration periods in order to assess the progression of WM changes. TBSS revealed diffuse damage in WM tracts characterized by significantly decreased FA and increased MD, RD, and AD in patients compared to age-matched controls. When comparing patients groups, a decreased FA with an increased MD and RD, predominantly after the first 5 years of disease, was identified with a further decreased AD after 10 years. Furthermore, we also found a similar pattern with a progressive increase in WM lesion load.
Overall, based on changes over the time, our results are in agreement with previously published data. Raz et al. performed TBSS in 34 patients who presented with clinically isolated syndrome (CIS) suggestive of MS and found that decreased FA involved most of the WM pathways, suggesting that WM involvement plays a relevant role in the early phases of MS. The lesions became stable after 1 year, with no significant longitudinal change in global or regional WM. 16 On the other hand, we found that there is a deterioration in the WM after the first 5 years of disease, that is, in agreement with Asaf et al. who performed TBSS in 90 patients with RRMS and 25 controls, divided according to disease duration, into three groups: short, up to 1 year from clinical onset; moderate, 1–6 years from clinical onset; and long, 6–10 years from clinical onset. They found changes in WM tracts even in patients with very short disease duration compared to controls and did not find significant differences between WM on whole-brain skeletal FA measurement in the short compared to moderate groups, but the comparison between the moderate and the long groups showed diffuse and significant changes involving almost all major WM tracts. 23 When we also take into account multiple diffusion indices, such as MD, RD, and AD, our findings were in agreement with Liu et al. that showed significant reduction in FA and increase in MD, RD, and AD between 42 RRMM patients compared to healthy controls subjects. 14 Schneider et al. also showed the importance of RD changes in a longitudinal intraindividual study. 24 They investigated the WM pathology and the microstructural pathways involved in the progression of the disease at initial diagnosis and after two follow-up visits. They showed that dynamic combined FA and RD changes were associated with specific structures, and increased RD may reflect progressing axonal degeneration.
Our study shows that the decreased FA and increased MD were mainly caused by increased RD, suggesting demyelination as a major factor among various pathological changes in RRMS. However, the interpretation of AD is controversial. The AD changes might be explained by severe decreases in axonal packing density or might be associated with fiber reorganization, increase in membrane permeability, destruction of intracelular compartments, or glial alterations.14,17 Our data also provides evidence that demiyelination and axonal damage are present since the earliest years of disease, with a progressive deterioration over time, worsening more substantially after the first 5 years. This may be related to the concept of “brain reserve,” whereby the disease induced insult might not be significant enough to result in WM tracts structural changes, reflecting the capacity to withstand deteriorating processes, and the ability to endure or recover quickly from the insult in the early years of disease. 25 Histopathologic analysis is, in theory, the most informative approach to understanding theses pathophysiologic events, but postmortem tissue from patients in the earliest stages of MS is rarely available and DTI is considered a useful marker of pathologic damage owing to the opportunity it offers to access microscopic tissue properties.26,27
It is of importance to mention that our patients were not using heDMT therapy because the only current alternatives for first-line treatment in Brazilian public health system were interferon beta (βINF) and glatiramer. 28 Observational studies have shown improved long-term disability outcomes in patients starting early treatment with DMT, compared with a later treatment start. 29 Therefore, our findings can contribute to pharmacological strategy discussions, supporting a therapeutic timing in which treatment should be optimized, linking the need for early treatment with that of an effective treatment.29–31
There are limitations to our study that need to be taken into account when interpreting the data. The assessment of small fiber tracts is difficult with TBSS, because only the major white matter tracts are included in the skeleton. DTI was performed along 30 non-collinear directions which might be enough to compare healthy and MS patients with TBSS analysis 32 ; however, our DTI sequence had only one acquisition at b equals 0 s/mm2 as a limitation of the imager, which makes the DTI acquisitions scheme suboptimal. Furthermore we did not evaluate the number of relapses. Population-based studies have indicated that the number of relapses during the first 2 years of MS is predictive of long-term disability.33–35 To our knowledge, there are a few studies that evaluate patients with MS with TBSS, using FA, MD, RD, and AD, based on disease duration, and these findings should be more replicated in different groups to guarantee the same information. We evaluated different patients with different disease duration and more work is needed to establish the real pattern of lesions and also the difference between the involvement of normal appearing VM and lesioned regions, preferably a prospective longitudinal study, evaluating the same patients over the years, as well as increasing the number of patients to considering only statistically significant values (p less than 0.05). We also considered that the voxelwise analysis results should be correlated with more robust data. 36 And finally, additional advanced imaging techniques such as NODDI (Neurite Orientation Dispersion and Density Imaging) or myelin water fraction imaging may allow for more detailed analysis of smaller fiber tracts and distinction between demyelination and axonal pathology.37,38
In conclusion, our study shows that diffuse white matter damage—demyelination and axonal injury—is detectable in MS patients since the first years of disease but has a predominant role after 5 years, providing evidence that the early years might be a window for treatment optimization and preventing irreversible disability and cognitive alterations.
Footnotes
Declaration of conflicting interests
The author(s) declared no potential conflicts of interest with respect to the research, authorship, and/or publication of this article.
Funding
The author(s) received no financial support for the research, authorship, and/or publication of this article.
Data Availability Statement
All data generated or analyzed during this study are included in this published article.