
Abstract
In the dissolution-dynamic nuclear polarization technique, molecular probes with long T1s are preferred. 13C nuclei of small molecules with no directly bonded protons or sp3 13C nuclei with proton positions substituted by deuterons may fulfill this requirement. The T1 determination of such new molecular probes is crucial for the success of the hyperpolarized observation. Although the inversion-recovery approach remained by and large the standard for T1 measurements, we show here that the steady-state variable nutation angle approach is faster and may be better suited for the determination of relatively long T1s in thermal equilibrium. Specifically, the T1 of a new molecular probe, [uniformly labeled (UL)-13C6, UL-2H8]2-deoxy-d-glucose, is determined here and compared to that of [UL-13C6, UL-2H7]d-glucose.
Introduction
The dissolution-dynamic nuclear polarization (DNP) technique has revolutionized the solution state and in vivo nuclear magnetic resonance (NMR) spectroscopy field, by offering an increase of >10,000-fold in signal. 1 However, this approach is limited by the need to obtain a substrate molecule that has a reporting nucleus with long T1. This is because it takes a minimum of 20 seconds for the processes of dissolution and transfer of the hyperpolarized liquid samples to an NMR scanner. During this time and further on, the induced massive spin polarization decays at a rate that is governed by the spin–lattice relaxation with a time constant T 1. Therefore, useful molecular probes for this technique need to have nuclei with slow relaxation rates, ie, 5T1 > 20 seconds.
13 C of small molecules that have no direct protons attached, eg, carbonyl, carboxyl, certain quaternary carbons, or perdeuterated carbons, 2 may fulfill this requirement. Other requirements for successful dissolution-DNP molecular probes relate to their biological activity.3,4 Molecular probes for this technique should be transported and metabolized within very few minutes to enable the evaluation of their activity, while the hyperpolarized signal is still at a sufficient level. 5 The selection of a metabolite candidate for development into a dissolution-DNP molecular probe depends heavily on the T1 of the reporting nuclei in this probe and on the determination of this T1.
T1 can in principle be determined based on the decay curve of the hyperpolarized signal. 6 This is an extremely fast and reliable way of measuring T1,4,6 provided that the effects of radio-frequency (RF) pulses and the temperature are well controlled during the measurement. However, this technique critically depends on the availability of a dissolution-DNP polarizer, which is much less abundant than NMR spectrometers or magnetic resonance imaging (MRI) scanners. Also, it is preferred that a 13 C (or 13 C and D)-labeled compound is available. Non- 13 C-labeled compounds have a 100-fold lower signal, which could be a limiting factor, as hyperpolarized spectra cannot benefit from the advantages of signal averaging as thermal equilibrium measurements can. Because the measurement of T1 is done as part of the design of a new molecular probe and as an initial step to avoid costly nonuseful custom synthesis efforts, this is a true limitation in the design of novel molecular probes for the dissolution-DNP technology.
The inversion-recovery (IR) technique is by and large the sole T1 determination approach in use today in solutions. This technique depends on the time required to reach thermal equilibrium, ie, durations longer than 5T1, which results in very long measurement times for nuclei that have a long T1 and are low in abundance or concentration (due to the high number of scans required for satisfactory signal-to-noise ratios). In 1971, Christensen et al
7
introduced the steady-state variable nutation angle (SSVN) method, which enables fast T1 measurements. This method was revisited by Gupta
8
in 1977 and by Homer and Beevers
9
in 1985. The latter two studies described the potential and limits of the SSVN method for T1 determinations. The method requires dummy scans to reach steady states and pulse repetition times (TR) that are longer than
These investigations of the SSVN approach, as well as the earlier works of Look and Locker, 10 served as the basis for the development of the saturation-recovery technique for T1 estimations (multiple 90° RF pulses at relatively short repetition times) as well as for steady-state imaging. 11 Despite this large body of work, validation, and tremendous implications for MRI, by and large, the SSVN approach had not been used for T1 determinations in solution-state NMR. Here we test the utility of the linear regression version of the SSVN approach (Equ. 3, below)8,9 for T1 determination of specific probes. This is part of a characterization effort of stable-isotope-labeled sugar molecular probes that are being evaluated for use in dissolution-DNP hyperpolarized magnetic resonance (MR).
Glucose is the most important and predominant sugar in life and is metabolized by prokaryotes and eukaryotes. It is the starting material for multiple biochemical pathways, eg, glycolysis, glycogenesis, streptomycin biosynthesis, and starch and sucrose metabolism. In vivo and in vitro MR studies (MRs) following the metabolic fate of 13 C-labeled glucose 12 have contributed to the understanding of brain,13–17 liver, 18 and muscle19,20 metabolism in mammals as well as the formation of gallic acid in plants and fungi. 21 [Uniformly labeled (UL)- 13 C6, UL- 2 H7]d-glucose is a relatively new molecular probe for dissolution-DNP that was found useful for hyperpolarized glucose MRI 22 and hyperpolarized MR monitoring of glucose metabolism in tumors, 23 yeast, 24 and enzymatic reactions. 25 The nonmetabolic derivative of glucose, 18 F-deoxyglucose, has been used in nuclear medicine for diagnosing and staging diseases for more than 20 years. Nonradioactive 2-deoxy-d-glucose has been used to study erythrocytes 26 and brain 27 28 metabolism. The radioactive analog [14C1]2-deoxy-d-glucose was also used in the MR study of brain metabolism. 29
In an attempt to follow the footsteps of this highly valuable molecular probe and produce a nonradioactive analog that could be useful for hyperpolarized MRI, the [UL- 13 C6, UL- 2 H8]2-deoxy-d-glucose analog was designed and synthesized. Here we determine the T1 of position 1 of the α and β anomers of this novel probe using the linear regression version of the SSVN method. The results are validated with respect to an IR measurement of the same sample and compared to the respective T1s of the [UL- 13 C6, UL- 2 H7] d-glucose probe. Using these specific molecules and anomers we determined the effect of substituting a hydroxyl group (in [UL- 13 C6, UL- 2 H7]d-glucose) with a deuterium atom (in [UL- 13 C6, UL- 2 H8]2-deoxy-d-glucose) on an sp3 13 C spin-lattice relaxation.
Materials and Methods
Materials
[UL- 13 C6, UL- 2 H7]d-glucose (99% 13 C, 97–98% 2 H) was obtained from Cambridge Isotope Laboratories. [UL- 13 C6, UL- 2 H8]2-deoxy-d-glucose (99% 13 C, 99% 2 H) was obtained from 13C Molecular.
NMR samples
The [UL- 13 C6, UL- 2 H7]d-glucose and [UL- 13 C6, UL- 2 H8]2-deoxy-d-glucose concentration in the NMR samples was 400 mM in 10:90% D2O:H2O.
NMR measurements
Samples were placed in 5 mm tubes and measured at 11.8 T (Bruker) with a 5-mm PABBO probe. Temperature was calibrated to 37°C, and data were recorded using the standard IR (RD-180°-τ-90°-AD) pulse sequence and the SSVN (RD–θ–AD) pulse sequence, where RD is the recovery delay (seconds); τ is the time increment (seconds); AD is the time of acquisition (seconds); and θ is the RF pulse nutation angle. For the latter pulse sequence, data were recorded after five dummy scans to ensure that a steady state was formed. To eliminate residual signals, we used phase cycling (x, -x, -x, x, y, -y, -y, y).
The 90° pulses were calibrated by determining the 360° pulse widths for each sample and each measurement. For the SSVN measurement, the θ pulse duration was increased from one to nine microseconds, with one microsecond steps. One microsecond corresponded to an 8.6° nutation angle. Thus, θ varied over 8.6–77.4°. These SSVN θ values were chosen according to the work of Christensen et al 7 who showed that with four to five dummy scans, the optimal angles for T1 determination were <90°.
Spectral processing
All spectra were processed using Mnova (Mestrelab Research). The 13 C resonances of the α and β anomers of the deuterated and the protonated (isotopic impurity) nuclei were identified based on previous literature for d-glucose30–33 and d-deoxyglucose34,35 and using the simulation of the multiplet signals. For convenience, the chemical shift of both the glucose and the deoxyglucose spectra was calibrated using the deuterated α-glucose and α-deoxyglucose C1 signals at 92.77 ppm.
Integrated signal intensities were used in the analyses of the time or nutation angle-dependent signal behavior. The integral regions that were used for the analyses of the deuterated α- and β-glucose C1s were 92.85–93.41 ppm and 96.60–97.18 ppm, respectively. For the analyses of the deuterated α- and β-deoxyglucose C1s, the integral regions that were used were 92.87–93.41 ppm and 94.91–95.44 ppm, respectively.
The spectra of both the [UL-
13
C6, UL-
2
H8]2-deoxy-d-glucose and the [UL-
13
C6, UL-
2
H7]d-glucose compounds and their anomer structures are shown in Figure 1. The rational for selecting the integration regions described above is as follows. Because the measurements were recorded without decoupling of the proton or the deuterium interaction, the
13
C signals of both the labeled molecules and the protonated isotopic impurity molecules appear split. Simulating these spin systems (Fig. 2) showed that the
13
C resonances of the isotopic impurity and the labeled compound overlap. The region of overlap is shown in Figure 2, on the right-hand side of the major multiplet. For the analyses of T1, in order to avoid a possible effect of this overlap, we used an integration region consisting of the two most left-hand side peaks of the major multiplets, which were farthest from the overlapping isotopic impurity signals.
13
C spectra and structures of [UL-
13
C6, UL-
2
H8]2-deoxy-d-glucose and [UL-
13
C6, UL-
2
H7]d-glucose: (A) the chemical structures of the α and β anomers of [UL-
13
C6, UL-
2
H8]2-deoxy-d-glucose, (B) a
13
C spectrum of [UL-
13
C6, UL-
2
H8]2-deoxy-d-glucose, showing the signals of the α and β anomers, (C) the chemical structures of the α and β anomers of [UL-
13
C6, UL-
2
H7]d-glucose, and (D) a
13
C spectrum of [UL-
13
C6, UL-
2
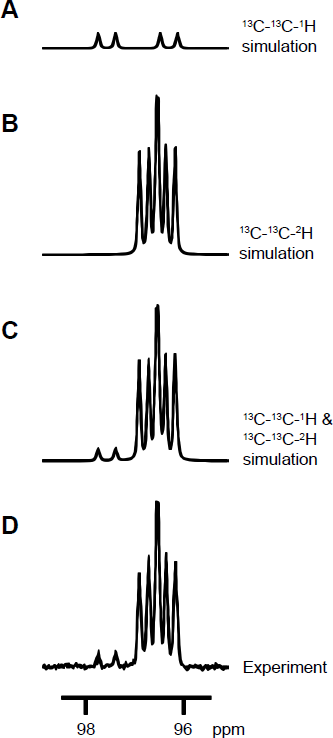
H7]d-glucose, showing the signals of the α and β anomers. the marked signals were assigned according to previous reports.19–22 The simulations of the β-[UL-
13
C6, UL-
2
H7]d-glucose
13
C1 signals in the fully labeled compound and in an isotopic impurity (A–C) in comparison to the experimental spectrum (D). (A) The signal of the
13
C1 that is bonded to proton (isotopic impurity) is split due to the interaction with
13
C2,
13
C3,
13
C5, and the proton nucleus directly bonded to it. the J-coupling constants used in this simulation were as follows: JC1–C2 = 45 Hz, JC1–C3 = 4 Hz, JC1–C5 = 4 Hz, and JC1–H = 161 Hz, based on a previous characterization.
17
(B) The signal of the
13
C1 of the deuterium-labeled compound β-[UL-
13
C6, UL-
2
H7]d-glucose is split due to the interaction with
13
C2,
13
C3, and
13
C5 and the deuterium nucleus directly bonded to it. the J-coupling constants used in this simulation based on a previous characterization were as follows
17
: JC1–C2 = 44 Hz, JC1–C3 = 3.5 Hz, JC1–C5 = 4 Hz, and JC1–D = 24.5 Hz. (C) The signal resulting from a combination of the upper and middle panels. (D) The experimental signal of C1 of β-[UL-
13
C6, UL-
2
H7]d-glucose that also contains the isotopic impurity of a protonated C1 (or β-[UL-
13
C6,2,3,4,5,6,6-
2
H6]d-glucose). The experimental spectrum matches the simulated spectra extremely closely; it is presented separately for the purpose of discerning the two. The signals of
13
C1 of the α anomer showed the same split pattern. The signals of
13
C1 of the α and β anomers of [UL-
13
C6, UL-
2
H8]2-deoxy-d-glucose showed a similar split pattern, although prior J-coupling constants for this molecule are not available in the literature as this molecule is first introduced here, to the best of our knowledge.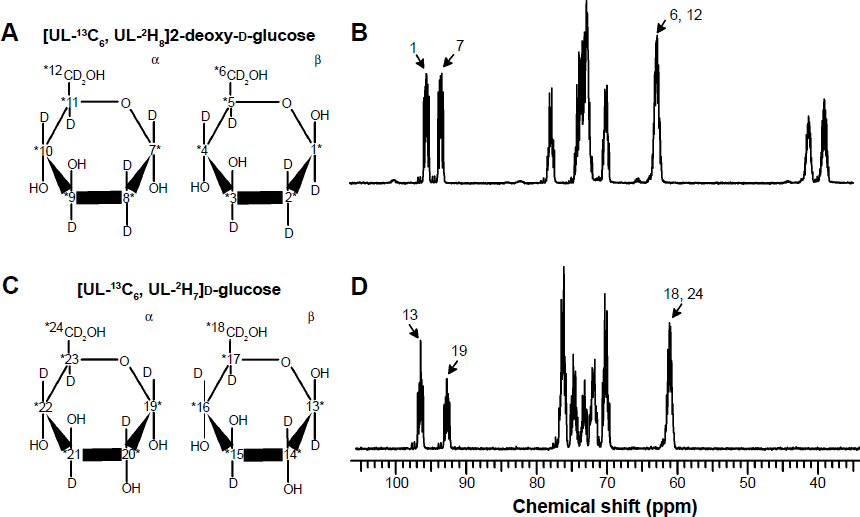
T1 analyses.
The time or the nutation angle-dependent signal behavior in the IR and the SSVN experiments can be described, respectively, by

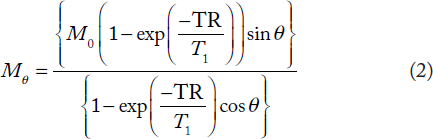
T1 was extracted from experiments with a variable nutation angle and a given TR time. For this, it is convenient to rewrite Equ. 2 as Equ. 3, which can be analyzed by a linear fit for a fixed TR value, considering Mθ/sin θ vs. Mθ/tan θ (Equ. 3)
8
:
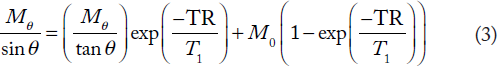
This approach is the linear regression version of the SSVN method. T1 is then extracted from the slope of the resulting line and M0 from the intercept at (Mθ/tan θ) = 0. In principle, it is also possible to carry out the measurement with a variable TR and a fixed nutation angle. The saturation-recovery technique is a variant of this steady-state approach where the fixed angle is set at 90° and TR is varied. We chose the former option (fixed TR) in order to keep the TR as short as possible for the benefit of time efficiency.
According to the previous analysis of the linear regression version of the SSVN method, 8 it was shown that optimal fits were obtained at pulse angles ≤90°7,9 and TRs in the range of 0.1–10T 1. Previously, the T1 of [UL- 13 C6, UL- 2 H7] d-glucose was estimated at 12 seconds. 22 We used TRs of 7 and 14 seconds corresponding to estimated 0.6T1 and 1.2T1, respectively. The same TR values were used for [UL- 13 C6, UL- 2 H8]2-deoxy-d-glucose.
Curve and linear fittings for analyses of IR and SSVN data, respectively, were performed using nonlinear least squares and linear least squares carried out in MATLAB (MathWorks, Inc.). The 95% confidence interval was determined using MATLAB's confint function.
Results
A typical data set for the SSVN method for the C1 position in the [UL-
13
C6, UL-
2
H8]2-deoxy-d-glucose sample is shown in Figure 3A. The nutation angle, θ, was varied over ~9–77°, while the TR was fixed at 7 or 14 seconds. These TR values were selected based on our previous work with [UL-
13
C6, UL-
2
H7]d-glucose at the same magnetic field
22
(see Materials and methods). Nevertheless, we note that the determination of T1 is the aim of the experiment and it is not necessarily known or approximated beforehand. Without a prior estimate of T 1, it is likely that at least two measurements at two different TRs can provide increased confidence that the T1 is indeed determined with a suitable TR.
(A) A typical SSVN data set showing the signals of
13
C1 of α- and β-[UL-
13
C6, UL-
2
H8]2-deoxy-d-glucose at variable nutation angles (θ) acquired with a TR of 14 seconds, 20 repetitions, and five dummy scans. The pulse duration was incremented from one to nine microseconds, with one microsecond steps. One microsecond corresponded to a 8.6° nutation angle. Thus, θ was varied over 8.6–77.4°. (B) A fit of the SSVN data shown in (A) for the β anomer using Equ. 3. The resulting linear fit was Mθ/sin θ = (Mθ/tan θ) 0.377 + 8946 with an R
2
of 0.99. According to Equ. 3, the slope (0.377) equals to exp (-TR/T1). thus, here the T1 value is calculated from the slope for a known TR of 14 seconds to be 14.4 seconds.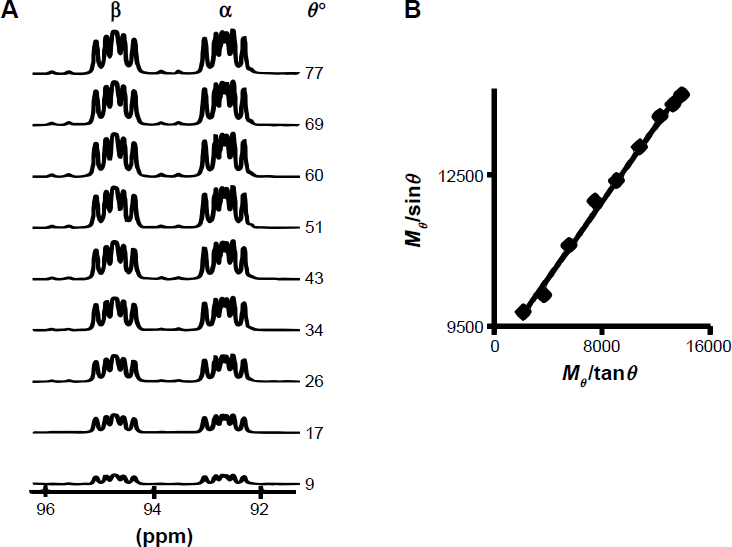
Figure 3B shows the data that were obtained for the β anomer, plotted as Mθ/sin θ vs. Mθ/tan θ, to enable analysis by a linear fit to Equ. 3. T1 was determined from the slope of this line. M0 could be obtained from the y-axis intercept, but it was not needed here.
T1 values calculated using the SSVN method and compared to the IR method.
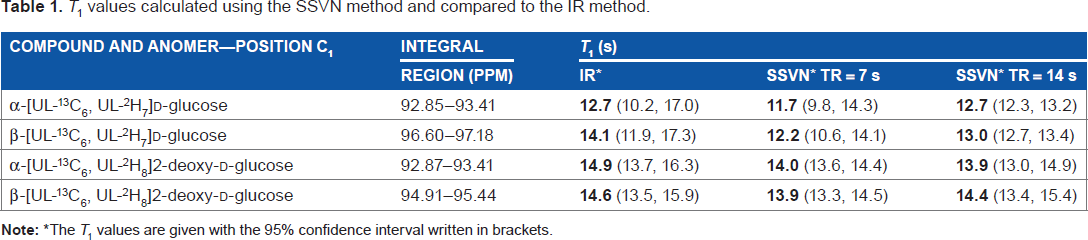
The T1 values are given with the 95% confidence interval written in brackets.
Considering the confidence intervals of the T1 values in Table 1, it can be said that the values obtained using the SSVN method with TR 7 or 14 seconds are similar. These values are also similar to the values obtained by the IR method. The T1 values obtained for the C1 position of both α and β anomers of both molecules appear the same considering the confidence intervals of all values. The T 1s of other positions were not determined here due to the complexity to identify some of the positions and the heavy overlap between positions due to the complex 13 C and deuterium split of all positions. Nevertheless, we believe that for the purpose of demonstrating the utility of the SSVN approach, the investigation of the same position (C1), in both compounds and both anomers of each compound, was sufficient.
Discussion
We showed that the linear regression version of the SSVN method for T1 determination of nuclei with slow spin–lattice relaxation provides similar results as the standard IR method, with the advantage of being faster. Using SSVN method, with a TR of 14 seconds (about 0.8–1.4T1, according to the confidence intervals) and recording 20 scans (preceded by 5 dummy scans) with nine iterations, the total scan time was 52.5 minutes, whereas using IR with seven time increments, the total scan time was 1.5 hours. If the perfectly matching IR experiment would have been performed, ie, with the last time increment at least three times T1, and nine time increments were applied as in the SSVN method, all with a TR ≥ 5T1, the scan time would be about four hours. This has a huge impact on the time spent for testing and evaluating the various potential metabolites and the possible 13 C/ 2 H/ 15 N labeling for DNP–NMR metabolic studies. 3 Considering T1 measurements of low solubility materials or compounds at natural abundance that could take several days using the IR method, it renders the SSVN method a crucial enabling methodology.
In addition to the direct acquisition time calculation, another factor that is in favor of the SSVN approach, as it is applied here, is that all the data points have a significant and measureable signal. However, in the IR approach, data points that are crucial for the accuracy of the curve fitting, ie, data points that are in the middle of the curve and close to τ0, are those with an inherently low signal. In a long IR experiment, one may find that several hours or a day had been spent on acquiring a data point that shows minimal to zero signal. This leads to data sets that are noisier and have loss of precision in the results, which may be also manifested as the wider confidence intervals. Although not the aim of the current study, such an analysis of the effect of noisier data can be performed as well, as previously shown by Chang et al in 2008. 36
One caveat to the SSVN approach is the need to calibrate carefully the nutation angle. Although errors in the 90° and 180° pulses will lead to imperfect experiments and loss of accuracy of the IR results, the results of the SSVN approach appear much more sensitive to such errors due to the direct use of the nutation angle value as a factor in the calculation of T1. Nevertheless, we note that while errors in flip angle determination in the IR experiments can be very complex to correct for, a retrospective correction in the flip angle value for the SSVN experiment can be implemented easily.
In the current study, decoupling of protons or deuterons was not used as this is known to reduce the apparent relaxation time due to magnetization transfer from the attached nuclei, hence leading to a measured T1 value that is shorter than the true relaxation time. 6 For this reason, the J-couplings due to the 13 C- 1 H and 13 C- 2 H interactions are visible. The split pattern was fully simulated for the C1 signal of β-[UL- 13 C6, UL- 2 H7] d-glucose (Fig. 2) and aided in determining the required integral regions for analysis. Simulation was performed only for the [UL- 13 C6, UL- 2 H7]d-glucose molecule because prior knowledge on the J-coupling constants in this case was available. Nevertheless, we note that this split pattern was similar in both compounds and both anomers.
Finally, the T1 of the C1 position does not seem to be affected by the change in its neighboring group from a hydroxyl moiety to a deuteron (in [UL- 13 C6, UL- 2 H7] d-glucose and [UL- 13 C6, UL- 2 H8]2-deoxy-d-glucose). Further studies are required to fully assign the split signals of [UL- 13 C6, UL- 2 H8]2-deoxy-d-glucose and attempt the estimation of the T1 of further positions in this molecule. We note that the 13 C positions with signals that are heavily overlapping with the signals of other positions may not be amenable for T1 analysis. Here we focused on the signals of position 1 as these were distinct.
Conclusion
Because the hyperpolarized MR technology requires molecular probes with long T1, methods for T1 determination that are reliable and time effective are needed. We found that the SSVN method provides this solution. It saves a significant amount of time and generates results that are similar to the standard IR method. It is demonstrated here that for an sp3 13 C nucleus, the substitution of a directly bonded hydroxyl group with a deuteron does not affect T1.
Author Contributions
Conceived and designed the experiments: MJ, AG, RKB. Analyzed the data: MJ, AG. Wrote the first draft of the manuscript: MJ, AG, RKB. Contributed to the writing of the manuscript: MJ, AG, YH, RKB. Agree with manuscript results and conclusions: MJ, AG, YH JS JMG, RKB. Jointly developed the structure and arguments for the paper: MJ, AG, YH, JS, JMG, RKB. Made critical revisions and approved final version: MJ, AG, YH JS JMG, RKB. All authors reviewed and approved of the final manuscript.
Footnotes
Acknowledgments
We thank Shimon Vega for useful discussions.