
Abstract
Using a gene-based approach to track cellular and molecular activity with magnetic resonance imaging (MRI) has many advantages. The strong correlation between transverse relaxation rates and total cellular iron content provides a basis for developing sensitive and quantitative detection of MRI reporter gene expression. In addition to biophysical concepts, general features of mammalian iron regulation add valuable context for interpreting molecular MRI predicated on gene-based iron labeling. With particular reference to the potential of magnetotactic bacterial gene expression as a magnetic resonance (MR) contrast agent for mammalian cell tracking, studies in different cell culture models highlight the influence of intrinsic iron regulation on the MRI signal. The interplay between dynamic regulation of mammalian iron metabolism and expression systems designed to sequester iron biominerals for MRI is presented from the perspective of their potential influence on MR image interpretation.
Keywords
Introduction
There are many advantages of using a gene-based approach to track cellular and molecular activity with a noninvasive imaging platform like magnetic resonance imaging (MRI). Gene-based contrast provides longevity of the signal throughout the cell's life cycle. This approach also enables tracking of inherent biological activity and detection of the onset of cellular changes using reporter gene expression. With such a tool, the activity of choice can be monitored by programing the magnetic resonance (MR) contrast signal using genetic engineering. Nevertheless, as with most emerging molecular imaging technologies, there are also a number of challenges to overcome. Despite the superb anatomical resolution of MRI, the voxel size is large relative to the cell volume. This dilution factor is compounded by the magnitude of the molecular signal from gene-based iron labeling, which is much lower than traditional exogenous contrast agents like dextran-coated superparamagnetic iron oxide (SPIO) nanoparticles. There remains a need for development of more sensitive and/or signal-specific MR detection methods, software, and hardware.
As molecular MRI pushes forward, we anticipate improvements on all levels and particularly with respect to the incorporation of magnetosome genes to optimize formation of an MR detectable iron biomineral in mammalian cells.1–4 In addition, we expect the conversation will shift to include recognition of the interplay between cellular iron homeostasis and the addition of genetically engineered iron contrast. By permitting the cell to generate its own iron nanoparticles, we are also allowing the cell to dispose this iron in a biologically compatible manner and we are asking the animal subject to handle the iron load in a physiologically acceptable manner. This will, in turn, be relayed by in vivo MRI. We therefore hypothesize (a) that molecular imaging using gene-based iron contrast will be influenced by intrinsic iron regulatory mechanisms and (b) that these iron-handling processes may be used to modulate and interpret MR images.
Herein, we examine general features of mammalian iron regulation and the components of transverse relaxation that respond to cellular iron, with particular reference to the potential of magnetotactic bacterial gene expression as an MR contrast agent. Studies using MagA as a prototype for magnetosome-like particle formation in mammalian cells indicate that expression of select iron-handling protein from magnetotactic bacteria imparts magnetic properties compatible with, but not subject to, iron homeostasis in the host cell.5,6 By considering the interplay between dynamic iron regulation and gene-based image contrast, we highlight features of iron metabolism that may impinge on the MR signal and be used to understand and manipulate gene-based MRI contrast.
MR Measures of Gene-based Iron Labeling and Cellular Contrast
The expression of MagA, a magnetotactic bacterial protein and putative iron transporter, 7 has been assessed in several mammalian cell types and consistently provides an increase in total cellular iron in response to an extracellular iron supplement.5,6,8–11 While there are differences in iron handling among the parental cell types,5,10 MagA-derived MR contrast is nevertheless detectable and quantifiable, as measured by the transverse relaxation rates. Thus, MagA serves as a prototype for the expression of magnetotactic bacterial genes in mammalian cells, including magnetosome genes, to impart magnetic characteristics by increasing cellular iron content without causing cytotoxicity8,9,11
The presence of iron particles within tissue creates strong “local magnetic fields,” which are nonuniform over small distance scales (~ few μm). The wide distribution of local magnetic field strengths experienced by water protons results in signal decay through magnetization dephasing over this distance scale. This dephasing can potentially lead to signal loss on both gradient echo and spin echo images. Signal decay as a function of echo time on gradient echo sequences represents the total transverse relaxation rate (
A third rate, known as Transverse relaxation rates correlate with cellular iron content in human MagA-expressing MDA-MB-435. Cells were cultured in the presence (filled diamonds) or absence (empty diamonds) of extracellular iron supplementation (250 μM ferric nitrate/medium) and mounted in a gelatin phantom for 3 T MRI.
6
Graphs show the relationship between the irreversible R2 (A) and reversible 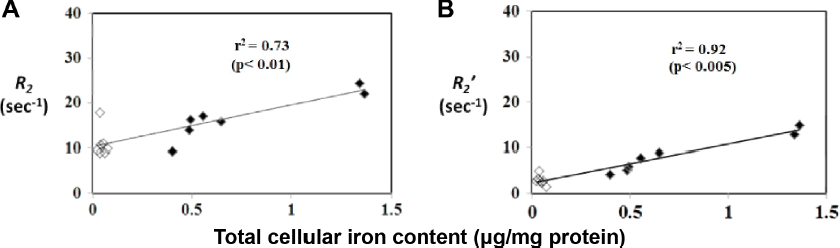
The degree of signal reversibility (influence of iron on
A further interesting feature of iron-containing tissues or cell systems is that the value of R2, measured with multiple spin echo sequences like the Carr–Purcell–Meiboom–Gill, increases with increasing interecho time.13,17–20 That is, the decay becomes more irreversible as the refocusing pulses are moved further apart, providing more time during each refocusing interval for changes in the local magnetic field experienced by diffusing water protons. Recently, this behavior was observed in the context of gene-based iron-labeled expression systems, using the magnetotactic bacterial MagA expression system in human MDA-MB-435 melanoma cells.21,22
Thus far, we have discussed methods of quantifying MRI signal changes associated with iron-labeled cells based on the decay rate of the magnitude of the MRI signal (ie, relaxometry). A different approach involves assessing the influence of iron on the phase of gradient echo signals. Spatial variations in magnetic susceptibility (eg, due to iron or myelin) 23 lead to spatial variations in gradient echo signal phase; hence, this phase distribution depends not only on the magnitude of magnetic susceptibility variations but also on the geometry. 24 Susceptibility-weighted imaging allows for detection of sources of magnetic susceptibility variation but does not account for the geometry of the distribution. 24 Quantitative susceptibility mapping 25 utilizes somewhat sophisticated postprocessing 26 to quantify these phase-related signal changes and to account for the complete spatial distribution of the magnetic susceptibility (ie, geometry).
These, and perhaps other, biophysical considerations of the cellular iron contrast signal will ultimately impinge on the accurate in vivo measurement of MRI reporter gene expression. Since fluctuations in gene expression reflect changes in transcriptional activation, the ideal detection method for MRI reporter gene expression should respond to this modulation in a quantitative manner. 10 A fuller appreciation of how to manipulate the components of the MR signal to best reflect changes in MRI reporter gene expression may include exploitation of the interplay between the irreversible and reversible transverse relaxation rates.
Mammalian Iron Homeostasis and its Influence on MRI Contrast
With few exceptions, cellular iron regulation has not been critically discussed in the context of iron labeling for MRI contrast. However, there are a number of features of mammalian iron homeostasis that should be considered in order to fully appreciate the influence of iron labeling on a given cell type. Cell tracking strategies for MRI that use either SPIO (exogenous) or gene-based (endogenous) iron contrast are superimposed on the cell's intrinsic iron-handling properties.
Systemic regulation
At the minimum, there are two levels of iron regulation currently recognized.
27
At a systemic level, the hepcidin–ferroportin axis regulates iron export and therefore iron recycling (Fig. 2). Hepcidin is a peptide hormone predominantly synthesized in the liver and secreted in response to increases in circulating iron. Hepcidin is the ligand for ferroportin, a transmembrane protein mainly found in the plasma membrane of hepatocytes, enterocytes, and macrophages. Hepcidin–ferroportin binding stimulates receptor (ferroportin) internalization and degradation. In this way, hepcidin regulates systemic iron via posttranslational modulation of iron export from cells positioned to regulate the body's iron levels in the blood and gastrointestinal system.
Overview of key activities in mammalian iron homeostasis. Both systemic and cellular iron regulation are present in mammalian systems. Systemic regulation is controlled by the hepcidin–ferroportin axis. Hepcidin is a peptide hormone, predominantly secreted by the liver, and the ligand for ferroportin (FPN), a transmembrane iron export protein expressed on relatively few cell types. The interaction between hepcidin and FPN downregulates iron export by inducing FPN degradation. Cellular regulation is controlled by the transferrin–transferrin receptor– ferritin axis. Transferrin (Tf) is a serum protein that binds iron and the transferrin receptor (TfRc), a transmembrane iron import protein expressed on most cells. The surplus intracellular iron is stored as a biomineral in the form of ferritin (F), a ferrihydrite core surrounded by a protein shell consisting of heavy and light F subunits. When TfRc levels are high, F levels are low and vice versa. When hepcidin levels are high, FPN levels are low and export is inhibited. This reflects the manner in which the expression of these proteins is regulated.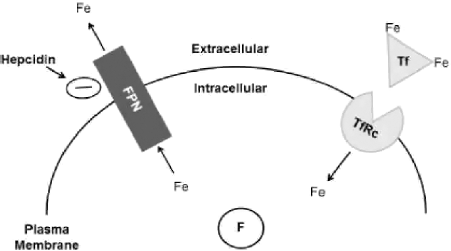
Cellular regulation
Posttranscriptional control of the expression of key iron regulatory proteins * .
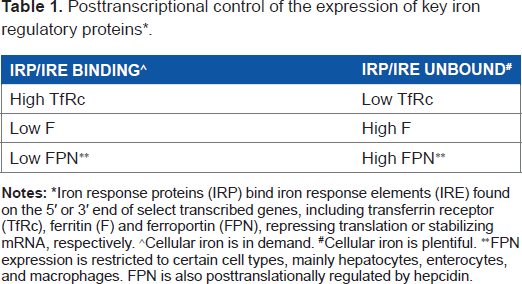
Iron response proteins (IRP) bind iron response elements (IRE) found on the 5’ or 3’ end of select transcribed genes, including transferrin receptor (TfRc), ferritin (F) and ferroportin (FPN), repressing translation or stabilizing mRNA, respectively.
Cellular iron is in demand.
Cellular iron is plentiful.
FPN expression is restricted to certain cell types, mainly hepatocytes, enterocytes, and macrophages. FPN is also posttranslationally regulated by hepcidin.
Like hepcidin, transferrin circulates in the blood. Transferrin binds iron and delivers it to the TfRc for internalization and distribution of iron within the cell as required. 29 Virtually all cells express TfRc at some level. In contrast, most cells do not export iron and contain very little ferroportin. In addition, in vivo mouse models indicate that iron export from cells to blood depends completely on ferroportin. 30 Thus, the endocrine regulation of ferroportin by hepcidin is central to iron physiology and many disease states. Serum iron overload leads to increased hepcidin secretion and subsequent lowering of ferroportin. Conversely, iron deficiency lowers hepcidin and permits high ferroportin expression in target cells.
Influence on cellular contrast
Metabolically active cells have a greater requirement for iron cofactor and will typically express higher levels of TfRc to accommodate this need (Table 1). Ferritin production, on the other hand, will decrease to lower iron storage and facilitate iron availability. In cells overexpressing a modified form of ferritin, in which neither of the two ferritin protein subunits are regulated by IRP, both heavy and light subunits lack the IRE needed for the normal response to cellular iron homeostasis. 31 As a result, the engineered cells can store extra iron, presumably in the form of ferritin. Since this MRI signal was comparable to the magnetosome-like particles detected using MagA expression, our study suggests that iron contrast from magnetotactic bacterial gene expression arises through a mechanism that is distinct from mammalian iron homeostasis. 6 Moreover, Western blot analysis of TfRc levels in each expression system showed appropriate downregulation in response to extracellular iron supplementation, confirming that IRP are functional in these genetically modified cells.
Macrophage are a ferroportin-expressing cell type with the ability to control iron import and export, and thus iron recycling. In the alternatively activated M2 state, macrophages display high TfRc (iron import) and high ferroportin (iron export) activity, and therefore provide effective iron recycling.32,33 However, in response to pro-inflammatory stimuli, which trigger hepcidin expression, macrophages convert to an M1 phenotype represented by low TfRc and low ferroportin expression. Under these conditions, iron recycling is limited and cellular ferritin expression is high, contributing to an iron storage phenotype. The THP-1 cell line has been used extensively to model monocyte and macrophage biology. Using this cell line, Corna et al 32 showed that M1 macrophages only import iron when its extracellular concentration is high, while M2 macrophages can import iron even when its extracellular concentration is low, congruent with an increase in TfRc expression. Understanding the iron biochemistry of M1 and M2 macrophages takes on clinical importance when the hemorrhage that follows myocardial infarction is considered. There is evidence that failure to clear iron leads to dysregulation of the inflammatory response and increased incidence of heart failure.34,35
In the context of gene-based iron labeling for MRI, the literature9,11,31 suggests that most of these engineered cell types will respond to ~200 μM iron supplementation in culture to achieve maximal iron loading and MR detection; however, very few reports have thoroughly examined the intrinsic iron transport characteristics of any given cell type. In human MDA-MB-435 melanoma cells, long-term iron-supplemented culture (containing 250 μM ferric nitrate) has no appreciable effect on transverse relaxation rates in the absence of MagA or modified ferritin overexpression.
6
However in P19 cells, a mouse teratocarcinoma, the untransfected parental cell line displays a pronounced, although transient, increase in transverse relaxation rates and cellular iron content in response to iron supplementation.
5
Further analysis shows that ferroportin expression in P19 is unexpectedly high. The immunoblot in Figure 3 was prepared from total cellular protein from P19 and MDA-MB-435 samples, wherein lysed cells were solubilized and their protein quantified and electrophoretically separated following published procedures.6,36,37 A ferroportin antibody reveals the bands comprising the full-length iron export protein (Fig. 3A, arrow at ~60 K) and its lower molecular weight (MW) degradation products. Relative to an internal housekeeping protein, glyceraldehyde-3-phosphate dehydrogenase (GAPDH; Fig. 3B, band at ~35 K), densitometry indicates that there is ~two to four times more ferroportin (60 K species) in P19 than in MDA-MB-435 (GeneTools, version 3.06.04; Syngene).
High ferroportin expression in P19 cells. Western blots were prepared from P19 and MDA-MB-435 (435) cells, cultured in the presence (+) or absence (-) of iron-supplemented medium containing 250 μM ferric nitrate. Cells were lysed in RIPA buffer (10 mM Tris-HCI ph 7.5/140 mM NaCl/1% NP-40/1% sodium deoxycholate/0.1% sodium dodecyl sulfate [SDS]) containing protease inhibitors. Samples containing equal amounts of protein (80 μg) were separated on 10% gels by SDS polyacrylamide gel electrophoresis under reducing conditions and transferred to a nitrocellulose membrane. The immunoblot was sequentially probed: first with a rabbit antibody to ferroportin (A) and then after stripping, reprobed with a rabbit antibody to a loading control, GAPDH (B). In (A), the arrow points to full length ferroportin. Approximate MW of protein standards is indicated in the right margin.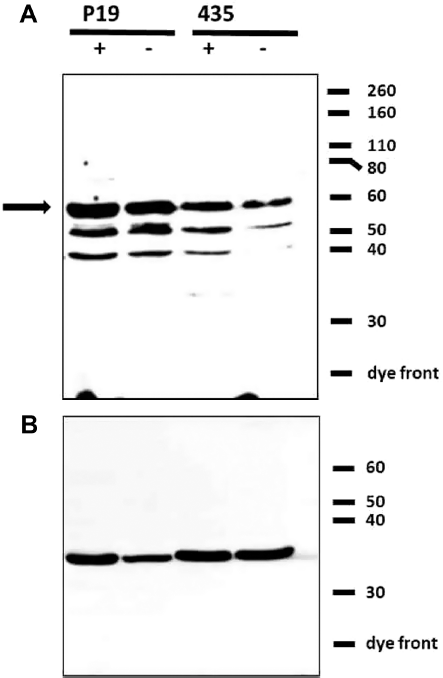
The P19 iron recycling phenotype is similar to alternatively activated M2 macrophages, characterized by high levels of both TfRc and ferroportin activity.5,38 Moreover, despite the active export of iron, MagA-expressing P19 cells display a persistent increase in transverse relaxation rates unlike the transient uptake of iron in the parental line. 5 This result suggests that iron handling and/or compartmentalization secondary to magnetotactic bacterial gene expression is distinct from mammalian iron regulatory mechanisms (manuscript in preparation). We also expect that P19 cells might respond to much lower concentrations of iron supplement and note that Cho et al used 25 μM ferric citrate for effective iron supplementation of MagA-expressing mouse embryonic stem cells. 8 Given the multipotent properties of P19, we speculate that cells with stem-like features may display effective iron recycling.
In conjunction with in vivo repetitive imaging, a dietary iron supplement has been used to optimize the detection of xenografts overexpressing iron-handling proteins like MagA and the modified ferritin subunits. 39 An iron-rich diet should be expected to increase hepcidin secretion, and thus decrease ferroportin expression. This would lower iron export from targeted cells, favoring iron retention and cellular contrast. However, this could be a problem for the specificity of imaging if cells that naturally handle iron, such as macrophages, infiltrate the tumor xenograft as part of the immune response to foreign cell invasion. The M1 macrophage phenotype may increase tumor contrast and report inflammatory rather than tumor cell activity. This may explain the steady increase in parental tumor contrast observed in subcutaneous melanoma cell xenografts over five weeks of repetitive MRI. 39
Iron deficiency has the reverse effect, decreasing systemic hepcidin secretion to permit a rise in ferroportin activity. Iron deficiency or anemia can be induced in several ways, including blood loss, iron chelation, and chronic inflammation. The link between anemia and inflammation involves hepcidin expression, which is transcriptionally regulated by the inflammatory cytokine interleukin 6. 40 Thus, the chronic inflammation of disease may be important to consider when tracking cells or therapies by MRI in preclinical models.41,42
There are further implications for the removal of unwanted iron from cells using inducible ferroportin expression vectors and hepcidin regulation as tools to manipulate the process. In this way, therapeutic cells may be subjected to iron labeling for in vivo tracking with an option to attenuate or reverse the process when it is no longer needed. Appreciating that different cell types can have different iron-handling capabilities should add both insight and versatility to gene-based iron labeling. This understanding should also extend to SPIO labeled cells, in which the MR contrast signal dissipates over time as the cells divide, degrade the SPIO and dispose of the iron mineral. An iron recycling phenotype may speed this process more than an iron storage phenotype.
There are a number of pre/clinical settings where the results and theory presented here can be further investigated. For example, in the case of a heart attack, tissue injury prompts an inflammatory response upon which macrophages act to prevent infection at the site of the wound, remove dead cells, and promote scar tissue formation. 43 Resident macrophages are likely to be the first responders. 44 Resting monocytes, from spleen and bone marrow precursors, may also be recruited to the wound. In the acute phase, pro-inflammatory signaling will induce an M1 macrophage phenotype characterized by low TfRc, high ferritin, and low ferroportin. This iron storage phenotype mimics the iron overload disease state and is associated with high hepcidin levels. Transition to an anti-inflammatory phase is accompanied by a return to an iron recycling phenotype with high TfRc, low ferritin, and high ferroportin. These M2 macrophages are comparable to an iron deficiency disease state, which is associated with low hepcidin levels. There are many questions that surround the inflammatory response in heart disease and many other illnesses with an inflammatory component. Could hepcidin levels be used to monitor the pro-inflammatory response? To what extent does autocrine regulation of iron metabolism influence the local tissue environment? Could gene-based MRI contrast be used to monitor therapy or inflammation-dependent changes in cellular iron using reporter gene expression? There are multiple opportunities for molecular imaging approaches to exploit gene-based iron labeling in the context of systemic and cellular iron biochemistry.
Conclusion
Among the advantages of MRI is the excellent soft tissue contrast and sensitivity of the signal to ferromagnetic particles. By introducing SPIO nanoparticles into cells, the applications of MRI expanded from largely anatomical imaging to include tracking cellular activities. More recent application of gene-based iron labeling to cell tracking strategies has further broadened the possibilities for addressing molecular and cellular function using MRI reporter gene expression. Effective use of this tool will entail development of both MR methods and gene-based iron labeling. In conjunction with expression systems designed to sequester iron biominerals for MRI and circumvent mammalian iron regulation, the influence of iron-handling pathways may nevertheless be important for image interpretation. Choice of cell, capacity for iron uptake and retention, manipulation of plasma iron concentration, and perhaps choice of expression system are likely to factor into the MR detection and analysis.
Author Contributions
Conceived and designed the experiments: DEG, NG, AS, FSP. Analyzed the data: DEG, NG, AS, FSP. Wrote the first draft of the manuscript: DEG, NG. Contributed to the writing of the manuscript: DEG, NG, FSP, AS. Agree with manuscript results and conclusions: DEG, NG, AS, FSP. Jointly developed the structure and arguments for the paper: DEG, NG, AS, FSP. Made critical revisions and approved final version: DEG, NG, AS, FSP. All authors reviewed and approved of the final manuscript.
Footnotes
Acknowledgments
The authors thank Dr. Kevin White for statistical expertise. Sarah Donnelly and Joyce Jang provided technical assistance. P19 cells were a gift from Dr. Lisa Hoffman. MDA-MD-435 cells were a gift from Dr. Jim Koropatnick.
This article was assembled by Donna E. Goldhawk, who wrote the introduction, conclusion, and section on iron metabolism, and contributed Figures 2 and 3. Neil Gelman wrote the section on MRI. Anindita Sengupta completed her MSc under the supervision of Drs. Gelman and Goldhawk and contributed ![]() . Frank S. Prato provided scientific feedback on the manuscript, particularly related to the detection of gene-based MR contrast in the inflammatory model of heart disease.
. Frank S. Prato provided scientific feedback on the manuscript, particularly related to the detection of gene-based MR contrast in the inflammatory model of heart disease.